MTF Non Repaint Arrow Five Moving Average RTD
- インディケータ
- バージョン: 2.20
- アップデート済み: 9 7月 2026
- アクティベーション: 20

【V 1.00】MTF NRPA 5 移動平均RTDがリリースされました!
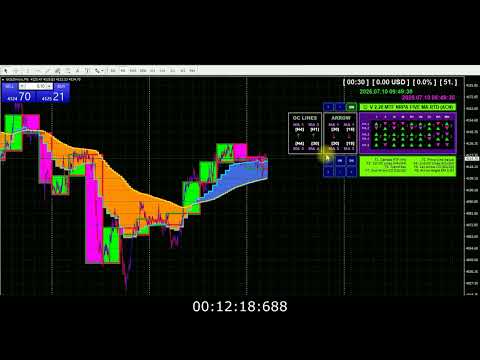
非再描画矢印リアルタイム ダッシュボード。
最適な移動平均インジケーターをお探しなら、ここが正しいページです。 一般に、2 つの移動平均の交点 (クロスオーバー) が次の価格トレンドの方向を決定するため、2 つの移動平均を設定します。 高速移動平均が低速移動平均と交差し、高速 > 低速の場合、トレンドは上昇しています。 逆に、速い移動平均が遅い移動平均と交差し、速い < 遅い場合、トレンドは下降しています。 2 つの移動平均の欠点は、長期的な傾向が見えないことです。 それが私がこの取引ツールを開発した理由です。
それは次のように説明されています。
この取引ツールでは、5 つの移動平均を使用します。 はい、5つです! デフォルトでは、MA 1 と MA 2 を大きな時間枠 (H1) に設定します。 MA 1 と MA 2 の交差は、上半期の時間枠でトレンドの変化があることを意味します。 次に、現在の時間枠(小さい)に MA 3 と MA 4 を設定します。たとえば、M5 でチャートを開きます。 MA 3 と MA 4 の交差点は、現在のタイムフレーム (M5) にトレンドの変化があることを意味します。 次に、トレンドの動きを確認するために、現在の時間枠で MA 5 を設定しました。
この取引ツールには驚くべきことがたくさんあります。
5つのMAの時間枠はお好みに合わせて変更できます。 線のスタイルを変更したり、色のスタイルを変更したり、MA 交差点の矢印の種類を変更したり、MA パラメータを好みに合わせて変更したりできます。 さらに優れているのは、5 つの MA のリアルタイム 9TF ダッシュボード モニターです。 適用できるダッシュボードの配色は 10 種類あります。 さて、ダッシュボード内のシンボルについて説明しましょう。 シンボルには2種類あります。 三角形のシンボル (上と下) と矢印のシンボル (上と下)。 ライム色の三角形のシンボルは、MA 角度が正であり、トレンドが上昇していることを示します。 赤色の三角形のシンボルは MA 角度がマイナスであることを示し、これは下降トレンドを意味します。 さらに、MA 1 が MA 2 の上か下か、MA 3 が MA 4 の上か下かを観察できます。これは、上向きまたは下向きの矢印記号で確認できます。 さらにあります。 ボタン機能。 ボタンをクリックすると、ワンクリックでこのインジケーターの表示/非表示を切り替えることができます。
これはまさに必須の取引ツールです。
価格が高騰する前に、この取引ツールを急いで購入してください!
自信を持ってエントリーして、プロのように取引しましょう。
ありがとう。
#移動平均 #移動平均取引戦略 #指数関数的 #取引指標 #取引外国為替 #取引のヒント #ベスト指標