KT Renko Patterns MT4
- Göstergeler
- Sürüm: 2.3
- Güncellendi: 15 Şubat 2021
- Etkinleştirmeler: 5

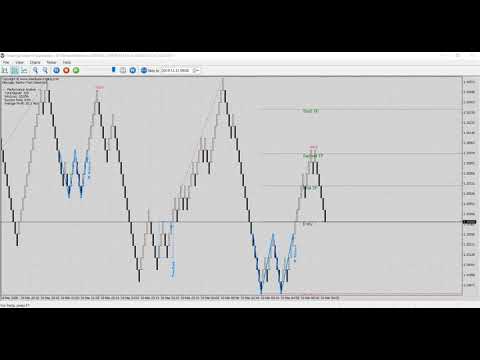
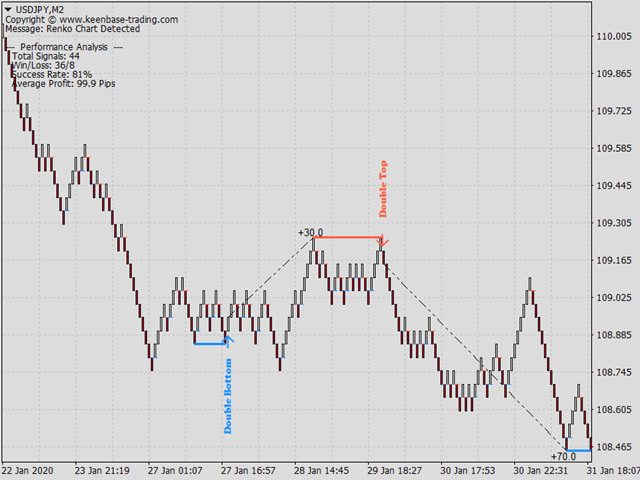
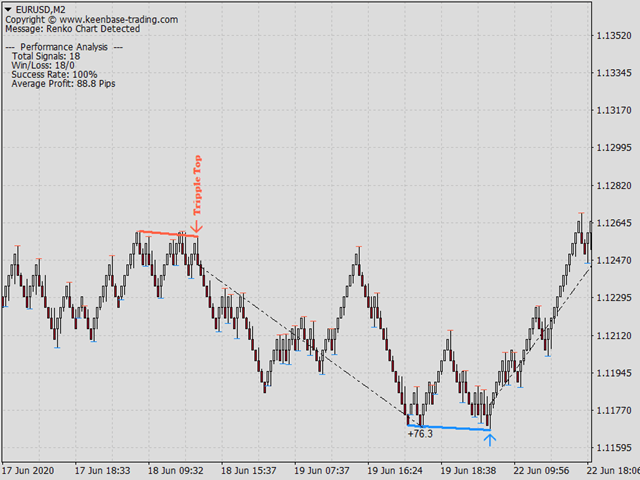
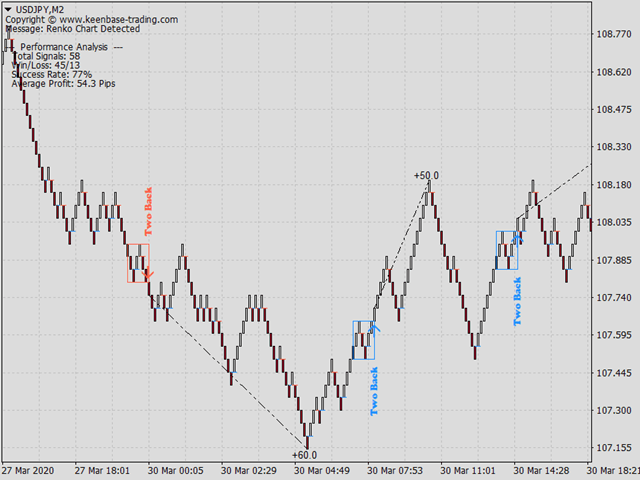
KT Renko Patterns, Renko grafiğini tuğla tuğla tarayarak, farklı finansal piyasalarda yatırımcılar tarafından sıkça kullanılan popüler grafik formasyonlarını tespit eder.
Zaman tabanlı grafiklerle karşılaştırıldığında, Renko grafiklerinde işlem yapmak daha kolay ve belirgindir çünkü grafik sade ve temiz bir yapıya sahiptir.
KT Renko Patterns birçok Renko formasyonunu içerir ve bunların çoğu Prashant Shah'ın “Renko Grafikleriyle Karlı Ticaret” adlı kitabında ayrıntılı olarak açıklanmıştır.
Bu göstergeye dayalı %100 otomatik bir Uzman Danışman (EA) burada mevcuttur - KT Renko Patterns EA.
Özellikler
- Belirsizlik olmadan sekiz farklı net Renko formasyonu ile işlem yapın.
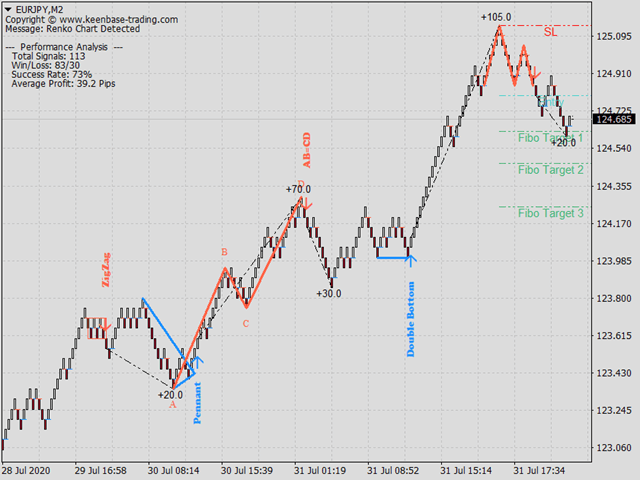
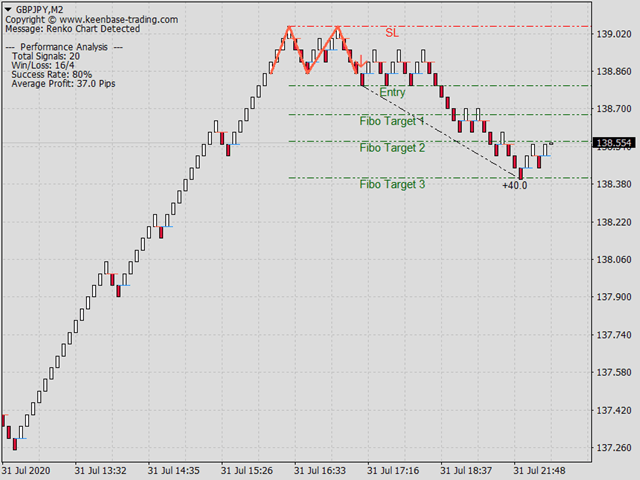
- Her formasyon için stop-loss ve Fibonacci hedefleri sağlanarak objektiflik sunulur.
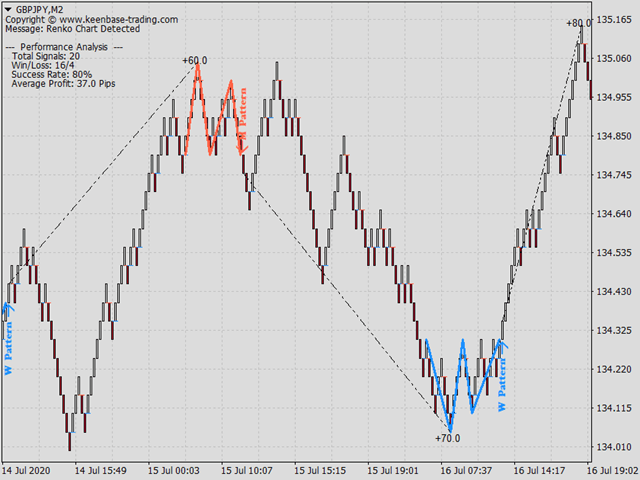
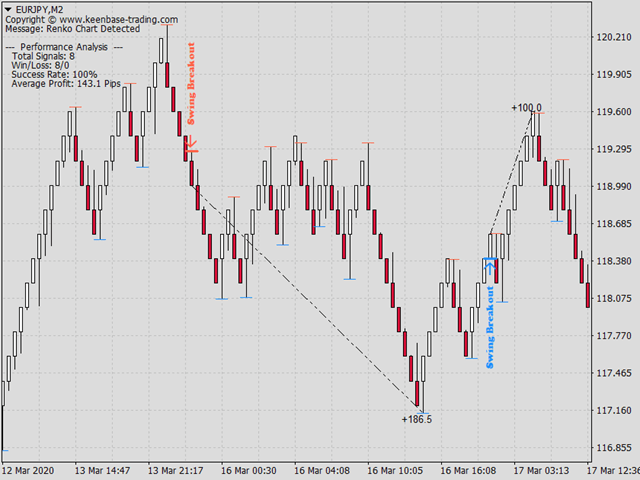
- KT Renko Patterns, her formasyonun doğruluğunu sürekli olarak ölçer ve önemli istatistikleri grafik üzerinde gösterir.
- Renko tuğla dönüşleri işaretlenir ve anlık uyarılar sağlanır, böylece ani geri dönüşlerde erken çıkışlar planlanabilir.
- Belirlenen formasyonlar yeniden çizilmez veya değişmez.
Dahil Edilen Formasyonlar
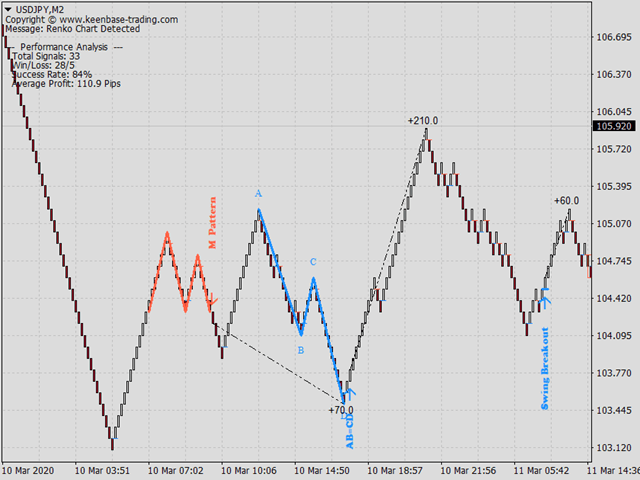
- W-M Formasyonu
- Güçlü Üçgenler
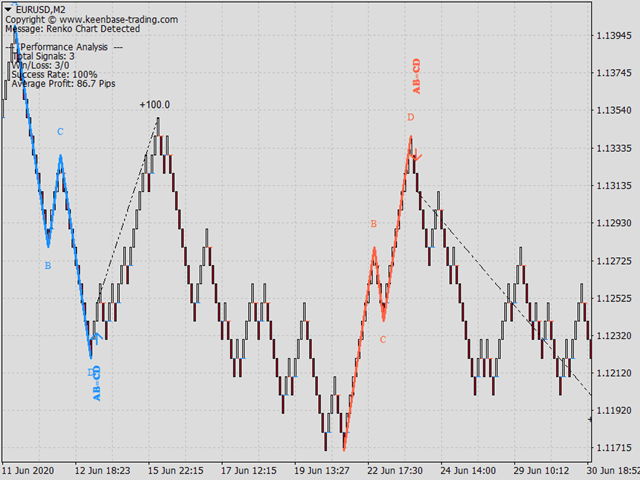
- AB=CD Formasyonu
- Üçlü Tepe / Üçlü Dip
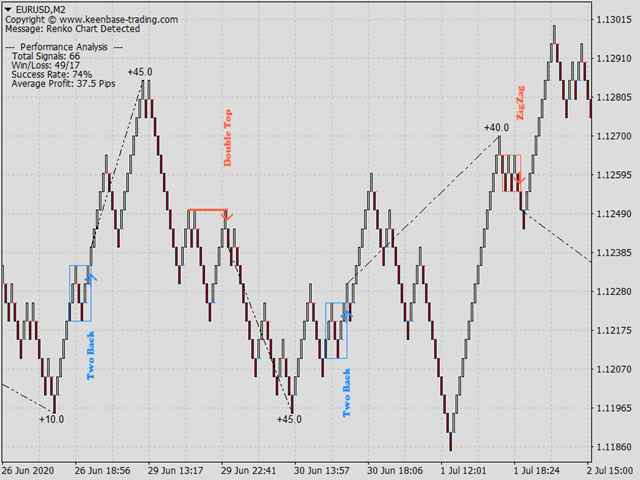
- İkili Tepe / İkili Dip
- Two Back Strike
- ZigZag Tuğlalar
- Swing Breakout
Sinyal Doğruluğunu Optimize Etme
KT Renko Patterns birden fazla formasyon gösterir fakat her formasyon her sembol için uygun olmayabilir. Doğruluğu artırmak için şu adımları izleyin:
- Her formasyonun “True” olarak ayarlandığından emin olun.
- Bir “Başarı Oranı Kriteri” seçin (ikinci TP önerilir).
- Formasyonları tek tek kapatın ve başarı oranını gözlemleyin.
- Bir formasyonu kapatmak başarı oranını artırıyorsa, kapalı bırakın.
- Azaltıyorsa, tekrar açın.
- “Formasyonlar Arası Minimum Bar Sayısı” değerini 20 ile 100 arasında ayarlayın.
Girdi Parametreleri
- Formasyonlar Arası Minimum Bar: Her formasyon arasında minimum bar sayısı. Sinyal doğruluğunu artırır.
- Tuğla Dönüşünü İşaretle: Renko tuğlalarının dönüşlerini grafikte işaretler.
- Dönüş Uyarıları: Aktifse, her dönüşte uyarı üretir.
- Formasyon İsmini Göster: Her sinyalin yanına formasyon adını yazar.
- Performans Analizi: Gösterge kendi performansını ölçer ve önemli metrikleri gösterir.
- Başarı Oranı Kriteri: Sinyal başarı oranını ölçmek için kullanılır.
Sık Sorulan Sorular
S. Zaman tabanlı standart grafiklerde çalışır mı?
C. KT Renko Patterns, Renko tuğlaları için özel olarak geliştirildi. Zaman grafiklerinde de çalışır ama önerilmez.
S. Sinyal doğruluğu optimize edilebilir mi?
C. Evet. Yukarıda açıklanan adımları takip edebilirsiniz.
S. Yeni bir formasyon fikrim var. Eklenebilir mi?
C. Lütfen bize mesaj gönderin. Ekibimiz uygun görürse bir sonraki versiyona ekleriz.
S. Bu göstergeyi bir EA’ye aktarabilir miyim?
C. Evet. Geliştirici kodunu almak için bizimle iletişime geçin.


Absolutely the best Indicator for renko that I have ever used to give me a good entry position that I can trust based upon simple setups without the noise. My only regret is that I did not just buy it at at first and save $100. This is a no brainer it does all the analytical work for you. All you have to do is pull the trigger.