ACB Breakout Arrows MT5

5

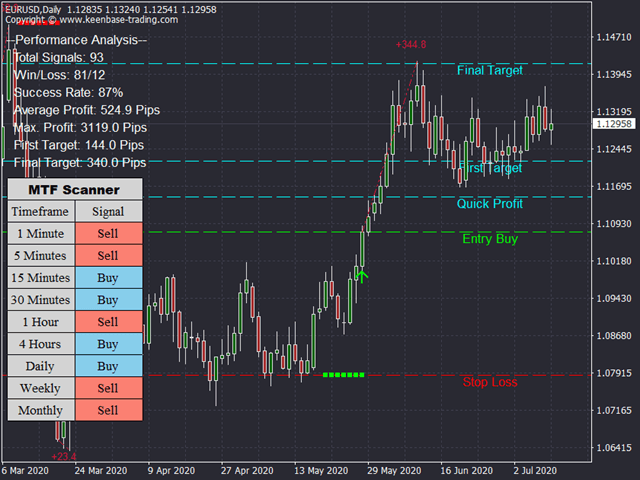
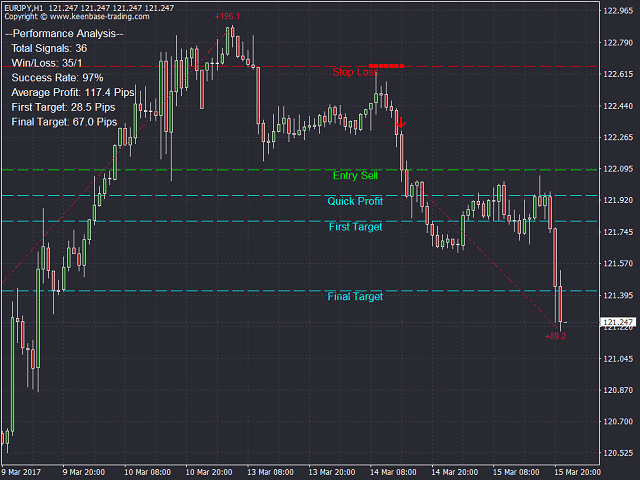
ACB Breakout Arrows göstergesi, özel bir kırılma modelini tespit ederek piyasada önemli bir giriş sinyali sağlar. Göstergenin algoritması, fiyatın belirli bir yönde ivme kazandığı anları sürekli olarak tarar ve ana hareketten hemen önce doğru giriş sinyali verir.

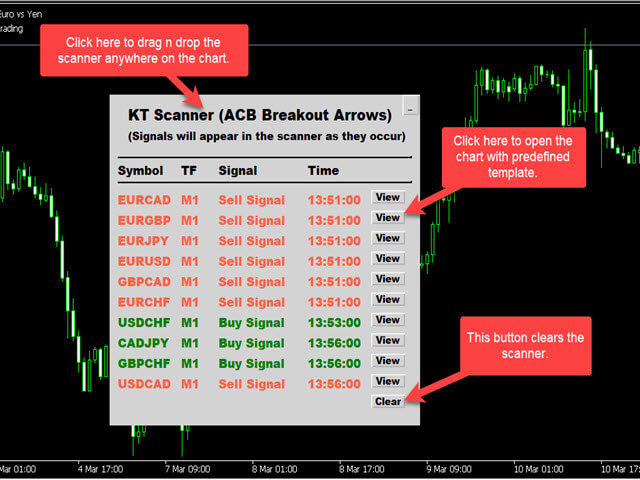
Çok sembollü ve çok zaman dilimli tarayıcıyı buradan alın - ACB Breakout Arrows MT5 için Tarayıcı


Temel Özellikler

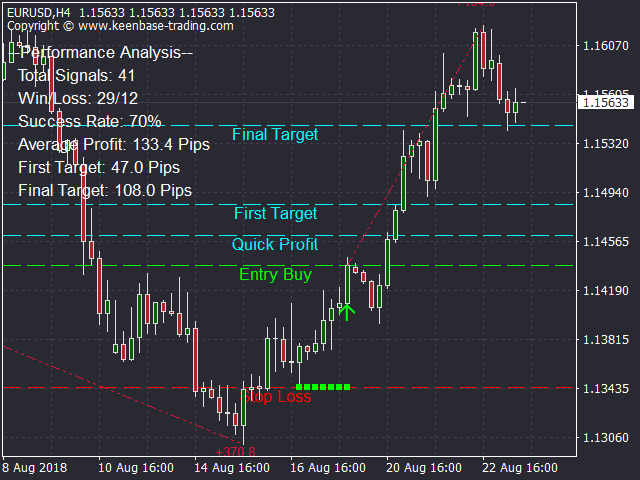
  • Gösterge, Stop Loss ve Take Profit seviyelerini otomatik olarak belirler.
  • Tüm zaman dilimlerinde kırılma sinyallerini izleyen MTF tarayıcı paneli dahildir.
  • Gün içi, salınım ve scalping yapan trader’lar için uygundur.
  • Sinyal doğruluğunu artırmak için optimize edilmiş algoritma.
  • Break-even hareketi veya hızlı kâr hedefi için özel seviye (Hızlı Kâr Çizgisi).
  • Kazanma/kaybetme oranı, başarı yüzdesi, ortalama kâr gibi performans analiz metrikleri sunar.
  • Yeniden çizim yapmaz.


İşlem Onayı

- Düşük olasılıklı işlemleri filtrelemek için ACB Trade Filter göstergesini kullanın.

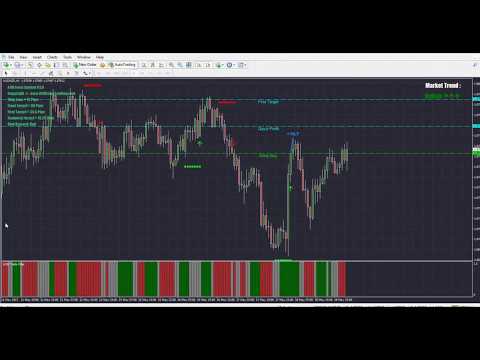
  • Güçlü Alım: Yukarı ok + Yeşil histogram + Boğa trendi.
  • Güçlü Satış: Aşağı ok + Kırmızı histogram + Ayı trendi.
  • Histogram gri ve trend yataysa, işlem yapmaktan kaçının.

(isteğe bağlı) -
 KT Destek ve Direnç Seviyeleri göstergesini kullanarak önemli destek/direnç seviyeleri yakınındaki işlemlerden kaçınabilirsiniz. Bu tür girişler hızla zarar getirebilir.

“Başarılı bir trader’ın amacı en iyi işlemleri yapmaktır. Para ikinci plandadır.” – Alexander Elder
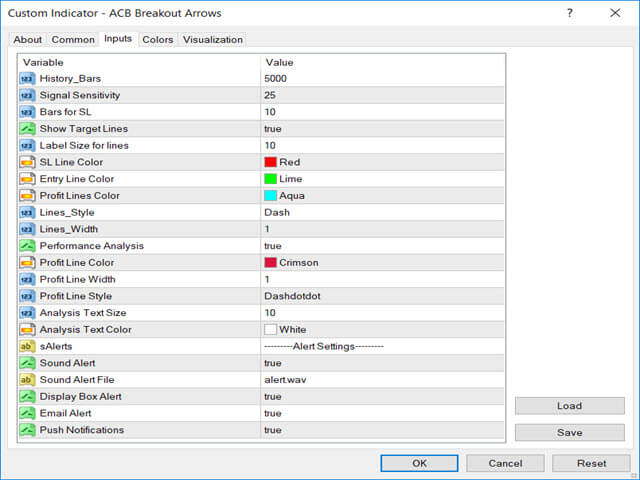

Girdi Parametreleri

  • Geçmiş Bar Sayısı: Göstergenin hesaplamasında dikkate alınacak bar sayısı.
  • Sinyal Hassasiyeti: Ok sinyalinin hassasiyetini belirleyin.
  • SL için Bar Sayısı: Stop loss hesaplamasında kullanılacak bar sayısı.
  • Hedef Çizgilerini Göster: SL, TP ve Hızlı Kâr çizgilerinin grafik üzerinde gösterilip gösterilmeyeceğini ayarlayın.
  • Performans Analizi: Her sinyal için kâr trendi dahil performans analizi öğelerini göster/gizle.
  • Uyarı Ayarları: Uyarı kutusu, e-posta, push bildirimi ve sesli uyarılar desteklenir.


EA Geliştiricileri İçin

// dizi tanımla

double Buy_Arrow[];
double Sell_Arrow[];
double Buy_SL[];
double Sell_SL[];

// gösterge tanımla

int ACB_handle = iCustom(_Symbol,0,"Market/ACB Breakout Arrows");

// verileri dizilere kopyala

CopyBuffer(ACB_handle,0,1,1,Buy_Arrow);
CopyBuffer(ACB_handle,1,1,1,Sell_Arrow);
CopyBuffer(ACB_handle,2,1,1,Buy_SL);
CopyBuffer(ACB_handle,3,1,1,Sell_SL);

if(Buy_Arrow[0] != 0) // Alım şartı
if(Sell_Arrow[0] != 0) // Satış şartı

Buy_SL[0]; // Alım stop loss
Sell_SL[0]; // Satış stop loss

// Grafik üzerinden hedef seviyeleri al

double Quick_Profit = NormalizeDouble(ObjectGetDouble(0, "FirstTarget", OBJPROP_PRICE), _Digits);
double First_Target = NormalizeDouble(ObjectGetDouble(0, "Target1", OBJPROP_PRICE), _Digits);
double Final_Target = NormalizeDouble(ObjectGetDouble(0, "Target2", OBJPROP_PRICE), _Digits);
İncelemeler 1
MarketWatch27378757
152
MarketWatch27378757 2022.01.05 19:20 
 

...

Önerilen ürünler
Trade smarter, not harder: Empower your trading with Harmonacci Patterns This is arguably the most complete harmonic price formation auto-recognition indicator you can find for the MetaTrader Platform. It detects 19 different patterns, takes fibonacci projections as seriously as you do, displays the Potential Reversal Zone (PRZ) and finds suitable stop-loss and take-profit levels. [ Installation Guide | Update Guide | Troubleshooting | FAQ | All Products ] It detects 19 different harmonic pri
RR Ratio KS Visual Calculator Unlock effortless risk-reward mastery with the RR Ratio KS Visual Calculator —a sleek, professional MetaTrader 5 indicator that automates TP/SL calculations and delivers crystal-clear visual setups directly on your chart. No more tedious manual math or miscalculations: it instantly computes precise dollar amounts based on your lot size and position direction (buy/sell), displaying interactive lines for TP, SL, half-price targets, and open levels. Perfect for traders
Double HMA MTF for MT5
Pavel Zamoshnikov
4 (4)
This is an advanced multi-timeframe version of the popular Hull Moving Average (HMA) Features Two lines of the Hull indicator of different timeframes on the same chart. The HMA line of the higher timeframe defines the trend, and the HMA line of the current timeframe defines the short-term price movements. A graphical panel with HMA indicator data from all timeframes at the same time . If the HMA switched its direction on any timeframe, the panel displays a question or exclamation mark with a tex
KT Renko Patterns MT5
KEENBASE SOFTWARE SOLUTIONS
KT Renko Patterns, Renko grafiğini tuğla tuğla tarayarak, farklı finansal piyasalarda yatırımcılar tarafından sıkça kullanılan popüler grafik formasyonlarını tespit eder. Zaman tabanlı grafiklerle karşılaştırıldığında, Renko grafiklerinde işlem yapmak daha kolay ve belirgindir çünkü grafik sade ve temiz bir yapıya sahiptir. KT Renko Patterns birçok Renko formasyonunu içerir ve bunların çoğu Prashant Shah'ın “Renko Grafikleriyle Karlı Ticaret” adlı kitabında ayrıntılı olarak açıklanmıştır. Bu g
Fibaction
Abdelkhalek Orabi
Indicator Name: Fibaction – price action candle Detector Description: Fibo Signal Boxes is a powerful Smart Money Concept (SMC)-inspired indicator that auto-detects price action candles. bullish hammers and shooting stars, then draws precise Fibonacci entry zones and multiple take-profit levels directly on the chart. as for the SL personally i use 40 pips rules  Key Features: Detects bullish hammer and shooting star reversal candles. Automatically draws Fibonacci entry and TP boxes. as
Unlock key market insights with automated support and resistance lines Tired of plotting support and resistance lines? This is a multi-timeframe indicator that detects and plots supports and resistance lines in the chart with the same precision as a human eye would. As price levels are tested over time and its importance increases, the lines become thicker and darker, making price leves easy to glance and evaluate. [ Installation Guide | Update Guide | Troubleshooting | FAQ | All Products ] Boos
Overview The Market Perspective Structure Indicator is a comprehensive MetaTrader indicator designed to provide traders with a detailed analysis of market structure across multiple timeframes. It identifies and visualizes key price action elements, including swing highs and lows, Break of Structure (BOS), Change of Character (CHOCH), internal structures, equal highs/lows, premium/discount levels, previous levels from higher timeframes, and trading session zones. With extensive customization opt
MercariaPattern1-2-3 відстежує рух ціни, знаходить трьоххвильові структури 1-2-3 та підсвічує момент, коли сценарій підтверджується пробоєм ключового рівня. MercariaPattern1-2-3 tracks price movement, detects three-leg 1-2-3 structures and highlights the moment when the scenario is confirmed by a key level breakout. Індикатор збирає локальні свінги в компактну фігуру 0–1–2–3 , чекає підтвердженого пробою та будує стрілку входу з готовими рівнями SL/TP. The indicator combines local swings into a
Owl Smart Levels MT5
Sergey Ermolov
4.03 (32)
MT4 versiyonu  |  FAQ Owl Smart Levels Indicator , Bill Williams'ın gelişmiş fraktalları , piyasanın doğru dalga yapısını oluşturan Valable ZigZag ve kesin giriş seviyelerini gösteren Fibonacci seviyeleri gibi popüler piyasa analiz araçlarını içeren tek gösterge içinde eksiksiz bir ticaret sistemidir. pazara ve kar elde edilecek yerlere. Stratejinin ayrıntılı açıklaması Gösterge ile çalışma talimatı Baykuş Yardımcısı ticaretinde Danışman Yardımcısı Kullanıcıların özel sohbeti -> Satın aldıktan
L'indicatore SMC Venom Model BPR è uno strumento professionale per i trader che operano nell'ambito del concetto di Smart Money (SMC). Identifica automaticamente due modelli chiave sul grafico dei prezzi: FVG   (Fair Value Gap) è una combinazione di tre candele, in cui c'è un gap tra la prima e la terza candela. Forma una zona tra livelli in cui non c'è supporto di volume, il che spesso porta a una correzione dei prezzi. BPR   (Balanced Price Range) è una combinazione di due modelli FVG che for
STRICTLY FOR BOOM INDEX ONLY!!!!! Here I bring the Maximum Trend Arrows OT1.0 MT5 indicator. This indicator is made up of a combination of different trend indicators for entries and exits, for entries an orange arrow will paint on the chart below the current market and a red flag for closing of trades and it produces buy arrows only. When the orange arrow appears, it will appear along with it's sound to notify you. The 1H timeframe is recommended, don't use it anywhere else than on the 1H timefr
ATrend
Zaha Feiz
4.82 (17)
ATREND: Nasıl Çalışır ve Nasıl Kullanılır ### Nasıl Çalışır "**ATREND**" göstergesi, MT5 platformu için tasarlanmış olup, traderlara sağlam alım ve satım sinyalleri sağlamak amacıyla teknik analiz metodolojilerinin bir kombinasyonunu kullanır. Bu gösterge, öncelikle volatilite ölçümü için Ortalama Gerçek Aralık (ATR) kullanır ve potansiyel piyasa hareketlerini belirlemek için trend tespit algoritmalarıyla birleştirir. Satın aldıktan sonra bir mesaj bırakın ve özel bir bonus hediyesi kazanın. ##
TRI Visualizer
Yoshimi Mon 三 Ura
TRI Visualizer MT5 – Thermodynamic Market Analysis Overview The TRI (Thermal Range Indicator) Visualizer Enhanced is a rare market analysis indicator that goes beyond conventional technical analysis, applying principles of thermodynamics from physics. It interprets market price fluctuations as “thermodynamic energy,” enabling the highly accurate detection of subtle market changes that are often overlooked. Innovative Mechanisms 1. Dual Calculation Engines Classic TRI Mode Formula: |Close
Max Min Delta Indicator - Market Volume Imbalance Analysis Gain Deeper Insights into Market Volume Imbalance with Delta Analysis What is the Max Min Delta Indicator? The Max Min Delta Indicator is a powerful market volume analysis tool that visually represents maximum and minimum delta values using a histogram. It helps traders identify market strength, weakness, absorption, and aggressive buying/selling activity with precision. Key Features Histogram Visualization: Displays Max Delta (Green) an
This trading indicator is non-repainting, non-redrawing, and non-lagging, making it an ideal choice for both manual and automated trading. It is a Price Action–based system that leverages price strength and momentum to give traders a real edge in the market. With advanced filtering techniques to eliminate noise and false signals, it enhances trading accuracy and potential. By combining multiple layers of sophisticated algorithms, the indicator scans the chart in real-time and translates comple
KT Horizontal Lines MT5
KEENBASE SOFTWARE SOLUTIONS
MetaTrader’da birden fazla   yatay çizgi   çizmek ve bu çizgilerin fiyat seviyelerini takip etmek zahmetli olabilir. Bu gösterge, fiyat uyarıları ayarlamak, destek/direnç seviyelerini çizmek ve diğer manuel işlemler için eşit aralıklarla otomatik olarak birden fazla yatay çizgi çizer. Bu gösterge, hızlı alım-satımlarla kâr elde etmeyi hedefleyen yeni başlayan Forex yatırımcıları için uygundur. Yatay çizgiler, piyasa bir trend izliyorken ya da yatay seyrederken işlem başlatılabilecek potansiyel a
DYJ BoS göstergesi, piyasa yapısındaki değişimlerin temel unsurlarını otomatik olarak belirler ve işaretler, bunlar arasında şunlar yer alır: Yapının Kırılması (BoS): Fiyatın önceki bir yapı noktasını kırarak önemli bir hareket yapması durumunda tespit edilir. Olası yükseliş trendi çizgilerini ve düşüş trendi çizgilerini (UP & DN, yani sürekli yeni zirveler ve yeni dipler) işaretler ve fiyat bu çizgileri aştığında kırmızı (AYI) ve yeşil (BOĞA) okları işaretler BoS genellikle fiyatın önceki f
Bu, fiyat etiketleriyle (devre dışı bırakılabilir)   Gelişmiş ZigZag Dinamik   ve/veya   Genişletilmiş Fraktallar   göstergesi ekstremumlarına dayalı destek ve direnç seviyelerinin bir MTF göstergesidir. MTF modu için daha yüksek TF'ler seçilebilir. Varsayılan olarak, seviyeler ZigZag gösterge noktalarına göre oluşturulur. Fraktal gösterge noktaları da ZigZag ile birlikte veya onun yerine kullanılabilir. Kullanımı basitleştirmek ve CPU zamanından tasarruf etmek için, açılışta her çubuk için bir
The RSI Divergence + FVG Signal indicator combines Relative Strength Index (RSI) Divergence with Fair Value Gap (FVG) detection to generate high-probability buy and sell signals based on both momentum shifts and institutional imbalance zones. Core Features: RSI Divergence Detection : Identifies both regular and hidden bullish/bearish divergences between price and RSI. Divergences indicate potential trend reversals or continuation. FVG Zone Recognition : Detects Fair Value Gaps (imbalances caused
The new update makes this indicator a complete tool for studying, analyzing and operating probabilistic patterns. It includes: On-chart Multi-asset percentage monitor. Configurable martingales. Twenty-one pre-configured patterns, including Mhi patterns and C3. An advanced pattern editor to store up to 5 custom patterns. Backtest mode to test results with loss reports. Trend filter. Hit operational filter. Martingale Cycles option. Various types of strategies and alerts. Confluence between patter
Genel Bakış Universal Trendline Breakout Strategy , trend çizgisi kırılmalarını hassas şekilde tespit edip işlem yapmayı sağlayan gelişmiş bir MetaTrader 5 göstergesidir. Pivot analizi ile dinamik destek ve direnç seviyelerini otomatik olarak belirler ve trend çizgilerini gerçek zamanlı çizer. Temel Özellikler Pivot noktaları ile otomatik trend çizgisi tespiti Destek ve direnç kırılmalarında uyarılar Renk, çizgi kalınlığı, maksimum çizgi sayısı ve uzatma ayarları özelleştirilebilir Trend çizgile
Auto Optimized RSI , doğru alım ve satım sinyalleri vermek için tasarlanmış, kullanımı kolay ve akıllı bir ok göstergesidir. Geçmiş verilere dayalı işlem simülasyonları kullanarak, her enstrüman ve zaman dilimi için en etkili RSI seviyelerini otomatik olarak belirler. Bu gösterge, bağımsız bir işlem sistemi olarak veya mevcut stratejinize entegre edilerek kullanılabilir ve özellikle kısa vadeli işlem yapanlar için faydalıdır. Geleneksel RSI’nin sabit seviyeleri (örneğin 70/30) yerine,   Auto Opt
ProEngulfing'in ücretsiz versiyonu, QualifiedEngulfing, günde bir sinyal sınırlaması ve daha az özellik sunmaktadır. Koala Trading Solution kanalına MQL5 topluluğunda katılmak için, tüm Koala ürünleri hakkında en son haberleri öğrenmek için aşağıdaki bağlantıyı kullanın: https ://www .mql5 .com /en /channels /koalatradingsolution Bu ürünün MT4 versiyonu aşağıdaki bağlantıdan indirilebilir: https ://www .mql5 .com /en /market /product /52023 ProEngulfing Tanıtımı – MT4 için Profesyonel Engulfing
Your Trend Friend
Luigi Nunes Labigalini
5 (1)
The trend is your friend! Look at the color of the indicator and trade on that direction. It does not  repaint. After each candle is closed, that's the color of the trend. You can focus on shorter faster trends or major trends, just test what's most suitable for the symbol and timeframe you trade. Simply change the "Length" parameter and the indicator will automatically adapt. You can also change the color, thickness and style of the lines. Download and give it a try! There are big movements w
PZ Trend Trading MT5
PZ TRADING SLU
3.8 (5)
Capture every opportunity: your go-to indicator for profitable trend trading Trend Trading is an indicator designed to profit as much as possible from trends taking place in the market, by timing pullbacks and breakouts. It finds trading opportunities by analyzing what the price is doing during established trends. [ Installation Guide | Update Guide | Troubleshooting | FAQ | All Products ] Trade financial markets with confidence and efficiency Profit from established trends without getting whip
The Trend Duration Forecast MT5 indicator is designed to estimate the probable lifespan of a bullish or bearish trend. Using a Hull Moving Average (HMA) to detect directional shifts, it tracks the duration of each historical trend and calculates an average to forecast how long the current trend is statistically likely to continue. This allows traders to visualize both real-time trend strength and potential exhaustion zones with exceptional clarity. KEY FEATURES Dynamic Trend Detection:   Utiliz
Noize Absorption Index - is the manual trading system that measures the difference of pressure between bears forces and bulls forces. Green line - is a noize free index that showing curent situation. Zero value of index shows totally choppy/flat market.Values above zero level shows how powerfull bullish wave is and values below zero measures bearish forces.Up arrow appears on bearish market when it's ready to reverse, dn arrow appears on weak bullish market, as a result of reverse expectation.
Was: $249  Now: $99   Market Profile defines a number of day types that can help the trader to determine market behaviour. A key feature is the Value Area, representing the range of price action where 70% of trading took place. Understanding the Value Area can give traders valuable insight into market direction and establish the higher odds trade. It is an excellent addition to any system you may be using. Inspired by Jim Dalton’s book “Mind Over Markets”, this indicator is designed to suit the
Trend Master Chart MT5
Frederic Jacques Collomb
Trend Master Chart ihtiyacınız olan trend göstergesidir. Grafiği kaplar ve farklı pazar trendlerini/hareketlerini tanımlamak için renk kodlamasını kullanır. İki hareketli ortalamayı ve farklı osilatörleri birleştiren bir algoritma kullanır. Bu üç elementin periyotları değiştirilebilir. Herhangi bir zaman diliminde ve herhangi bir Çiftte çalışır. Bir bakışta yükseliş veya düşüş trendini ve bu trende farklı giriş noktalarını tespit edebileceksiniz. Örneğin, belirgin bir yükseliş eğilimi sırasında
No Demand No Supply MT5
Trade The Volume Waves Single Member P.C.
No Demand No Supply   This indicator identifies   No Demand –No Supply candles to your chart and plots volume bars colored according to the signal. It can be applied to all timeframes or to a specific one only. It can also be used as regular volume indicator  with exceptional future of WEIGHTED VOLUME. Furthermore is has an alert notification, sound and email when a signals occurs. The indicator does not repaint but the alert will come on two candles back due to the definition of No Demand No Su
Bu ürünün alıcıları ayrıca şunları da satın alıyor
Divergence Bomber
Ihor Otkydach
4.99 (77)
Bu göstergeyi satın alan herkese aşağıdaki ekstra içerikler ücretsiz olarak sunulmaktadır: Her işlemi otomatik olarak yöneten, Stop Loss ve Take Profit seviyelerini ayarlayan ve işlemleri strateji kurallarına göre kapatan özel yardımcı araç: "Bomber Utility" Göstergenin farklı varlıklar üzerinde kullanılmasına yönelik ayar dosyaları (set dosyaları) Bomber Utility için 3 farklı modda kullanım sunan ayar dosyaları: "Minimum Risk", "Dengeli Risk" ve "Bekle-Gör Stratejisi" Bu ticaret stratejisini hı
SynaptixQuant Dominance Matrix
Devie Arevalo Montemayor
5 (1)
SynaptixQuant Dominance Matrix: Institutional-Grade Market State Extraction Engineered for traders who require a data-driven view of market behaviour beyond surface-level indicators. The Synaptix Quant (SQ) Dominance Matrix is not a conventional currency strength display. Behind its intentionally streamlined interface runs a sophisticated analytical architecture designed to quantify market conditions with precision. Every output is generated through layered signal processing built to identify d
Grabber System MT5
Ihor Otkydach
4.79 (19)
Size mükemmel bir teknik gösterge olan Grabber’ı tanıtıyorum. Bu araç, kullanıma hazır bir “her şey dahil” işlem stratejisi olarak çalışır. Tek bir yazılım kodu içinde güçlü piyasa teknik analiz araçları, işlem sinyalleri (oklar), uyarı işlevleri ve push bildirimleri entegre edilmiştir. Bu göstergeyi satın alan herkes aşağıdaki hediyeleri ücretsiz olarak alır: Açık emirleri otomatik yönetmek için Grabber Yardımcı Aracı Kurulum, yapılandırma ve nasıl işlem yapılacağını adım adım anlatan video kıl
Quantum TrendPulse
Bogdan Ion Puscasu
5 (19)
SuperTrend   ,   RSI   ve   Stochastic'in   gücünü tek bir kapsamlı göstergede birleştirerek işlem potansiyelinizi en üst düzeye çıkaran nihai işlem aracı olan   Quantum TrendPulse'u   tanıtıyoruz. Hassasiyet ve verimlilik arayan yatırımcılar için tasarlanan bu gösterge, piyasa trendlerini, momentum değişimlerini ve en uygun giriş ve çıkış noktalarını güvenle belirlemenize yardımcı olur. Temel Özellikler: SuperTrend Entegrasyonu:   Güncel piyasa trendlerini kolayca takip edin ve karlılık dalgası
Öncelikle, bu Ticaret Aracının Non-Repainting, Non-Redrawing ve Non-Lagging Gösterge olduğunu vurgulamakta fayda var, bu da onu profesyonel ticaret için ideal hale getiriyor. Çevrimiçi kurs, kullanıcı kılavuzu ve demo. Akıllı Fiyat Hareketi Kavramları Göstergesi, hem yeni hem de deneyimli tüccarlar için çok güçlü bir araçtır. İleri ticaret fikirlerini, Inner Circle Trader Analizi ve Smart Money Concepts Ticaret Stratejileri gibi 20'den fazla kullanışlı göstergeyi bir araya getirerek bir araya
Top indicator for MT5   providing accurate signals to enter a trade without repainting! It can be applied to any financial assets:   forex, cryptocurrencies, metals, stocks, indices .  Watch  the video  (6:22) with an example of processing only one signal that paid off the indicator! MT4 version is here It will provide pretty accurate trading signals and tell you when it's best to open a trade and close it. Most traders improve their trading results during the first trading week with the help of
Ne kadar harika geriye dönük testler, canlı hesap performans kanıtları ve her yerde fantastik istatistikler sunan bir alım satım göstergesi aldınız, ancak onu kullandıktan sonra hesabınızı **patlatmakla mı sonuçlandınız?** Bir sinyale tek başına güvenmemelisiniz, öncelikle neden ortaya çıktığını bilmeniz gerekir ve RelicusRoad Pro bunu en iyi şekilde yapar! Kullanım Kılavuzu + Stratejiler + Eğitim Videoları + VIP Erişimli Özel Grup + Mobil Sürüm Mevcut Piyasaya Bakmanın Yeni Bir Yolu RelicusR
Quantum Trend Sniper
Bogdan Ion Puscasu
4.74 (53)
Tanıtım       Kuantum Trend Keskin Nişancı Göstergesi   , trend tersine dönmeleri belirleme ve ticaret yapma şeklinizi değiştiren çığır açan MQL5 Göstergesi! 13 yılı aşkın ticaret tecrübesine sahip deneyimli tüccarlardan oluşan bir ekip tarafından geliştirilmiştir.       Kuantum Trend Keskin Nişancı Göstergesi       trend dönüşlerini son derece yüksek doğrulukla belirlemenin yenilikçi yolu ile ticaret yolculuğunuzu yeni zirvelere taşımak için tasarlanmıştır. ***Kuantum Trend Keskin Nişancı Göst
ARIScalping
Temirlan Kdyrkhan
ARIScalp is a powerful trading companion designed to generate high-probability entry signals with dynamic TP/SL/DP levels based on volatility. Built-in performance tracking shows win/loss stats, PP1/PP2 hits, and success rates all updated live. Key Features: Buy/Sell signals with adaptive volatility bands Real-time TP/SL/DP levels based on ATR Built-in MA Filter with optional ATR/StdDev volatility Performance stats panel (Success, Profit/Loss, PP1/PP2) Alerts via popup, sound, push, or email Cus
AriX
Temirlan Kdyrkhan
1 (4)
AriX Indicator for MT5 A powerful trend-following and signal-evaluation tool AriX is a custom MT5 indicator that combines Moving Averages and ATR-based risk/reward logic to generate clear buy/sell signals. It visualizes dynamic SL/TP levels, evaluates past trade outcomes, and displays win/loss statistics in a clean on-chart panel. Key features include: Buy/Sell signals based on MA crossovers ATR-based SL/TP1/TP2/TP3 levels with visual lines and labels Signal outcome tracking with real-time stat
Step into the world of Forex trading with confidence, clarity, and precision using Gold Indicator a next-generation tool engineered to take your trading performance to the next level. Whether you’re a seasoned professional or just beginning your journey in the currency markets, Gold Indicator equips you with powerful insights and help you trade smarter, not harder. Built on the proven synergy of three advanced indicators, Gold Indicator focuses exclusively on medium and long-term trends elimina
ARICoins
Temirlan Kdyrkhan
ARICoin is a powerful trading companion designed to generate high-probability entry signals with dynamic TP/SL/DP levels based on volatility. Built-in performance tracking shows win/loss stats, PP1/PP2 hits, and success rates all updated live. Key Features: Buy/Sell signals with adaptive volatility bands Real-time TP/SL/DP levels based on ATR Built-in MA Filter with optional ATR/StdDev volatility Performance stats panel (Success, Profit/Loss, PP1/PP2) Alerts via popup, sound, push, or email Cust
Tanıtım       Quantum Breakout PRO   , Breakout Bölgeleri ile ticaret yapma şeklinizi değiştiren çığır açan MQL5 Göstergesi! 13 yılı aşkın ticaret tecrübesine sahip deneyimli tüccarlardan oluşan bir ekip tarafından geliştirilmiştir.       Kuantum Breakout PRO       yenilikçi ve dinamik koparma bölgesi stratejisiyle ticaret yolculuğunuzu yeni zirvelere taşımak için tasarlanmıştır. Kuantum Breakout Göstergesi, size 5 kar hedefi bölgesi ile kırılma bölgelerinde sinyal okları ve kırılma kutusuna da
MTF Supply Demand Zones MT5
Georgios Kalomoiropoulos
5 (1)
Yeni Nesil Otomatik Arz ve Talep Bölgeleri. Her Grafikte Çalışan Yeni ve Yenilikçi Algoritma. Tüm Bölgeler Piyasanın Fiyat Hareketine Göre Dinamik Olarak Oluşturulmaktadır. İKİ TÜR UYARI --> 1) FİYAT BİR BÖLGEYE ÇIKTIĞINDA 2) YENİ BİR BÖLGE OLUŞTURDUĞUNDA Bir tane daha işe yaramaz gösterge almazsın. Kanıtlanmış Sonuçlarla eksiksiz bir Ticaret Stratejisi elde edersiniz.     Yeni özellikler:     Fiyat Arz/Talep Bölgesine ulaştığında uyarılar     Yeni bir Arz/Talep Bölgesi oluşturulduğunda
Berma Bands
Muhammad Elbermawi
5 (7)
Berma Bantları (BB'ler) göstergesi, piyasa trendlerini belirlemeyi ve bunlardan yararlanmayı amaçlayan yatırımcılar için değerli bir araçtır. Fiyat ile BB'ler arasındaki ilişkiyi analiz ederek, yatırımcılar bir piyasanın trend veya aralıklı fazda olup olmadığını ayırt edebilir. Daha fazla bilgi edinmek için [ Berma Home Blog ] adresini ziyaret edin. Berma Bantları üç belirgin çizgiden oluşur: Üst Berma Bandı, Orta Berma Bandı ve Alt Berma Bandı. Bu çizgiler fiyatın etrafına çizilir ve genel tren
AÇIKLAMA ICSM (Impulse-Correction SCOB Mapper), fiyat hareketini analiz eden ve geçerli impulsları, düzeltmeleri ve SCOB'ları (Single Candle Order Block) tanımlayan göstergedir. Esnek, bilgilendirici, kullanımı kolay olması ve tüccarın en likit ilgi alanlarına yönelik farkındalığını önemli ölçüde artırması nedeniyle her türlü teknik analizle kullanılabilen güçlü bir araçtır. AYARLAR Genel | Görsel Renk teması — ICSM'nin renk temasını tanımlar. SCOB | Görsel SCOB'u göster — SCOB'u etkinleş
The Volume Spread Analysis indicator is based on the original Volume Spread Analysis method. It was designed for quick and easy recognition of VSA patterns. Even though this indicator looks very simple, it is the most sophisticated tool we've ever made. It is a really powerful analytical tool that generates very reliable trading signals. Because it is very user-friendly and understandable, it is suitable for every type of trader, regardless of his experience. What is VSA? VSA - Volume Spread A
MetaForecast M5
Vahidreza Heidar Gholami
5 (3)
MetaForecast, fiyat verilerindeki harmonileri kullanarak herhangi bir piyasanın geleceğini tahmin eder ve görselleştirir. Piyasa her zaman tahmin edilemezken, fiyatlarda bir desen varsa, MetaForecast geleceği mümkün olduğunca doğru bir şekilde tahmin edebilir. Benzer ürünlere göre, MetaForecast piyasa eğilimlerini analiz ederek daha kesin sonuçlar üretebilir. Giriş Parametreleri Past size (Geçmiş boyut) MetaForecast'ın gelecekteki tahminler oluşturmak için kullandığı çubuk sayısını belirtir. Mo
Super Signal – Skyblade Edition Profesyonel No-Repaint / Gecikmesiz Trend Sinyal Sistemi, Olağanüstü Kazanma Oranı ile | MT4 / MT5 için Temel Özellikler: Super Signal – Skyblade Edition, özellikle trend bazlı işlemler için geliştirilmiş akıllı bir sinyal sistemidir. Yalnızca güçlü, yönlü ve gerçek momentum destekli piyasa hareketlerini tespit etmek amacıyla çok katmanlı bir filtreleme yapısı kullanır. Bu sistem zirve veya dip noktaları tahmin etmeye çalışmaz. Aşağıdaki üç koşul aynı anda kar
Presenting one-of-a-kind Gann Indicator for XAUUSD IQ Gold Gann Levels is a non-repainting, precision tool designed exclusively for XAUUSD/Gold intraday trading. It uses W.D. Gann’s square root method to plot real-time support and resistance levels, helping traders spot high-probability entries with confidence and clarity. William Delbert Gann (W.D. Gann) was an exceptional market analyst whose trading technique was based on a complex blend of mathematics, geometry, astrology, and ancient calcul
IQ FX Gann Levels a precision trading indicator based on W.D. Gann’s square root methods. It plots real-time, non-repainting support and resistance levels to help traders confidently spot intraday and scalping opportunities with high accuracy. William Delbert Gann (W.D. Gann) was an exceptional market analyst, whose trading technique was based on a complex blend of mathematics, geometry, astrology, and ancient mathematics which proved to be extremely accurate. Download the   Metatrader 4 Version
Technical Ratings for MT5 A multi-indicator analysis dashboard that displays aggregated technical signals directly on your MetaTrader 5 charts. This indicator calculates buy, sell, and neutral signals from 11 oscillators, 15 moving averages, and classic pivot points, presenting them in a single organized panel. What It Does Technical Ratings analyzes multiple technical indicators simultaneously and presents their consensus as clear trading signals. Instead of opening dozens of indicator windows
Backtesting Simulator MT5
Diego Arribas Lopez
4 (1)
[ MT4 Version ] Are you tired of spending months on demo or live accounts to test your trading strategies? The Backtesting Simulator is the ultimate tool designed to elevate your backtesting experience to new heights. Utilizing Metatrader historical symbol information, it offers an unparalleled simulation of real market conditions. Take control of your testing speed, test ideas quickly or at a slower pace, and witness remarkable improvements in your testing performance. Forget about wasting tim
TrendMaestro5
Stefano Frisetti
note: this indicator is for METATRADER4, if you want the version for METATRADER5 this is the link:  https://www.mql5.com/it/market/product/108106 TRENDMAESTRO ver 2.5 TRENDMAESTRO recognizes a new TREND from the start, he never makes mistakes. The certainty of identifying a new TREND is priceless. DESCRIPTION TRENDMAESTRO identifies a new TREND in the bud, this indicator examines the volatility, volumes and momentum to identify the moment in which there is an explosion of one or more of these da
Algo Pumping
Ihor Otkydach
4.74 (19)
PUMPING STATION – Kişisel “her şey dahil” stratejiniz Karşınızda PUMPING STATION — forex dünyasında işlem yapma şeklinizi heyecan verici ve etkili bir sürece dönüştürecek devrim niteliğinde bir gösterge. Bu sadece bir yardımcı değil, güçlü algoritmalarla donatılmış tam teşekküllü bir ticaret sistemidir ve daha istikrarlı işlem yapmanıza yardımcı olur. Bu ürünü satın aldığınızda ŞUNLARI ÜCRETSİZ olarak alırsınız: Özel ayar dosyaları: Otomatik kurulum ve maksimum performans için. Adım adım video e
Kârlı ticaret fırsatlarını kolaylıkla belirlemenize yardımcı olabilecek güçlü bir forex ticaret göstergesi mi arıyorsunuz? Beast Super Signal'den başka bir yere bakmayın. Bu kullanımı kolay trend tabanlı gösterge, sürekli olarak piyasa koşullarını izleyerek yeni gelişen trendleri araştırır veya mevcut trendlere atlar. Canavar Süper Sinyali, tüm dahili stratejiler birbiriyle uyumlu ve %100 örtüştüğünde bir al ya da sat sinyali vererek ek onay ihtiyacını ortadan kaldırır. Sinyal oku uyarısını aldı
Volume at Price (VAP) VAP is a right-anchored Volume Profile Heatmap for MetaTrader 5 designed for clean, fast, and stable execution on any chart. It shows where trading activity clustered, not just when—so you can read balance/imbalance, spot value migration, and plan trades with precise references: VAH, VAL, and POC . What VAP shows Heatmap Profile (tick-volume): A compact, right-anchored histogram that scales with the chart. Value Area (~70%) in Gold Non-Value in White Soft shadow gradient
First time on MetaTrader, introducing IQ Star Lines - an original Vedic Astrology based indicator. IQ Star Lines, an unique astrological indicator purely based on Vedic astrology calculations, published for the first time on Metatrader. This unique tool plots dynamic planetary grid lines based on real-time stars, constellations, and celestial movements, which allows you to plot the power of the cosmos directly onto your trading charts. This indicator is specifically designed for scalpers and int
" Dynamic Scalper System MT5 " göstergesi, trend dalgaları içinde işlem yapmak için scalping yöntemi için tasarlanmıştır. Başlıca döviz çiftleri ve altın üzerinde test edilmiştir, diğer işlem araçlarıyla uyumluluğu mümkündür. Ek fiyat hareketi desteğiyle trend boyunca pozisyonların kısa vadeli açılması için sinyaller sağlar. Göstergenin prensibi. Büyük oklar trend yönünü belirler. Küçük oklar şeklinde scalping için sinyaller üreten bir algoritma trend dalgaları içinde çalışır. Kırmızı oklar yü
##   ONLY GOLD ##   Тiльки Золото ## **Mercaria Professional Trading Zones - Complete Guide** ## **Mercaria Professional Trading Zones - Повний посібник** ### **How Mercaria Zones Work / Як працюють зони Mercaria** **English:** Mercaria Zones is an advanced trading indicator that identifies high-probability support and resistance areas using ZigZag extremes combined with mathematical zone calculations. The indicator works on multiple timeframes simultaneously, providing a comprehensive view
Yazarın diğer ürünleri
ACB Breakout Arrows
KEENBASE SOFTWARE SOLUTIONS
4.15 (34)
ACB Breakout Arrows göstergesi, özel bir kırılma modelini tespit ederek piyasada kritik bir giriş sinyali sağlar. Gösterge, belirli bir yönde güçlenen momentumu sürekli tarar ve büyük bir hareket başlamadan hemen önce doğru giriş sinyalini verir.  Çoklu sembol ve çoklu zaman dilimi tarayıcıyı buradan edinin - ACB Breakout Arrows MT4 için Tarayıcı Temel Özellikler Gösterge, Stop Loss ve Take Profit seviyelerini otomatik olarak sağlar. Tüm zaman dilimlerinde kırılma sinyallerini takip eden MTF Ta
KT Momentum Arrows MT5
KEENBASE SOFTWARE SOLUTIONS
5 (2)
KT Momentum Arrows göstergesi, belirli bir yönde meydana gelen bant sapması ve ortaya çıkan volatiliteye dayalı olarak hesaplanan ani kırılmalara dayanır. Fiyat üst banda kapanış yaparsa alış sinyali, alt banda kapanış yaparsa satış sinyali üretilir. Tek bir katsayı (Magnitude Coefficient), bant sapması ve volatilite hesaplamasını aynı anda etkiler. Bu değer, kullanılan enstrümana ve zaman dilimine göre dikkatlice seçilmelidir. Temel Özellikler Repaint yok! Momentum odaklı işlem yapanlar için
KT Stoch Divergence MT5
KEENBASE SOFTWARE SOLUTIONS
Diverjans, piyasadaki olası fiyat dönüşlerini gösteren en önemli sinyallerden biridir. KT Stoch Divergence, fiyat ile stokastik osilatör arasındaki normal ve gizli uyumsuzlukları gösterir. KT Stoch Divergence’ın Sınırlamaları Sadece stokastik diverjansı giriş sinyali olarak kullanmak riskli olabilir. Her diverjans güçlü bir dönüş anlamına gelmeyebilir. Daha iyi sonuçlar için fiyat hareketi ve trend yönü ile birlikte kullanılmalıdır. Özellikler Fiyat ile stokastik osilatör arasındaki normal ve
KT Asian Breakout Indicator
KEENBASE SOFTWARE SOLUTIONS
KT Asian Breakout göstergesi, Asya seansının kritik bir bölümünü analiz ederek fiyatın kırılma yönüne göre çift yönlü alım ve satım sinyalleri üretir. Fiyat seansın en yüksek seviyesini kırarsa alım sinyali oluşur, en düşük seviyesini kırarsa satış sinyali oluşur. Dikkat Edilmesi Gerekenler Eğer seans kutusu dikey olarak çok genişse, yeni bir işlemden kaçınılmalıdır çünkü fiyat hareketlerinin büyük bir kısmı zaten bu kutu içinde gerçekleşmiştir. Eğer kırılma mumu çok büyükse, fiyat genellikle s
KT Momentum Arrows
KEENBASE SOFTWARE SOLUTIONS
KT Momentum Arrows göstergesi, belirli bir yönde meydana gelen bant sapması ve ortaya çıkan volatiliteye dayalı olarak hesaplanan ani kırılmalara dayanır. Fiyat üst banda kapanış yaparsa alış sinyali, alt banda kapanış yaparsa satış sinyali üretilir. Tek bir katsayı (Magnitude Coefficient), bant sapması ve volatilite hesaplamasını aynı anda etkiler. Bu değer, kullanılan enstrümana ve zaman dilimine göre dikkatlice seçilmelidir. Temel Özellikler Repaint yok! Momentum odaklı işlem yapanlar için
ACB Trade Filter MT4
KEENBASE SOFTWARE SOLUTIONS
5 (1)
The ACB Trade Filter indicator provides a solution for filtering out the low probability trading setups in a trading strategy. The indicator uses a sophisticated filtration algorithm based on the market sentiment and trend. Applications Works great with our indicator " ACB Breakout Arrows ". Filter out low probability signals from any indicator. Avoid overtrading and minimize the losses. Trade in the direction of market sentiment and trend. Avoid the choppiness in the market. How to use Only L
KT Heiken Ashi Smoothed MT4
KEENBASE SOFTWARE SOLUTIONS
KT Heiken Ashi Smoothed, standart Heiken Ashi’nin yumuşatılmış sürümüdür; ayrıca trend değişiminde al/sat okları çizer. Durum ayıdan boğaya döndüğünde alım oku çizilir. Durum boğadan ayıya döndüğünde satım oku çizilir. Mobil bildirim, e-posta, ses ve pop-up uyarıları dahildir. Heiken Ashi Smoothed tam olarak nedir? Standart Heiken Ashi’deki yalancı sinyalleri ve gürültüyü iki hareketli ortalama ile filtreleyerek fiyatı yumuşatır. Bir miktar gecikme olsa da, salınım noktalarını ve yeni oluşan t
KT Psar Arrows MT5
KEENBASE SOFTWARE SOLUTIONS
5 (1)
KT Psar Arrows, standart Parabolic SAR göstergesini kullanarak grafikte oklar çizer. Mumun en yüksek noktası SAR'a temas ettiğinde yükseliş oku çizilir. Mumun en düşük noktası SAR'a temas ettiğinde düşüş oku çizilir. Sinyaller, mum kapanışını beklemeden gerçek zamanlı olarak üretilir.  Özellikler Parabolic SAR göstergesini kullanan ticaret stratejilerini denemek isteyen yatırımcılar için faydalı bir araçtır.  Piyasadaki dönüş noktalarını bulmak için kullanılabilir. Özel PSAR girişlerini destekl
MACD Divergence on MT5
KEENBASE SOFTWARE SOLUTIONS
KT MACD Divergence, fiyat ile osilatör arasında oluşan düzenli ve gizli uyumsuzlukları gösterir. Eğer ticaret stratejinizde trend dönüşü bekleniyorsa, potansiyel dönüş noktalarını belirlemek için MACD’nin düzenli uyumsuzluğunu kullanabilirsiniz. Trendin devamına dayalı stratejilerde ise MACD’nin gizli uyumsuzluğu daha uygun bir tercih olacaktır. KT MACD Divergence'nın Sınırlamaları MACD uyumsuzluğunu tek başına giriş sinyali olarak kullanmak riskli olabilir. Her uyumsuzluk mutlaka bir trend dö
KT Trend Magic
KEENBASE SOFTWARE SOLUTIONS
KT Trend Magic shows the trend depiction on chart using the combination of market momentum and volatility. A smoothing coefficient is used to smooth out the noise from the signal.It can be used to find out the new entries or confirm the trades produced by other EA/Indicators. Usage Drag n drop MTF scanner which scans for the new signals across multiple time-frames. Find new entries in the trend direction. Improve the accuracy of other indicators when used in conjunction. Can be used as a dynami
KT COG Advanced MT4
KEENBASE SOFTWARE SOLUTIONS
1 (1)
KT COG is an advanced implementation of the center of gravity indicator presented by John F. Ehlers in the May 2002 edition of Technical Analysis of Stocks & Commodities magazine. It's a leading indicator which can be used to identify the potential reversal points with the minimum lag. The COG oscillator catches the price swings quite effectively. MT5 version of the same indicator is available here KT COG Advanced MT5 Calculation of COG The COG indicator is consist of the two lines. The main l
KT Pin Bar
KEENBASE SOFTWARE SOLUTIONS
KT Pin Bar identifies the pin bar formation which is a type of price action pattern which depicts a sign of reversal or rejection of the trend. When combined with support and resistance, BRN and other significant levels, Pin Bar pattern proved to be a very strong sign of reversal. Basically, a pin bar is characterized by a small body relative to the bar length which is closed either in upper or lower 50% part of its length. They have very large wicks and small candle body. A pin bar candlestic
KT Auto Fibo
KEENBASE SOFTWARE SOLUTIONS
KT Auto Fibo, mevcut trend yönüne göre Fibonacci düzeltme seviyelerini otomatik olarak çizer. En yüksek ve en düşük noktalar, grafikteki mevcut maksimum ve minimum değerler kullanılarak otomatik olarak seçilir. Fibonacci seviyelerini buna göre ayarlamak için grafiği yakınlaştırabilir, uzaklaştırabilir ve kaydırabilirsiniz. Modlar Otomatik:  Grafik alanına göre Fibonacci seviyelerini otomatik olarak çizer. Manuel: Fibonacci seviyelerini yalnızca bir kez çizer. Daha sonra, bağlantı noktalarını ma
KT Psar Arrows
KEENBASE SOFTWARE SOLUTIONS
KT Psar Arrows, standart Parabolic SAR göstergesini kullanarak grafikte oklar çizer. Mumun en yüksek noktası SAR'a temas ettiğinde yükseliş oku çizilir. Mumun en düşük noktası SAR'a temas ettiğinde düşüş oku çizilir. Sinyaller, mum kapanışını beklemeden gerçek zamanlı olarak üretilir.  Özellikler Parabolic SAR göstergesini kullanan ticaret stratejilerini denemek isteyen yatırımcılar için faydalı bir araçtır.  Piyasadaki dönüş noktalarını bulmak için kullanılabilir. Özel PSAR girişlerini destekl
KT Ichimoku Trader
KEENBASE SOFTWARE SOLUTIONS
1 (1)
KT Ichimoku Trader is a fully automated expert advisor that offers five popular trading strategies based on the Ichimoku indicator. Each strategy has it's own entry and exit method without any interference to other strategies. The Ichimoku system can be applied to all major currency pairs and metals. However, we found that it performs reasonably well mainly on two pairs.   MT5 Version is available here  https://www.mql5.com/en/market/product/35043 Features Trade up to 5 famous trading strategi
KT Volatility Oscillator
KEENBASE SOFTWARE SOLUTIONS
KT Volatilite Osilatörü, geçmiş ve mevcut piyasa verilerini matematiksel bir formül kullanarak analiz eder ve sonucu bir osilatör formunda gösterir. Yükselen ve azalan dalgalar, varlığın yüksek ve düşük volatilitesine karşılık gelir.  Kısaca, volatilite bir varlığın belirli bir zaman diliminde fiyat dalgalanmalarının ölçüsüdür. Volatilite olmasaydı, piyasada çok az hareket olurdu ve traderlar fiyat değişimlerinden kazanç sağlayamazdı. Forex Piyasasında Volatilite Kullanımı Forex piyasasında vol
KT COG Robot
KEENBASE SOFTWARE SOLUTIONS
KT COG Robot is a fully automated Expert Advisor based on the KT COG Indicator . The COG indicator was originally presented by John F. Ehlers in the May 2002 edition of Technical Analysis of Stocks & Commodities magazine. The EA fires a long trade when COG line cross above the signal line and a short trade is fired when the COG line cross below the signal line.  Adaptive Filtration Our adaptive filtration algorithm combines the original COG formula with the major trend direction and market acce
ACB Breakout Arrows EA
KEENBASE SOFTWARE SOLUTIONS
Bu, özel olarak geliştirdiğimiz "ACB Breakout Arrows" adlı göstergemize dayalı %100 otomatik bir uzman danışmandır. Girişler, iki yönlü olarak sık sık oluşan bir kırılma modeline dayanır. Giriş sinyallerinin şiddeti, "Signal Sensitivity" adlı harici girişle ayarlanabilir. İşlem Onayı ACB Breakout Arrows EA, başka bir özel göstergemiz olan ACB Trade Filter kullanılarak girişleri filtreleme yeteneği sunar. Güçlü Al: Yukarı ok + Yeşil histogram + Yükseliş trendi Güçlü Sat: Aşağı ok + Kırmızı hist
KT Asian Breakout
KEENBASE SOFTWARE SOLUTIONS
4 (1)
KT Asian Breakout carefully analyzes the range-bound market during the Asian session and then fires a long or short trade after doing some preassessment based on its inbuilt technical analysis module. The executed orders are closed within a day before the completion of the next day session. The inbuilt technical analysis module checks for the session range and compares it with the last 20 days price movement. If it finds any erratic price movement within the session, the orders are not executed
KT London Breakout
KEENBASE SOFTWARE SOLUTIONS
First thirty minutes are essential for a trading session. The early reaction of traders and market players sets a path for the rest of the day. KT London Breakout EA takes advantage of this phenomenon, and after analyzing the first thirty minutes of London session, it places two bidirectional pending orders. One of pending order is eventually canceled after realizing the market direction with certainty. It has been strictly tested and developed for EUR/JPY using 30-Min Time Frame. You can expe
Use of support and resistance in systematic trading is very subjective. Every trader has their own idea and way to plotting the support and resistance levels on the chart. KT Support and Resistance indicator take out this ambiguity out of the situation and automatically draws support and resistance levels following an algorithmic approach using a unique multi-timeframe analysis. When launched on the chart, It immediately scan the most significant extreme points across all the available timefra
Eğer Forex piyasasında işlem yapıyorsanız, döviz gücü ve döviz çiftleri arasındaki korelasyon hakkında ayrıntılı bilgi sahibi olmak, işlem performansınızı yeni bir seviyeye taşıyabilir. Korelasyon, riskinizi yarıya indirmenize yardımcı olurken, güç analizi kârınızı maksimize etmenizi sağlar. Bu gösterge, döviz gücü analizi ile döviz çiftleri korelasyonunu birleştirerek en uygun döviz çiftlerini seçmek için hibrit bir yaklaşım sunar. Döviz Gücü Analizi Nasıl Kullanılır Örneğin, işlem stratejiniz
MACD Divergence Seeker
KEENBASE SOFTWARE SOLUTIONS
KT MACD Divergence Seeker trades the regular and hidden divergence signals generated by our free indicator named KT MACD Divergence indicator. Trading the standalone divergences can be a risky affair that's why the KT MACD Divergence Seeker combines the standard divergence signals with an advanced analysis module to exploit the price inefficiencies on some FX pairs. What is the Divergence exactly? As a general conception if the price is making higher highs, then macd should also be making hig
MACD Divergence MT4
KEENBASE SOFTWARE SOLUTIONS
KT MACD Divergence, fiyat ile osilatör arasında oluşan düzenli ve gizli uyumsuzlukları gösterir. Eğer ticaret stratejinizde trend dönüşü bekleniyorsa, potansiyel dönüş noktalarını belirlemek için MACD’nin düzenli uyumsuzluğunu kullanabilirsiniz. Trendin devamına dayalı stratejilerde ise MACD’nin gizli uyumsuzluğu daha uygun bir tercih olacaktır. KT MACD Divergence'nın Sınırlamaları MACD uyumsuzluğunu tek başına giriş sinyali olarak kullanmak riskli olabilir. Her uyumsuzluk mutlaka bir trend dö
KT Bollinger Bands Trader, düşük volatilite dönemlerinde Bollinger Bantlarını kullanarak ortalamaya dönüş stratejisi uygulayan %100 otomatik bir uzman danışmandır (Expert Advisor). Fiyat genellikle Bollinger Bantlarının üst veya alt çizgisine tepki verir, ancak her zaman bir dönüş gerçekleşmez. Bununla birlikte, düşük volatilite dönemlerinde fiyat dönüşü olasılığı daha yüksektir. Girişler Fiyat Bollinger Bantlarının alt çizgisinin altına doğru şekilde hizalandığında alış işlemi başlatılır. Fiya
KT CCI Divergence MT4
KEENBASE SOFTWARE SOLUTIONS
KT CCI Divergence shows the regular and hidden divergence created between the price and CCI oscillator. Divergence is one of the vital signals that depicts the upcoming price reversal in the market. Manually spotting the divergence between price and CCI can be a hectic and ambiguous task. Limitations of KT CCI Divergence   Using the CCI divergence as a standalone entry signal can be risky. Every divergence can't be interpreted as a strong reversal signal. For better results, try to combine it w
KT MA Crossover MT4
KEENBASE SOFTWARE SOLUTIONS
KT MA Crossover, seçilen hareketli ortalamaların kesişimine göre alım ve satım oklarını çizer. Ayrıca her ardışık sinyal için uygun uyarıları üretir ve MFE (En Avantajlı Sapma) değerini görüntüler. Hareketli ortalama kesişimi, dünya çapında trader'lar tarafından yaygın olarak kullanılan temel stratejilerden biridir. Genellikle biri hızlı, diğeri yavaş olmak üzere iki hareketli ortalamadan oluşur ve kesişim yönüne göre alım ya da satım sinyali üretir. Alım sinyali – hızlı MA, yavaş MA'nın üzerin
KT Round Numbers MT4
KEENBASE SOFTWARE SOLUTIONS
KT Round Numbers plots the round number levels which are also commonly known as psychological levels in the Forex world. In the context of Forex trading, round number levels are those levels in which there are two or more zeroes at the end. They are named as 00 levels on the chart. Some traders also consider the halfway points as a valid round number level. They are named as 50 levels on the chart. Use of round number levels in trading Round number levels work as strong support and resistance
KT Inside Bar Advanced MT4
KEENBASE SOFTWARE SOLUTIONS
Despite the popularity of inside bar pattern among the traders, using it as a standalone signal doesn't provide any edge in the market. KT Inside Bar Advanced indicator solves this problem by combining the classic inside bar pattern with the "ECE" cycle and Fibonacci extensions. Using this indicator in place of our classic inside bar indicator will provide a tremendous advantage and edge in the market. What is the ECE cycle? In financial markets, the price never moves in a straight line but u
Despite the popularity of inside bar pattern among traders, using it as a standalone entry signal doesn't provide any evidentiary advantage. KT Inside Bar Hunter trades only selected inside bar patterns using some preassessment and ECE price action cycle. Trading Strategy On successful detection of the required pattern, EA places a pending order in the direction of the forecasted price expansion phase. Pending orders are canceled if they are not triggered within the next bar. Once triggered, ac
Filtrele:
MarketWatch27378757
152
MarketWatch27378757 2022.01.05 19:20 
 

...

İncelemeye yanıt