KT Heiken Ashi Smoothed MT4
- Göstergeler
- Sürüm: 1.5
- Güncellendi: 10 Mayıs 2022
- Etkinleştirmeler: 10

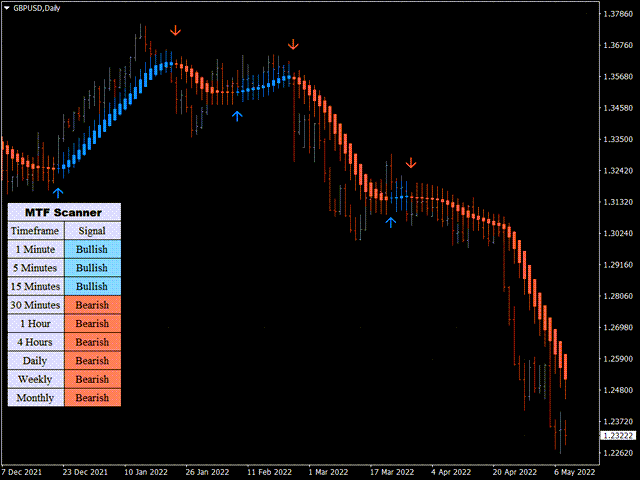
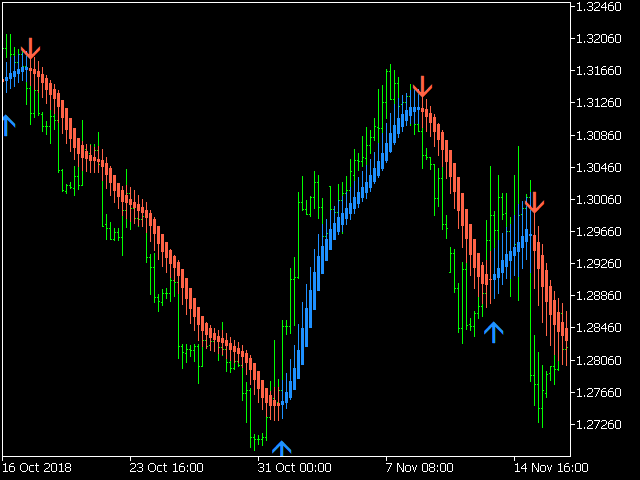
KT Heiken Ashi Smoothed, standart Heiken Ashi’nin yumuşatılmış sürümüdür; ayrıca trend değişiminde al/sat okları çizer.
- Durum ayıdan boğaya döndüğünde alım oku çizilir.
- Durum boğadan ayıya döndüğünde satım oku çizilir.
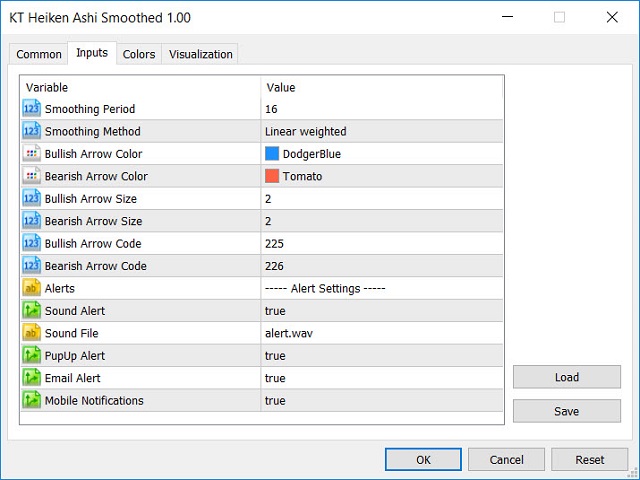
- Mobil bildirim, e-posta, ses ve pop-up uyarıları dahildir.
Heiken Ashi Smoothed tam olarak nedir?
Standart Heiken Ashi’deki yalancı sinyalleri ve gürültüyü iki hareketli ortalama ile filtreleyerek fiyatı yumuşatır. Bir miktar gecikme olsa da, salınım noktalarını ve yeni oluşan trendleri ortaya çıkarır, normalde gözden kaçan fiyat dinamiklerini görünür kılar. Bu bilgilerle trader stratejilerini ayarlayabilir.
Uygulamalar
Göstergesi Forex, emtia ve hisse senedi gibi birçok piyasada kullanılabilir. Aşağıda işlem fırsatı bulmak için beş temel kullanım alanı verilmiştir.
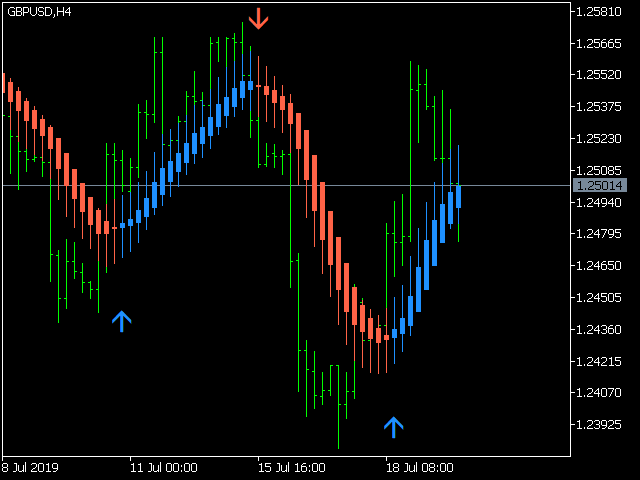
- Alt fitili olmayan mavi mum, güçlü bir yükseliş trendini gösterir.
- Üst fitili olmayan kırmızı mum, güçlü bir düşüş trendini gösterir.
- Küçük gövdeli ve uzun fitilli mumlar genellikle trend dönüşünü işaret eder.


Kullanıcı değerlendirmeye herhangi bir yorum bırakmadı