MR Range Breakouts 4

5
" A trading range occurs when a financial instrument trades between constant high and low prices over a period of time. The upper part of the trading range of a financial instrument often provides price resistance, while the lower part of the trading range usually offers price support.  Traders can enter in the direction of a breakout or breakdown from a trading range... "

This is the "Classical Theory" understanding of ranges. We have a different understanding of the nature of ranges and the processes that occur within them. Therefore, we at "Masters of Risk" created our indicator to cover all our requirements. "MR Range Breakouts" indicator was created from scratch by us according to the author's methodology. It is based on the concept of "Auction Market Theory" developed by J. Peter Steidlmayer and "Locked-in Range" market analysis method developed by Tom Leksey. Both concepts largely overlap with our understanding of the processes in the "Range" and show how market participants interact. Since there is no established terminology for ranges in the "Classical Theory" we will use our own terminology!!!

To give you some idea, we will briefly introduce the processes that take place in the range:
1. When we have two extremes and the price has tested at least 75% of the distance between them in the form of a corrective movement, we say that a “Balance” has been established between buyers and sellers. Usually, the intentions to achieve a "Balance" of prices are known only by the "Big" players in the markets. If the price continues or makes a new impulse, renews one of the extremes and does not return to them again in the form of a correction, we say that the "Balance" is broken and we now have an "Imbalance".
2. If, after reaching a "Balance" between buyers and sellers, the price continues to move between two price extremes, we say that a "Range" has developed between the two price extremes. Here, along with the "Big" market players, the "Professional" traders also enter positions.
3. When the prices remain in the "Range" for a longer time, this "Range" is also seen (perceived) by the "Non-professional" market participants. Usually their stop-losses are placed above or below the boundaries of the "Range". This is where we say we have an "Open Range" because all market participants can actively enter positions and trade the distance between the two extremes that define the upper and lower boundaries of the "Range."
4. When enough participants accumulate in the "Range" with their stop-losses, some of the "Big" players try to close the "Range" of the prices by exiting it at the expense of these stop-losses. If they succeed and then there is a "correction" beyond the "Range", we say that the "Open Range" is locked by these "Big" players and we have a "Range of Buyers" or a "Range of Sellers".
5. If another portion of the "Big" players decide they don't like it and return the price to the "Range" and test a minimum of 75% of the distance between the two extremes that define the boundaries of the "Range", then we say we have an "Extending" of the boundaries of the "Open Range". In this case, the distance between the upper and lower boundaries of the "Open Range" is updated and a new range test distance of 75% is determined.
6. If these “Big” players fail to return the price to at least 75% after exiting the range, then we say that there is a struggle for dominance of different groups of "Big" players. This usually happens at the upper or lower boundaries of the "Open Range" and between the "Limit Orders Barriers". Then we say that we have an "Expansion" of sellers or an "Expansion" of buyers.
7. According to our experience with the indicator, the best places to enter a position are in the "Limit Order Barriers" area in the direction of the trend. For example, if we have a downtrend, we are looking for a sell entry in the "Limit Orders Barriers" area of sellers, and accordingly, if we have an uptrend, we are looking for a buy entry in the "Limit Orders Barriers" area of buyers. Of course, all our decisions must be confirmed by other indicators in these zones.

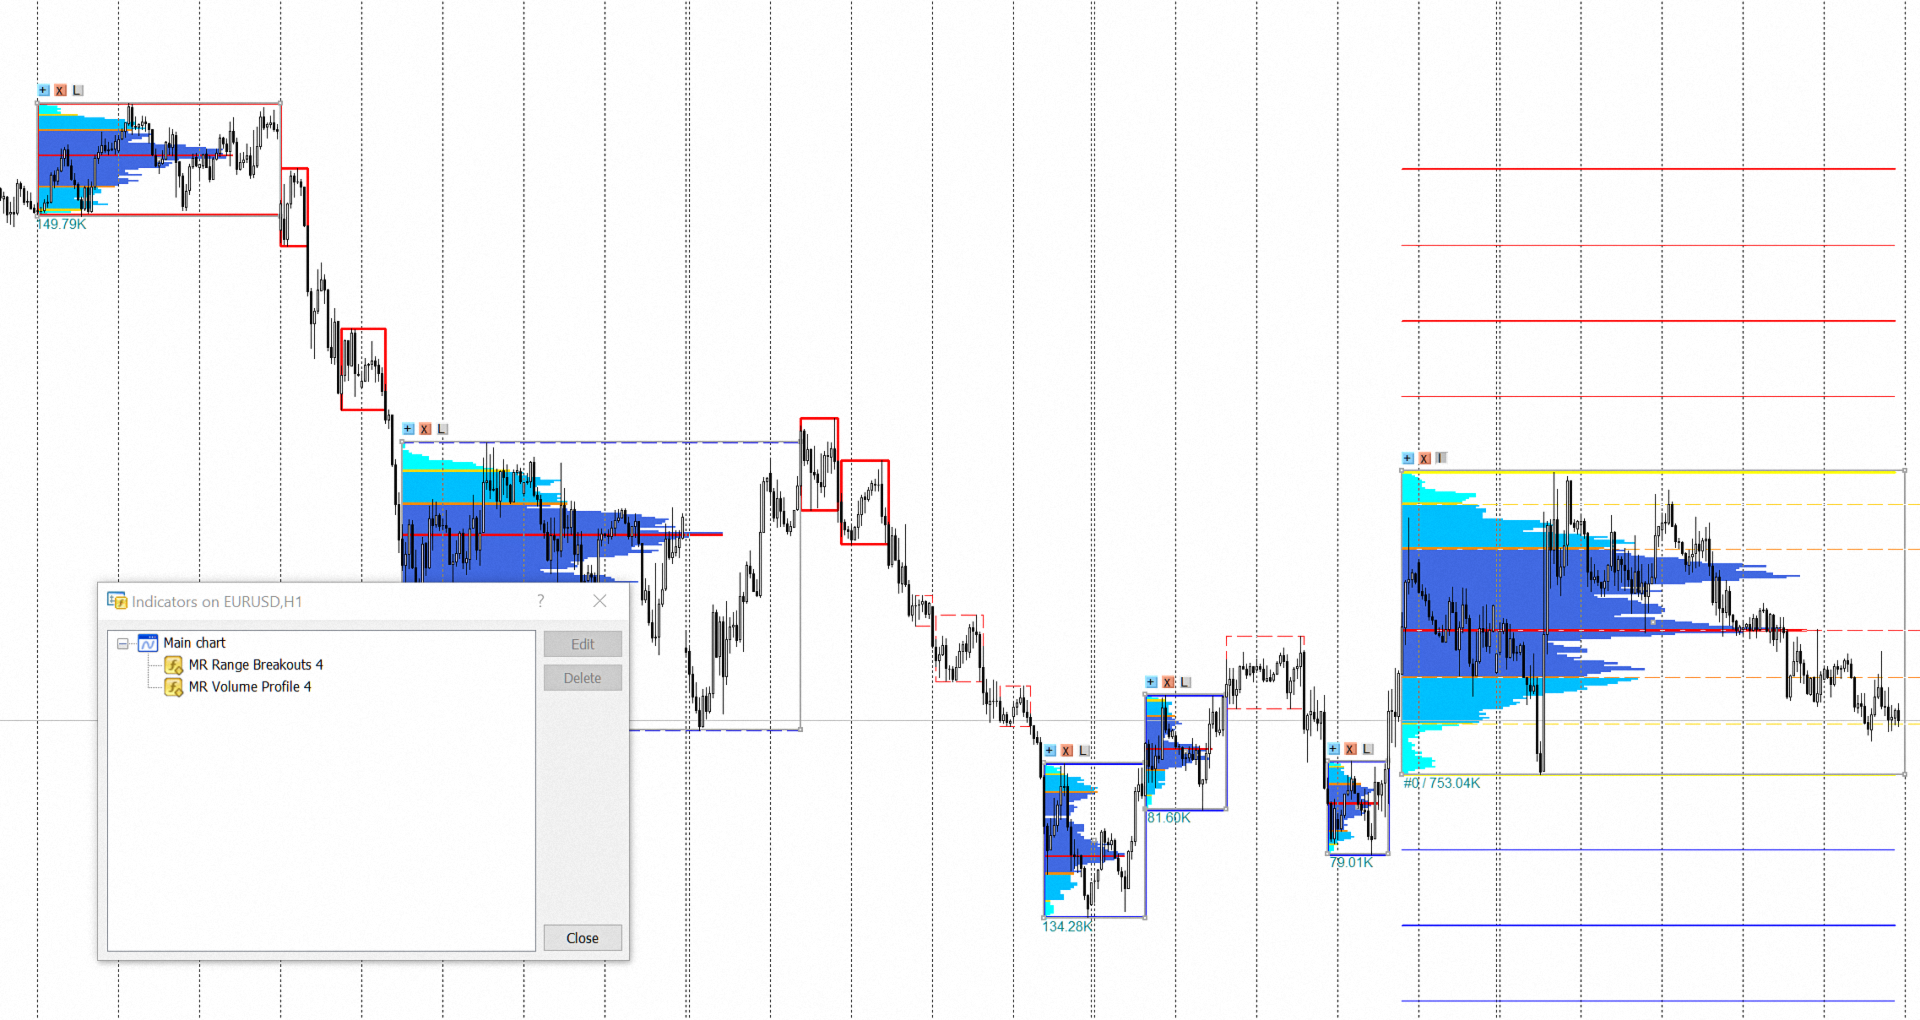
What the indicator shows:
  • "Red" rectangles show "Ranges of Sellers", where buyers remain in "Locked-in Range", and sellers win. If you place a volume profile in "Range of Sellers", in the area below the "POC" volume there are buyers locked in range".
  • "Blue" rectangles show "Ranges of Buyers", where sellers remain in "Locked-in Range", and buyers win. If you place a volume profile in "Range of Buyers", in the area above the "POC" volume there are sellers locked in range".
  • "Dashed" rectangles show closed "Ranges" - the places where the price absorbed the volumes in the Ranges.
  • "Yellow" lines show the upper and lower boundaries of the "Open Range" - it is not yet determined whether this will be a range of buyers or sellers. "Open Range" is a new and not yet finished range. In it, positions are recruited for the "Big" players, there is a struggle for initiative between the "Big" players, various tools are used in the confrontation between them. Unfortunately, this is also the place where "non-professional" market participants lose their money, because they don't understand the processes that go on in the range...
  • "Blue (dash dot dot)" rectangle indicates the beginning of the buyers "Еxpansion" initiative. It shows the struggle between the "Big" players in the market, the potential expansion of the "Open Range" boundary or the possible formation of a new "Open range".
  • "Red (dash dot dot)" rectangle indicates the beginning of the sellers "Еxpansion" initiative. It shows the struggle between the "Big" players in the market, the potential expansion of the "Open Range" boundary or the possible formation of a new "Open range".
  • "Red" lines above the "Open Range" indicate the possible areas of "Limit Orders Barriers" of sellers.
  • "Blue" lines below the "Open Range" indicate the possible areas of "Limit Orders Barriers" of buyers.
"Limit Orders Barrier is a structure that is designed to restrict price movement in any direction by constantly placing limit orders against the movement. Typically observed above and below accumulation (range, balance)."
        • In combination with the "MR Reversal Patterns" indicator, you can see how buyers and sellers are distributed in the "Range". Since every trader waits for confirmation that their market entry is correct, the appearance of "Reversal Patterns" in the "Range" forms the accumulation of the open positions in a place, that we define as a "Point of Control" in the Volume Profile of the Range ". During the movement of the price in a trend, you can see how "Balances" are formed according to the "Auction Market Theory".
        • In combination with the "MR Volume POC Levels" indicator, you can see where important volumes are left after the exit from the "Balances" and "Ranges". In addition, you can see how the volumes are absorbed in the "Range" and accumulate positions of buyers and sellers.
          • In combination with the "MR Volume Profile Rectangles" indicator, you can see where the places with the highest concentration of the open positions. In "Range of Sellers", buyers remain in "Locked-in Range" - in the area below "POC" volume, while in "Range of Buyers", sellers remain in "Locked-in Range" - in the area above "POC" volume.
          • In combination with the "MR Sentiments by volumes" indicator, you can see the "Sentiments" inside the range. When we also have an "Expansion" of the sellers or the buyers, you can see the imbalance of all participants in the range to those in the "Expansion".
          • In combination with the "MR Trend Corrections" indicator, you can track the places where the volumes accumulate in the "Balances" and "Ranges" along the trend. Then the volumes of these places are absorbed in the "Correction" movements.


          Note:

          The indicator synchronizes the data from the time frames on which it works. Please wait a few seconds when needed...
          There may be slight differences between the figures, that are drawn on the chart of the time frame, that you selected in the indicator settings and the figures, that are drawn on the chart of the smaller time frames. This is related to the decomposition of the bar from the selected time frame to the smaller time frames. The bar of the selected time frame has a different structure of the smaller time frames. This is not a mistake!!! This is the option we have adopted to correctly determine the inputs and outputs of the ranges.

          If you liked the indicator, please support our work by giving 5 stars!!!


          For MetaTrader 5 https://www.mql5.com/en/market/product/63487


          Indicator settings:

          Show Multi Time Frame from: - Multi time frame on which to calculate the indicator. By default, the indicator works with data from time frame H4.
          Bars History for Ranges calculation: - Number of bars on which the indicator works from multi time frame H4.

          Section "Visual Trading Styles Settings"
          Style 1: Delete inactive "Ranges" - Shows or deletes "Ranges" closed by the price and shown with a dashed line.
          Style 2: Show "Open Range" only - Show only "Open Range" when this option is selected.
          Style 3: Show "Limit Barriers" - Shows or not "Limit Orders Barriers".
          Style 4: Show "Internal proportions" - Shows or not "Internal proportions" in the "Open Range".

          Section "Settings for Ranges"
          Color for "Range of Sellers" - You can select a color for "Range of Sellers".
          Color for "Range of Buyers" - You can select a color for "Range of Buyers".
          Color for "Open Range" - You can select a color for "Open Range".
          Line width for Ranges - You can select the line width for all non-closed Ranges.

          Section "Settings for Limit Barriers"
          Color for "Limit Barriers" of Sellers - You can select a color for "Limit Orders Barriers" of sellers.
          Color for "Limit Barriers" of Buyers - You can select a color for "Limit Orders Barriers" of buyers.
          Line width for "Limit Barriers" 1 & 3 - You can select the line width for "Limit Orders Barriers" 1 and 3. According to our research, these lines are less important to contain the price movement.
          Line width for "Limit Barriers" 2 & 4 - You can select the line width for "Limit Orders Barriers" 2 and 4. According to our research, these lines are more important to contain the price movement.

          Section "Settings for Expansion"
          Color for "Expansion" of Buyers - You can select a color for "Expansion" of buyers.
          Color for "Expansion" of Sellers - You can select a color for "Expansion" of sellers.
          "Expansion" line border style - You can select the line style for "Expansion".
          "Expansion" line border width - You can select the line width for "Expansion".

          Section "Range calculation settings"
          Range confirmation percentage test: - You can choose another setting to fulfill the "Range" formation criterion. By default, we set the test distance between two extremums equal to 75%. Other acceptable values are to 50%.

          Section "Alert setting"
          Alert when Range is closed - Displays an аlert when a "Range" is closed by the price movement and it is shown with a dashed line.

            İncelemeler 1
            David T
            303
            David T 2023.09.17 19:36 
             

            After downloading the demo I could see that this was something unseen and not mass distributed. I proceeded to the 1 year rental as I found it more economical versus the full price should the unlocked version not perform as in the tester. I am presently pleased even though the markets are closed during my backtesting this weekend , would be interesting to see if this repaints or lags. I am beginning to see that this is one of the most useful and powerful indicators ever produced provided it is used properly. My compliments to the author who has also responded in a timely fashion despite the time zone difference between our countries.

            Önerilen ürünler
            "Dinamik Scalping Osilatörü" - gelişmiş, özel bir Kripto-Forex göstergesi - MT4 için verimli bir işlem aracı! - Yeni nesil Osilatörler - nasıl kullanılacağını görmek için resimlere bakın. - Dinamik Scalping Osilatörü, uyarlanabilir Aşırı Satış/Aşırı Alım bölgelerine sahiptir. - Osilatör, dinamik Aşırı Satış/Aşırı Alım bölgelerinden kesin giriş noktalarını bulmak için yardımcı bir araçtır. - Aşırı Satış değerleri: Yeşil çizginin altında, Aşırı Alım değerleri: Turuncu çizginin üzerinde. - Bu gös
            Super Reversal Pattern
            Parfait Mujinga Ndalika
            Super Reversal Pattern Indicator Unlock the power of advanced pattern recognition with our Super Reversal Pattern Indicator. Designed for traders seeking precision and reliability, this indicator identifies one of the most effective reversal patterns in technical analysis, offering a significant edge in your trading strategy. Key Features: Non-Repainting Accuracy: Enjoy the confidence of non-repainting technology. Once a Super Reversal Pattern is detected, it remains static, providing consiste
            VR Cub
            Vladimir Pastushak
            VR Cub , yüksek kaliteli giriş noktaları elde etmenin bir göstergesidir. Gösterge, matematiksel hesaplamaları kolaylaştırmak ve bir pozisyona giriş noktalarının aranmasını basitleştirmek için geliştirildi. Göstergenin yazıldığı ticaret stratejisi uzun yıllardan beri etkinliğini kanıtlamaktadır. Ticaret stratejisinin basitliği, acemi yatırımcıların bile başarılı bir şekilde ticaret yapmasına olanak tanıyan büyük avantajıdır. VR Cub, pozisyon açılış noktalarını ve Kâr Al ve Zararı Durdur hedef sev
            Ortalama geri dönüş ticareti için profesyonel ve nicel bir yaklaşım uygulayan benzersiz gösterge. Fiyatın tahmin edilebilir ve ölçülebilir bir şekilde ortalamaya döndüğü ve yön değiştirdiği gerçeğinden yararlanır, bu da nicel olmayan ticaret stratejilerinden büyük ölçüde daha iyi performans gösteren net giriş ve çıkış kurallarına izin verir. [ Installation Guide | Update Guide | Troubleshooting | FAQ | All Products ] Ticaret sinyallerini temizle Ticaret yapmak inanılmaz derecede kolay Özelleşt
            Binary Options Support Resistance Indicator This indicator is designed for binary options trading and effectively shows retracements from support and resistance levels. Signals appear on the current candle. A red arrow pointing downwards indicates a potential selling opportunity, while a blue arrow pointing upwards suggests buying opportunities. All that needs adjustment is the color of the signal arrows. It is recommended to use it on the M1-M5 timeframes as signals are frequent on these timef
            EARLY REMINDER: The Starting price is 65 price will rise soon up to 365$ and then 750$ after first 10 copies of sales. Grab this offer now! Introduction Hello, traders! Welcome to the demonstration of the Forex Beast Indicator , a comprehensive tool designed to assist aspiring traders in navigating the complexities of the forex market. This indicator incorporates seven essential components to provide a well-rounded trading experience: Moving Averages Colored Zones Support and Resistance Levels
            SMC Venom Model BPR göstergesi, Akıllı Para (SMC) konseptinde çalışan yatırımcılar için profesyonel bir araçtır. Fiyat grafiğinde iki temel modeli otomatik olarak belirler: FVG   (Adil Değer Açığı), ilk ve üçüncü mum arasında boşluk bulunan üç mumun birleşimidir. Hacim desteğinin olmadığı seviyeler arasında bir bölge oluşturur ve bu da sıklıkla fiyat düzeltmesine yol açar. BPR   (Dengeli Fiyat Aralığı), bir "köprü" oluşturan iki FVG modelinin birleşimidir - bir kırılma bölgesi ve fiyatın düşük
            Bu, bir mumun kapanış fiyatını tahmin eden bir göstergedir. Gösterge öncelikle D1 çizelgelerinde kullanılmak üzere tasarlanmıştır. Bu gösterge hem geleneksel forex ticareti hem de ikili opsiyon ticareti için uygundur. Gösterge, bağımsız bir ticaret sistemi olarak kullanılabilir veya mevcut ticaret sisteminize ek olarak hareket edebilir. Bu gösterge, mevcut mumu analiz ederek mumun gövdesi içindeki belirli güç faktörlerini ve önceki mumun parametrelerini hesaplar. Böylece gösterge, piyasa hareket
            Gvs Undefeated Trend   indicator is designed for trend and signal trading. This indicator generates trend signals.  It uses many algorithms and indicators to generate this signal. It tries to generate a signal from the points with the highest trend potential. This indicator is a complete trading product. This indicator does not need any additional indicators.  You can only trade with this indicator. The generated signals are displayed on the graphical screen.  Thanks to the alert features you ca
            ROYAL DUTCH SKUNK USES THE TREND WAVE INDICATOR AND IT CAN IDENTIFY THE BEGINNING AND THE END OF A NEW WAVE TREND MOVEMENT. AS AN OSCILLATOR, THE INDICATOR IDENTIFIES THE OVERBOUGHT AND OVERSOLD ZONES. IT WORKS GREAT TO CATCH THE SHORT TERM PRICE REVERSALS AND USES A MARTINGALE STRATEGY TO CLOSE ALL TRADES IN PROFIT. USE DEFAULT SETTINGS ON H1 OR HIGHER TIME FRAME ON ANY PAIR FOR MORE ACCURATE TRADES WHY THIS EA : Smart entries calculated by 6 great strategies The EA can be run on even a $20000
            Trend Bilio - an arrow indicator without redrawing shows potential market entry points in the form of arrows of the corresponding color: upward red arrows suggest opening a buy, green down arrows - selling. The entrance is supposed to be at the next bar after the pointer. The arrow indicator Trend Bilio visually "unloads" the price chart and saves time for analysis: no signal - no deal, if an opposite signal appears, then the current deal should be closed. It is Trend Bilio that is considered
            Owl smart levels
            Sergey Ermolov
            4.24 (37)
            MT5 versiyonu  |  FAQ Owl Smart Levels Indicator ,   Bill Williams'ın gelişmiş fraktalları , piyasanın doğru dalga yapısını oluşturan Valable ZigZag ve kesin giriş seviyelerini gösteren   Fibonacci seviyeleri   gibi popüler piyasa analiz araçlarını içeren tek gösterge içinde eksiksiz bir ticaret sistemidir. pazara ve kar elde edilecek yerlere. Stratejinin ayrıntılı açıklaması Gösterge ile çalışma talimatı Baykuş Yardımcısı ticaretinde Danışman Yardımcısı Kullanıcıların özel sohbeti -> Satın ald
            The Infinity Expert Advisor is a scalper. When the resistance and support levels are broken, trades are opened in the direction of the price movement. Open positions are managed by several algorithms based on the current market situation (fixed stop loss and take profit, trailing stop, holding positions in case of trend indication, etc.). Requirements for the broker The EA is sensitive to spread, slippages and execution quality. It is strongly recommended not to use the EA for currencies with s
            Noize Absorption Index MT4
            Ekaterina Saltykova
            5 (1)
            Noize Absorption Index - is the manual trading system that measures the difference of pressure between bears forces and bulls forces. Green line - is a noize free index that showing curent situation. Zero value of index shows totally choppy/flat market.Values above zero level shows how powerfull bullish wave is and values below zero measures bearish forces.Up arrow appears on bearish market when it's ready to reverse, dn arrow appears on weak bullish market, as a result of reverse expectation. S
            This indicator works on MT4 and is very easy to use. When you receive a signal from it, you wait for that candle with the signal to close and you enter your trade at the beginning of the next new candle . A red arrow means sell and a green arrow means buy. All arrows comes with Alert  like for easy identification of trade signal. Are you okay with that? 1 minute candle 1 minute expire
            Infinity Trend Pro
            Yaroslav Varankin
            1 (1)
            This is a trend indicator without redrawing Developed instead of the binary options strategy (by the color of the Martingale candlestick) Also works well in forex trading When to open trades (binary options) A signal will appear in the place with a candle signaling the current candle It is recommended to open a deal for one candle of the current timeframe M1 and M5 When a blue dot appears, open a deal up When a red dot appears, open a trade down. How to open trades on Forex. When a signal is rec
            Indicator for binary options arrow is easy to use and does not require configuration works on all currency pairs, cryptocurrencies buy signal blue up arrow sell signal red down arrow tips do not trade during news and 15-30 minutes before their release, as the market is too volatile and there is a lot of noise it is worth entering trades one or two candles from the current period (recommended for 1 candle) timeframe up to m 15 recommended money management fixed lot or fixed percentage of the depo
            Smart Funded Hft
            Barbaros Bulent Kortarla
            4.81 (64)
            Smart Funded HFT EA ile Ticaret Potansiyelinizi Açın! VPS GEREKTİRMEZ / AYAR DOSYALARI GEREKTİRMEZ / PRİZ VE OYNAT KEYFİNİ ÇIKARIN / kolay kurulum videosunu aşağıda kontrol edin SINIRLI SÜRE İÇİN TANITIM FİYATI Ticaret sırrımı paylaşmaktan heyecan duyuyorum – Smart Funded EA. Yüzlerce zorlukla mükemmel bir başarı oranıyla mücadele ettim ve şimdi sıra ticaret oyununuzu yükseltmeye geldi! BU EA, HFT KULLANIMINA İZİN VEREN PROP FİRMALARIN HFT ZORLUKLARINI GEÇMEK İÇİN TASARLANMIŞTIR. HFT KULLANIMINA
            The new update makes this indicator a complete tool for studying, analyzing and operating probabilistic patterns. It includes: On-chart Multi-asset percentage monitor. Configurable martingales. Twenty-one pre-configured patterns , including Mhi patterns and C3. An advanced pattern editor to store up to 5 custom patterns. Backtest mode to test results with loss reports. Trend filter. Hit operational filter. Martingale Cycles option. Various types of strategies and alerts. Confluence between patte
            Shark Deal Book
            Philip Pankaj Suthagar
            4 (3)
            Term  "shark"  in the business world denotes a high volume investor who just made a good investment in a highly Potential business deal.So, sharks are the ones who make the market move. In our case, if an American shark bought a Japanese company, he/she has to convert American dollars into Japanese yen to make the deal. So, the demand for the Japanese yen will increase sharply. Thus USD/JPY will go short rapidly if the deal was from the shark. Another example, In the case of forex, if fed increa
            Crypto_Forex Göstergesi "Dinamik Aşırı Satış/Aşırı Satın Alma bölgeleriyle Güç Endeksi" MT4 için Yeniden Boyama Yok. - Güç endeksi, fiyat ve hacim verilerini tek bir değerde birleştiren en iyi göstergelerden biridir. - Dinamik Aşırı Satın Alma bölgesinden Satış işlemlerini ve dinamik Aşırı Satış bölgesinden Satın Alma işlemlerini almak harikadır. - Bu gösterge, Momentum ticareti için trend yönünde mükemmeldir. - Dinamik Aşırı Satın Alma bölgesi - sarı çizginin üstünde. - Dinamik Aşırı Satış bö
            Crypto_Forex Göstergesi MT4 için "Sabah Yıldızı deseni". - "Sabah Yıldızı deseni" göstergesi Fiyat Hareketi ticareti için çok güçlü bir göstergedir: Yeniden boyama yok, gecikme yok. - Gösterge grafikte boğa Sabah Yıldızı desenlerini algılar: Grafikte mavi ok sinyali (resimlere bakın). - PC, Mobil ve E-posta uyarılarıyla. - Ayrıca kardeşi - ayı "Akşam Yıldızı deseni" göstergesi mevcuttur (aşağıdaki bağlantıyı takip edin). - "Sabah Yıldızı deseni" göstergesi Destek/Direnç Seviyeleriyle birleştir
            Wolfe waves ultra
            Ruslan Pishun
            5 (1)
            Wolfe waves ultra draws Wolfe Waves automatically. The indicator searches for the Wolfe Waves on three timeframes. This indicator is especially accurate because it waits for a breakout in the wave direction before signaling the trade, resulting in a very high winning ratio. Features Amazingly easy to trade. The indicator is able to recognize all Wolfe Wave patterns in a specified interval. Thus, we check each extremum for the potential 1,2,3,4,5 points apart from ZigZag vertices. The indicator
            KT Renko Patterns MT4
            KEENBASE SOFTWARE SOLUTIONS
            2.33 (3)
            KT Renko Patterns, Renko grafiğini tuğla tuğla tarayarak, farklı finansal piyasalarda yatırımcılar tarafından sıkça kullanılan popüler grafik formasyonlarını tespit eder. Zaman tabanlı grafiklerle karşılaştırıldığında, Renko grafiklerinde işlem yapmak daha kolay ve belirgindir çünkü grafik sade ve temiz bir yapıya sahiptir. KT Renko Patterns birçok Renko formasyonunu içerir ve bunların çoğu Prashant Shah'ın “Renko Grafikleriyle Karlı Ticaret” adlı kitabında ayrıntılı olarak açıklanmıştır. Bu g
            Chart Patterns Detect 15 patterns (Ascending Triangle, Descending Triangle, Rising Wedge, Falling Wedge, Bullish Flag, Bearish Flag, Bullish Rectangle, Bearish Rectangle Symmetrical triangle, Head and Shoulders, Inverted Head and Shoulders, Triple top, Triple Bottom, Double Top, Double Bottom) Use historical data to calculate the probability of each pattern to succeed (possibility to filter notification according to the chance of success) gives graphic indication about the invalidation level and
            This is a new strategy for SUPPLY DEMAND areas It is based on a calculation using the tick volume to detect the big price action in market for both bear /bull actions this smart volume action candles are used to determine the supply and demand areas prices in between main supply and demand lines indicate sideway market  up arrows will be shown when prices moves above the main supply and the secondary supply lines Down arrows will be shown when prices moves below the main demand and the secondary
            Night ghost
            Dmitriy Kashevich
            Night Ghost - İkili opsiyonlar için ok göstergesi. Bu, gelecekte sizin için güvenilir bir yardımcıdır! - Grafikte yeniden çizim yok -Tüm döviz çiftlerinde harika çalışıyor! -%90'a varan gösterge doğruluğu (Özellikle geceleri) -Uzun süre kurulum yapmaya gerek yok (İkili Opsiyonlar için mükemmel kurulum) - Geç olmayan sinyaller - Mevcut mum üzerinde bir sinyalin görünümü -M1 dönemi için mükemmel (Artık Yok!) - Göz dostu mum rengi (Kırmızı ve Mavi) -Yüklü Uyarı Onunla çalışmak: - Mavi
            Quantum Balance
            Adolfina Denysenko
            Quantum Balance is a modern arrow indicator that identifies key price reversal points in the market with high accuracy. It is based on a combination of WPR (Williams %R) and RSI (Relative Strength Index), which allows you to identify overbought/oversold moments and enter trades at points of maximum potential. The indicator analyzes price dynamics and market conditions, generating signals only when several confirming factors coincide. This reduces the number of false signals and increases tradin
            "Auto FIBO Pro" Crypto_Forex göstergesi - ticarette harika bir yardımcı araçtır! - Gösterge, Fibo seviyelerini ve yerel trend çizgilerini (kırmızı renk) otomatik olarak hesaplar ve grafikte yerleştirir. - Fibonacci seviyeleri, fiyatın tersine dönebileceği önemli alanları gösterir. - En önemli seviyeler %23,6, %38,2, %50 ve %61,8'dir. - Ters scalping veya bölge ızgara ticareti için kullanabilirsiniz. - Auto FIBO Pro göstergesini kullanarak mevcut sisteminizi geliştirmek için birçok fırsat vardı
            We present you the indicator "Candle closing counter", which will become your indispensable assistant in the world of trading. That’s why knowing when the candle will close can help: If you like to trade using candle patterns, you will know when the candle will be closed. This indicator will allow you to check if a known pattern has formed and if there is a possibility of trading. The indicator will help you to prepare for market opening and market closure. You can set a timer to create a pre
            Bu ürünün alıcıları ayrıca şunları da satın alıyor
            Şu anda %20 İNDİRİMLİ! Herhangi bir Acemi veya Uzman Tüccar için En İyi Çözüm! Bu gösterge paneli yazılımı 28 döviz çifti üzerinde çalışıyor. Ana göstergelerimizden 2'sine (Gelişmiş Para Birimi Gücü 28 ve Gelişmiş Para Birimi Dürtüsü) dayanmaktadır. Tüm Forex piyasasına harika bir genel bakış sağlar. Gelişmiş Para Birimi Gücü değerlerini, para birimi hareket hızını ve tüm (9) zaman dilimlerinde 28 Forex çifti için sinyalleri gösterir. Trendleri ve / veya scalping fırsatlarını belirlemek için
            Dynamic Forex28 Navigator
            Bernhard Schweigert
            5 (6)
            Dynamic Forex28 Navigator - Yeni Nesil Forex Ticaret Aracı. ŞU ANDA %49 İNDİRİM. Dynamic Forex28 Navigator, uzun zamandır popüler olan göstergelerimizin evrimidir ve üçünün gücünü tek bir göstergede birleştirir: Gelişmiş Döviz Gücü28 Göstergesi (695 inceleme) + Gelişmiş Döviz İMPULS ve UYARI (520 inceleme) + CS28 Kombo Sinyalleri (Bonus). Gösterge hakkında ayrıntılar https://www.mql5.com/en/blogs/post/758844 Yeni Nesil Güç Göstergesi Ne Sunuyor?  Orijinallerde sevdiğiniz her şey, şimdi yeni
            AMD Adaptive MA MT4
            Vincent Jose Proenca
            5 (1)
            AMD Uyarlanabilir Hareketli Ortalama (AAMA) AAMA, MetaTrader 4 için geliştirilmiş, piyasa koşullarına göre tepkisini otomatik olarak ayarlayan bir uyarlanabilir hareketli ortalama göstergesidir. Temel Özellikler: Kaufman Verimlilik Oranı’na dayalı uyarlanabilir hareketli ortalama – güçlü trendlerde hızlı tepki verir, yatay piyasalarda gürültüyü filtreler 4 AMD piyasa aşamasının otomatik tespiti: Birikim (Accumulation), Yükseliş (Markup), Dağıtım (Distribution), Düşüş (Markdown) ATR aracılığıyla
            First time on MetaTrader, introducing IQ Star Lines - an original Vedic Astrology based indicator. IQ Star Lines, an unique astrological indicator purely based on   Vedic astrology   calculations, published for the   first time on Metatrader.  This unique tool plots dynamic planetary grid lines based on real-time stars, constellations, and celestial movements, which allows you to plot the power of the cosmos directly onto your trading charts. This indicator is specifically designed for scalpers
            Presenting one-of-a-kind Gann Indicator for XAUUSD IQ Gold Gann Levels is a non-repainting, precision tool designed exclusively for XAUUSD/Gold intraday trading. It uses W.D. Gann’s square root method to plot real-time support and resistance levels, helping traders spot high-probability entries with confidence and clarity. William Delbert Gann (W.D. Gann) was an exceptional market analyst whose trading technique was based on a complex blend of mathematics, geometry, astrology, and ancient calcul
            NAM Order Blocks
            NAM TECH GROUP, CORP.
            3.67 (3)
            MT4 Multi-timeframe Order Blocks detection indicator. Features - Fully customizable on chart control panel, provides complete interaction. - Hide and show control panel wherever you want. - Detect OBs on multiple timeframes. - Select OBs quantity to display. - Different OBs user interface. - Different filters on OBs. - OB proximity alert. - ADR High and Low lines. - Notification service (Screen alerts | Push notifications). Summary Order block is a market behavior that indicates order collection
            Supply and Demand Dashboard PRO
            Bernhard Schweigert
            4.8 (20)
            Şu anda %20 İNDİRİMLİ! Bu gösterge paneli, birden fazla sembol ve 9 zaman dilimine kadar çalışan çok güçlü bir yazılım parçasıdır. Ana göstergemize dayanmaktadır (En iyi yorumlar: Advanced Supply Demand ).     Gösterge paneli harika bir genel bakış sağlar. Gösterir:    Bölge mukavemet derecesi dahil filtrelenmiş Arz ve Talep değerleri, Bölgelere/ve bölgeler içindeki pip mesafeleri, İç içe geçmiş bölgeleri vurgular, Tüm (9) zaman dilimlerinde seçilen semboller için 4 çeşit uyarı verir. Kişisel
            GoldRush Trend Ok Sinyali GoldRush Trend Ok Sinyali göstergesi, XAU/USD'de yüksek hızlı, kısa vadeli scalperlar için özel olarak tasarlanmış hassas, gerçek zamanlı trend analizi sağlar. 1 dakikalık zaman dilimi için özel olarak tasarlanan bu araç, net giriş noktaları için yön okları gösterir ve scalper'ların değişken piyasa koşullarında güvenle hareket etmelerini sağlar. Gösterge, PRIMARY ve SECONDARY uyarı oklarından oluşur. PRIMARY sinyalleri, trend yönündeki değişikliği gösteren Beyaz ve
            " Dynamic Scalper System " göstergesi, trend dalgaları içinde işlem yapmak için scalping yöntemi için tasarlanmıştır. Başlıca döviz çiftleri ve altın üzerinde test edilmiştir, diğer işlem araçlarıyla uyumluluğu mümkündür. Ek fiyat hareketi desteğiyle trend boyunca pozisyonların kısa vadeli açılması için sinyaller sağlar. Göstergenin prensibi. Büyük oklar trend yönünü belirler. Küçük oklar şeklinde scalping için sinyaller üreten bir algoritma trend dalgaları içinde çalışır. Kırmızı oklar yüksel
            "Dragon's Tail" is an integrated trading system, not just an indicator. This system analyzes each candle on a minute-by-minute basis, which is particularly effective in high market volatility conditions. The "Dragon's Tail" system identifies key market moments referred to as "bull and bear battles". Based on these "battles", the system gives trade direction recommendations. In the case of an arrow appearing on the chart, this signals the possibility of opening two trades in the indicated directi
            Super Signal – Skyblade Edition Profesyonel No-Repaint / Gecikmesiz Trend Sinyal Sistemi, Olağanüstü Kazanma Oranı ile | MT4 / MT5 için Temel Özellikler: Super Signal – Skyblade Edition, özellikle trend bazlı işlemler için geliştirilmiş akıllı bir sinyal sistemidir. Yalnızca güçlü, yönlü ve gerçek momentum destekli piyasa hareketlerini tespit etmek amacıyla çok katmanlı bir filtreleme yapısı kullanır. Bu sistem zirve veya dip noktaları tahmin etmeye çalışmaz. Aşağıdaki üç koşul aynı anda karşıl
            Elliott Wave Trend was designed for the scientific wave counting. This tool focuses to get rid of the vagueness of the classic Elliott Wave Counting using the guideline from the template and pattern approach. In doing so, firstly Elliott Wave Trend offers the template for your wave counting. Secondly, it offers Wave Structural Score to assist to identify accurate wave formation. It offers both impulse wave Structural Score and corrective wave Structure Score. Structural Score is the rating to sh
            Key level wedge pro
            Presley Annais Tatenda Meck
            5 (1)
            We have combined all of our beloved indicators the likes of: Key level order block , Key level supply and demand , Key level liquidity grab and Key level wedge into one single indicator and dashboard. Whats new Dashboard : There is an easy access dashboard for all your needs. Multi-timeframe button : There is now a multi-timeframe option for Order Blocks and Supply and demand zones, making it easy to see higher timeframe zones easily on the current timeframe by just clicking the desired timefra
            Price Direction Oscillator - kısa ve orta vadeli piyasa hareketlerini tespit etmek için tasarlanmış bir göstergedir. Herhangi bir piyasa ve zaman dilimine uyarlanabilir. Bir trend çizgisi, bir piyasa oynaklığı osilatörü ve potansiyel bir işlem sinyali üretecinden oluşur. Gösterge Kullanımı Piyasa oynaklığına göre trendi belirler ve AL veya SAT emirlerinin açılması için sinyaller sağlar. Geçmiş verileri yeniden çizilmeden, sinyal okları renk değiştirmez ve mumun kapanışında görünür. Sinyalin ar
            Introduction to Fractal Pattern Scanner Fractal Indicator refers to the technical indicator that makes use of the fractal geometry found in the financial market. Fractal Pattern Scanner is the advanced Fractal Indicator that brings the latest trading technology after the extensive research and development work in the fractal geometry in the financial market. The most important feature in Fractal Pattern Scanner is the ability to measure the turning point probability as well as the trend probabi
            TPSpro RFI Levels
            Roman Podpora
            4.85 (27)
            Şimdi RFI SEVİYELERİ satın alın ve bir başka gelişmiş seviye göstergesini ücretsiz edinin Almak için özel mesaj yoluyla yazın. TALİMATLAR RUS   /   TALİMATLAR   ENG   /   Sürüm MT5 Ana fonksiyonları: Satıcı ve alıcıların aktif bölgelerini görüntüler! Gösterge, satın alma ve satışlar için tüm doğru ilk dürtü seviyelerini/bölgelerini görüntüler. Giriş noktaları arayışının başladığı bu seviyeler/bölgeler etkinleştirildiğinde, seviyeler renk değiştirir ve belirli renklerle doldurulur. Ayrıca, duru
            RelicusRoad Pro
            Relicus LLC
            4.63 (106)
            Ne kadar harika geriye dönük testler, canlı hesap performans kanıtları ve her yerde fantastik istatistikler sunan bir alım satım göstergesi aldınız, ancak onu kullandıktan sonra hesabınızı **patlatmakla mı sonuçlandınız?** Bir sinyale tek başına güvenmemelisiniz, öncelikle neden ortaya çıktığını bilmeniz gerekir ve RelicusRoad Pro bunu en iyi şekilde yapar! Kullanım Kılavuzu + Stratejiler + Eğitim Videoları + VIP Erişimli Özel Grup + Mobil Sürüm Mevcut Piyasaya Bakmanın Yeni Bir Yolu RelicusR
            How to use Pair Trading Station Pair Trading Station is recommended for H1 time frame and you can use it for any currency pairs. To generate buy and sell signal, follow few steps below to apply Pair Trading Station to your MetaTrader terminal. When you load Pair Trading Station on your chart, Pair Trading station will assess available historical data in your MetaTrader platforms for each currency pair. On your chart, the amount of historical data available will be displayed for each currency pai
            Supreme Commander
            Ramon Sobrevals Arce
            4.13 (8)
            The indicator of the indicators. The Most Powerful Technique to Determine Forex Trend Strength in 2023. We have perfected Supreme Commander that it calculates an average of the selected indicators (up to 16) and the selected timeframe (all) with the result of a single trend that indicates the potential of buying and selling.  It includes the following indicators: Accelerator/Decelerator oscillator Average Directional Movement Index Awesome oscillator; Bulls and Bears  Commodity Channel Index; De
            Scientific trade
            Aleksey Ivanov
            5 (1)
            An extremely convenient indicator that truly makes the process of making money on the exchange easy. It is based on the scientifically rigorous theory of the market developed by the author, the beginning of which is presented here .                The full algorithm of this indicator operation is presented in the article .               The indicator calculates the most probable price movement trajectory and displays it on the chart. Based on the predicted price movement trajectory
            Welcome to the world of SMC (Smart Money Concepts) Trading, where we empower traders with the tools and knowledge to make smarter trading decisions. Our latest addition to our suite of trading tools is the SMC Trading Pro indicator, version 1.0. Key Features: Major Market Structure Identification with BODY break. Order Block must be in Major Swing ( not Small Swing ). Order Block with Fair Value Gap Detection. Order Block in Discount | Premium zone. Filter for only Bullish, Bearish or All Order
            Precision Index Osilatörü (Pi-Osc) - Precision Trading Systems'dan Roger Medcalf Sürüm 2, grafiklerinizde hızlı bir şekilde yüklenmek üzere dikkatle yeniden kodlandı ve deneyimi artırmak için bazı teknik geliştirmeler de içerdi. Pi-Osc, herkesin stoplarını almak için zorlanan pazarların gitmek zorunda kaldığı aşırı yorgunluk noktalarını bulmak için tasarlanmış doğru ticaret zamanlama sinyalleri sunmak amacıyla oluşturuldu. Bu ürün, aşırı noktaların nerede olduğunu bilmek gibi yaşlı bir sorun
            Hidden Cycles
            Lev Vladimirovic Marushkin
            5 (1)
            Based on Universal Laws — NOT Some Guy’s Algorithm: Let the market adjust to the Hidden Cycles Geometry — not the other way around. Most indicators are based on a man-made formula. They often lag, fail over time, or need constant re-optimization.  Hidden Cycles is different. It’s the first and only MT4 indicator rooted in universal proportion and perfect relation — the invisible structure that governs all market behavior. Inspired by ideas from Fibonacci, Gann, and Murrey — and built as somethi
            Enigmera
            Ivan Stefanov
            5 (8)
            ENIGMERA: Pazarın Kalbi Önemli: MQL5.com demosu Strategy Tester'da çalışır ve Enigmera'nın tüm işlevlerini tam olarak yansıtmayabilir. Daha fazla bilgi için açıklamayı, ekran görüntülerini ve videoyu kontrol edin. Herhangi bir sorunuz varsa, bana mesaj göndermekten çekinmeyin! Göstergenin kodu tamamen yeniden yazılmıştır. 3.0 sürümü, yeni işlevler ekler ve göstergenin başlangıcından bu yana biriken hataları giderir. Giriş Bu gösterge ve ticaret sistemi, finansal piyasalara dikkat çekici bir ya
            POWR Rise Coming
            Trade Indicators LLC
            This indicator is SO SIMPLE… when the green Rise Coming arrow appears, a price drop may be on the way! Plain and easy profits! As you receive more than one 'Rise Coming' text signal in a downtrend, it means momentum is building larger for a bull run. HOW TO USE 1. When the green "Rise Coming" text appears, a price jump may be on the way! This indicator Never Repaints! To get the best setting it's a matter of tweaking the indicator until it gives you the best results. Our recommendation, and what
            IQ FX Gann Levels a precision trading indicator based on W.D. Gann’s square root methods. It plots real-time, non-repainting support and resistance levels to help traders confidently spot intraday and scalping opportunities with high accuracy. William Delbert Gann (W.D. Gann) was an exceptional market analyst, whose trading technique was based on a complex blend of mathematics, geometry, astrology, and ancient mathematics which proved to be extremely accurate. Download the Metatrader 5 Version M
            Ultimate Arrow Indicator - Ticaret Başarınız için Araç! Çok şey vaat eden ama az şey sunan araçlardan bıktınız mı? MT4 için Ultimate Arrow Indicator, ticaretinizi bir sonraki seviyeye taşıyan nihai çözümünüzdür. Bu gösterge, size net, güvenilir ve tavizsiz sinyaller sunmak için cerrahi bir hassasiyetle tasarlanmıştır. İşte bu yüzden Ultimate Arrow Indicator, deneyimli trader'lar ve yeni başlayanlar için ideal bir seçimdir: Olağanüstü Performans - Kanıtlanmış Sonuçlar 1 yıl detaylı geri test: %9
            BinaryUniversal is a signal indicator for binary options and Forex. In its work, the indicator uses a complex algorithm for generating signals. Before forming a signal, the indicator analyzes volatility, candlestick patterns, important support and resistance levels. The indicator has the ability to adjust the accuracy of the signals, which makes it possible to apply this indicator for both aggressive and conservative trading. The indicator is set in the usual way, it works on any time period and
            Predictive Levels
            Satya Prakash Mishra
            Market predictive price levels are key technical analysis tools is my finest invention through mathematics to predict automatically next price is where to reach after break any levels. A unique name quality it automatically calculate price range its my own invention according price value to predict what's is next price came than after it not fixed levels like Fibonacci or pivots Its Naveen's Predictive Levels .used to forecast where an asset's price might find support (stop falling) or resistanc
            Introduction to X3 Chart Pattern Scanner X3 Cherart Pattern Scanner is the non-repainting and non-lagging indicator detecting X3 chart patterns including Harmonic pattern, Elliott Wave pattern, X3 patterns, and Japanese Candlestick patterns. Historical patterns match with signal patterns. Hence, you can readily develop the solid trading strategy in your chart. More importantly, this superb pattern scanner can detect the optimal pattern of its kind. In addition, you can switch on and off individu
            Yazarın diğer ürünleri
            MR Volume POC Levels 4
            Sergey Khramchenkov
            5 (3)
            The most crucial price level in any "Volume Profile" is the "Point of Control" . Is the price level with the highest traded volume. And mainly, is the level where the big guys start there their positions, so it's an accumulation/distribution level for smart money. The idea of the indicator arose after the "MR Volume Profile Rectangles" indicator was made. When creating the "MR Volume Profile Rectangles" indicator, we spent a lot of time comparing the volumes with those from the volume profile
            MR Reversal Patterns 4
            Sergey Khramchenkov
            5 (2)
            In the "Masters of Risk" trading system, one of the main concepts is related to places where markets change direction. In fact, this is a change in priority and a violation of the trend structure at the extremes of the market, where supposedly there are or would be stop-losses of "smart" participants who are outside the boundaries of the accumulation of volume. For this reason, we call them "Reversal Patterns" - places with a lot of weight for the start of a new and strong trend. Some of the imp
            MR Reversal Patterns 5
            Sergey Khramchenkov
            5 (2)
            In the "Masters of Risk" trading system, one of the main concepts is related to places where markets change direction. In fact, this is a change in priority and a violation of the trend structure at the extremes of the market, where supposedly there are or would be stop-losses of "smart" participants who are outside the boundaries of the accumulation of volume. For this reason, we call them "Reversal Patterns" - places with a lot of weight for the start of a new and strong trend. Some of the imp
            A "Volume Profile" is an advanced charting indicator that displays total volume traded at every price level over a user specified time period. The main components of the volume profile are POC ( Point Of Control - the price level, at which the maximum number of contracts were executed during a selected period), VAH ( Value Area High - the highest price in the Value Area) and VAL ( Value Area Low - the lowest price in the Value Area). When we settled on the original indicator, we spent a lot of
            MR Dynamic POC 4
            Sergey Khramchenkov
            The most crucial price level in any "Volume Profile" is the "Point of Control" . Is the price level with the highest traded volume. And mainly, is the level where the big guys start there their positions, so it's an accumulation/distribution level for smart money. The idea of the indicator arose after the "MR Volume Profile Rectangles" indicator was made. When creating the "MR Volume Profile Rectangles" indicator, we spent a lot of time comparing the volumes with those from the volume profile
            "Sentiments of traders" in the financial markets is a topic that has been of interest to us for a long time. In time, we could not find the right formula to define these sentiments. We went through many stages in the search for the right methodology - from taking data from external sources to calculate open positions of buyers and sellers to calculating tick volumes, but still we were not satisfied with the results. The calculation of open positions of buyers and sellers from external sources ha
            MR Range Breakouts 5
            Sergey Khramchenkov
            5 (2)
            " A trading range occurs when a financial instrument trades between constant high and low prices over a period of time. The upper part of the trading range of a financial instrument often provides price resistance, while the lower part of the trading range usually offers price support.  Traders can enter in the direction of a breakout or breakdown from a trading range... " This is the "Classical Theory" understanding of ranges. We have a different understanding of the nature of ranges and the
            The most crucial price level in any "Volume Profile" is the "Point of Control" . Is the price level with the highest traded volume. And mainly, is the level where the big guys start there their positions, so it's an accumulation/distribution level for smart money. The idea of the indicator arose after the "MR Volume Profile Rectangles" indicator was made. When creating the "MR Volume Profile Rectangles" indicator, we spent a lot of time comparing the volumes with those from the volume profile
            A "Volume Profile" is an advanced charting indicator that displays total volume traded at every price level over a user specified time period. The main components of the volume profile are POC ( Point Of Control - the price level, at which the maximum number of contracts were executed during a selected period), VAH ( Value Area High - the highest price in the Value Area) and VAL ( Value Area Low - the lowest price in the Value Area). When we settled on the original indicator, we spent a lot of
            MR Dynamic POC 5
            Sergey Khramchenkov
            The most crucial price level in any "Volume Profile" is the "Point of Control" . Is the price level with the highest traded volume. And mainly, is the level where the big guys start there their positions, so it's an accumulation/distribution level for smart money. The idea of the indicator arose after the "MR Volume Profile Rectangles" indicator was made. When creating the "MR Volume Profile Rectangles" indicator, we spent a lot of time comparing the volumes with those from the volume profile
            "Sentiments of traders" in the financial markets is a topic that has been of interest to us for a long time. In time, we could not find the right formula to define these sentiments. We went through many stages in the search for the right methodology - from taking data from external sources to calculate open positions of buyers and sellers to calculating tick volumes, but still we were not satisfied with the results. The calculation of open positions of buyers and sellers from external sources ha
            Filtrele:
            David T
            303
            David T 2023.09.17 19:36 
             

            After downloading the demo I could see that this was something unseen and not mass distributed. I proceeded to the 1 year rental as I found it more economical versus the full price should the unlocked version not perform as in the tester. I am presently pleased even though the markets are closed during my backtesting this weekend , would be interesting to see if this repaints or lags. I am beginning to see that this is one of the most useful and powerful indicators ever produced provided it is used properly. My compliments to the author who has also responded in a timely fashion despite the time zone difference between our countries.

            Sergey Khramchenkov
            2249
            Geliştiriciden yanıt Sergey Khramchenkov 2023.09.18 07:03
            Thank you David T!!!
            İncelemeye yanıt