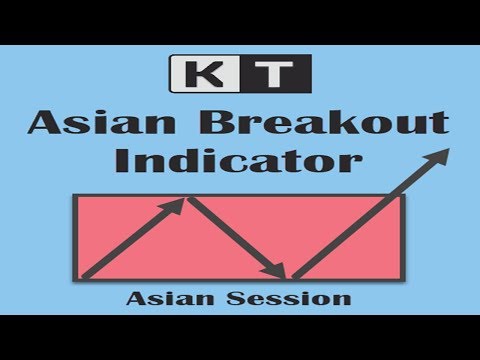
KT Asian Breakout Indicator
- Göstergeler
- Sürüm: 1.2
- Güncellendi: 19 Eylül 2020
- Etkinleştirmeler: 5

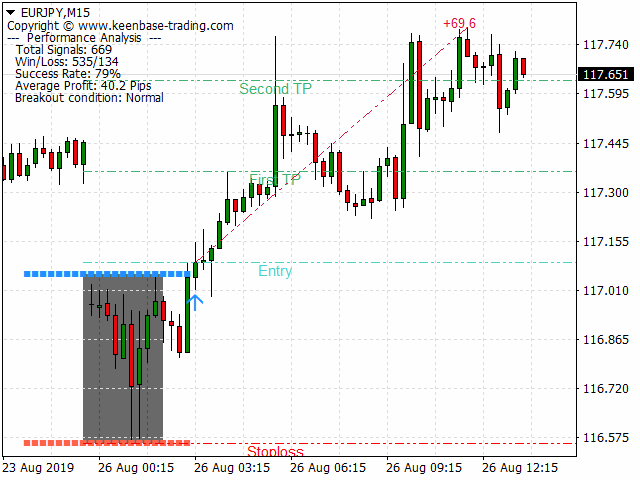
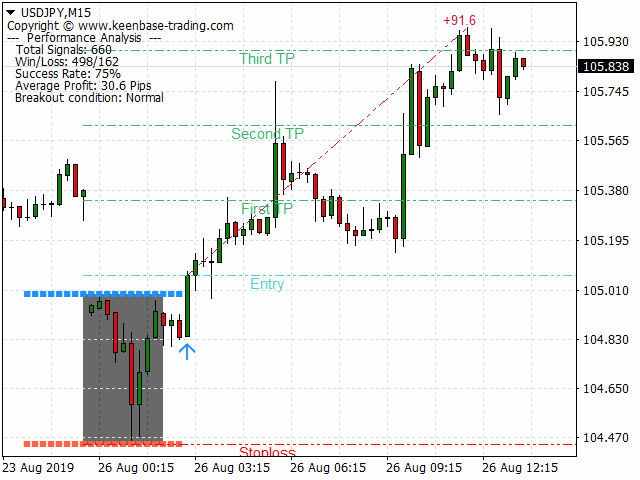
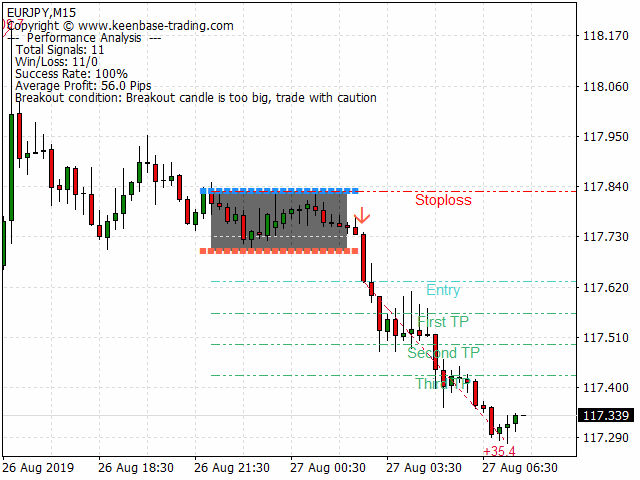
KT Asian Breakout göstergesi, Asya seansının kritik bir bölümünü analiz ederek fiyatın kırılma yönüne göre çift yönlü alım ve satım sinyalleri üretir. Fiyat seansın en yüksek seviyesini kırarsa alım sinyali oluşur, en düşük seviyesini kırarsa satış sinyali oluşur.
Dikkat Edilmesi Gerekenler
- Eğer seans kutusu dikey olarak çok genişse, yeni bir işlemden kaçınılmalıdır çünkü fiyat hareketlerinin büyük bir kısmı zaten bu kutu içinde gerçekleşmiştir.
- Eğer kırılma mumu çok büyükse, fiyat genellikle sinyal yönüne devam etmeden önce kısa süreli bir geri çekilme yapar.
Özellikler
- Alım/satım sinyalleri stop-loss ve kar hedeflerini içerir.
- KT Asian Breakout göstergesi, performansını sürekli olarak izler ve başarı kriteri olarak birinci, ikinci veya üçüncü kar hedefini kullanır.
- Kazanan/kaybeden sinyallerin sayısı, başarı oranı ve sinyal başına ortalama pip gibi üç temel performans metriğini görüntüler.
- Eğer kırılma mumu çok büyükse, grafikte bir uyarı mesajı görüntülenir.
Öneriler
- Zaman Dilimi: 15 dakika.
- Pariteler: Tüm JPY çiftleri.
Giriş Parametreleri
- Seans Kutusunu Çiz: true/false
- Stop-loss ve Kar Hedeflerini Göster: true/false
- Performans Analizi: true/false
- Metin Analizini Göster (sol üst köşe): true/false
- Başarı Oranı Kriteri: birinci hedef | ikinci hedef | üçüncü hedef
- Renk ve Stil Ayarları: özelleştirilebilir
- Uyarı Ayarları: özelleştirilebilir
Geliştiriciler İçin
double Buy_Signal    = iCustom(NULL,0,"Market/KT Asian Breakout Indicator",0,1);
double Sell_Signal   = iCustom(NULL,0,"Market/KT Asian Breakout Indicator",1,1);
double Buy_Stoploss  = iCustom(NULL,0,"Market/KT Asian Breakout Indicator",2,1);
double Sell_Stoploss = iCustom(NULL,0,"Market/KT Asian Breakout Indicator",3,1);

if(Buy_Signal!=0) // Alış koşulu oluştu
if(Sell_Signal!=0) // Satış koşulu oluştu

// Grafikten hedef fiyatları al
First Target = NormalizeDouble(ObjectGetDouble(0,"KT_FTP",OBJPROP_PRICE),Digits);
SecondTarget = NormalizeDouble(ObjectGetDouble(0,"KT_STP",OBJPROP_PRICE),Digits);
Third Target = NormalizeDouble(ObjectGetDouble(0,"KT_TTP",OBJPROP_PRICE),Digits);