Bollinger Bands Dashboard MT4
- Göstergeler
- Sürüm: 3.90
- Güncellendi: 7 Mayıs 2025
- Etkinleştirmeler: 10

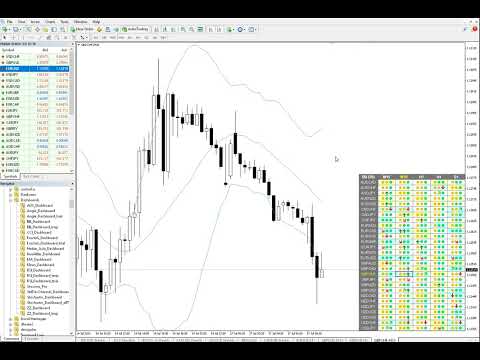
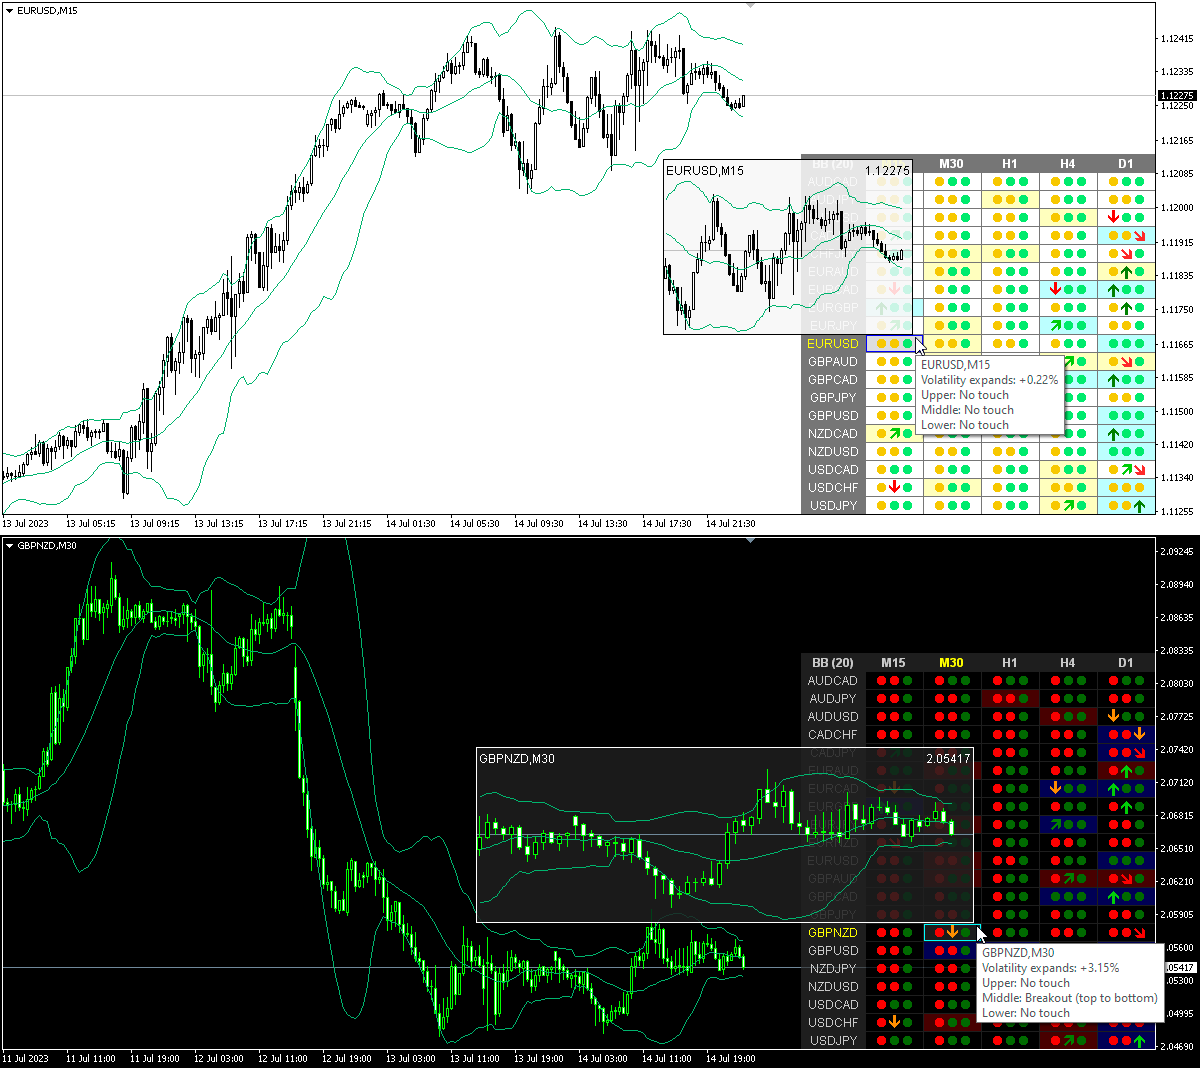
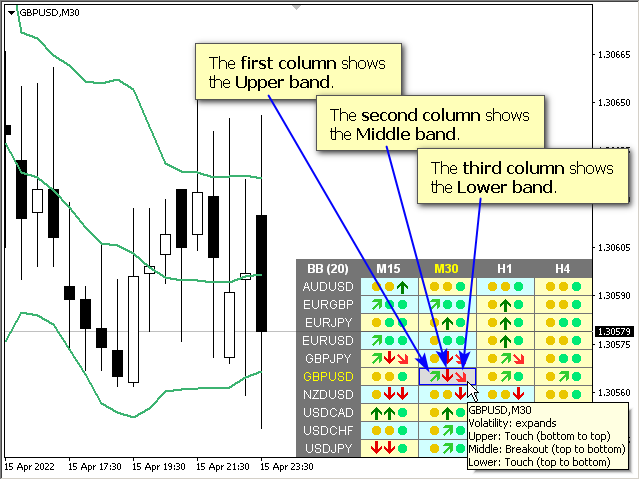
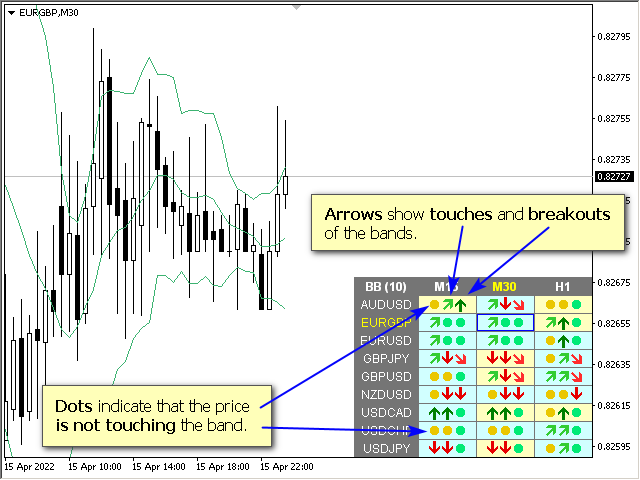
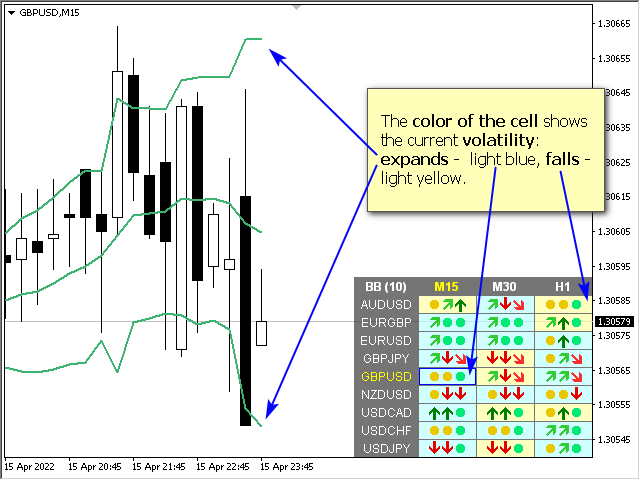
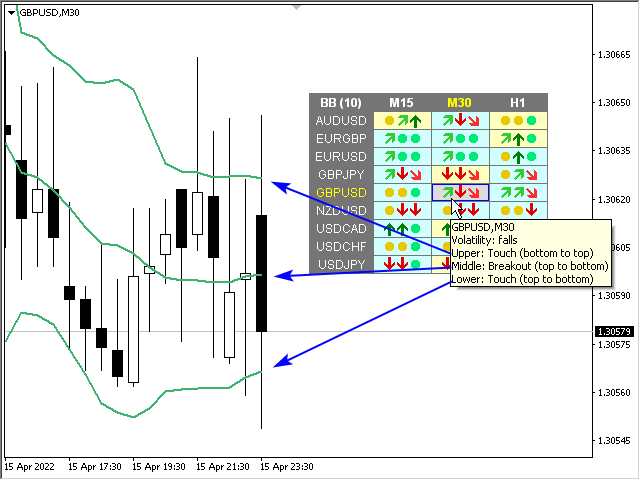
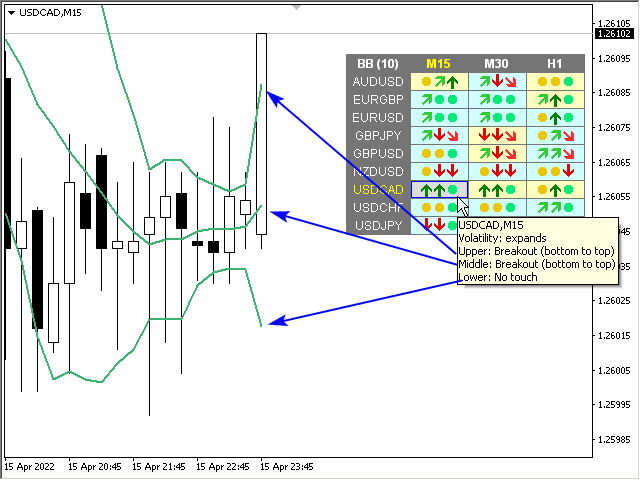
Gösterge Bollinger Bantlarının çoklu para birimi ve çoklu zaman çerçevesi modifikasyonu. Kontrol panelinde Bollinger Bantlarının kırılmalarını ve dokunuşlarını görebilirsiniz. Parametrelerde istediğiniz para birimini ve zaman dilimlerini belirleyebilirsiniz. Gösterge ayrıca fiyat Bollinger Bantlarına dokunduğunda, mevcut oynaklık değiştiğinde (genişlediğinde veya düştüğünde) ve fiyat tüm bantlara dokunduğunda bildirim gönderebilir. Noktalı bir hücreye tıkladığınızda bu sembol ve nokta açılacaktır. Bu MTF Tarayıcıdır.
Kontrol panelini grafikten gizlemenin anahtarı varsayılan olarak "D"dir.
Parametreler
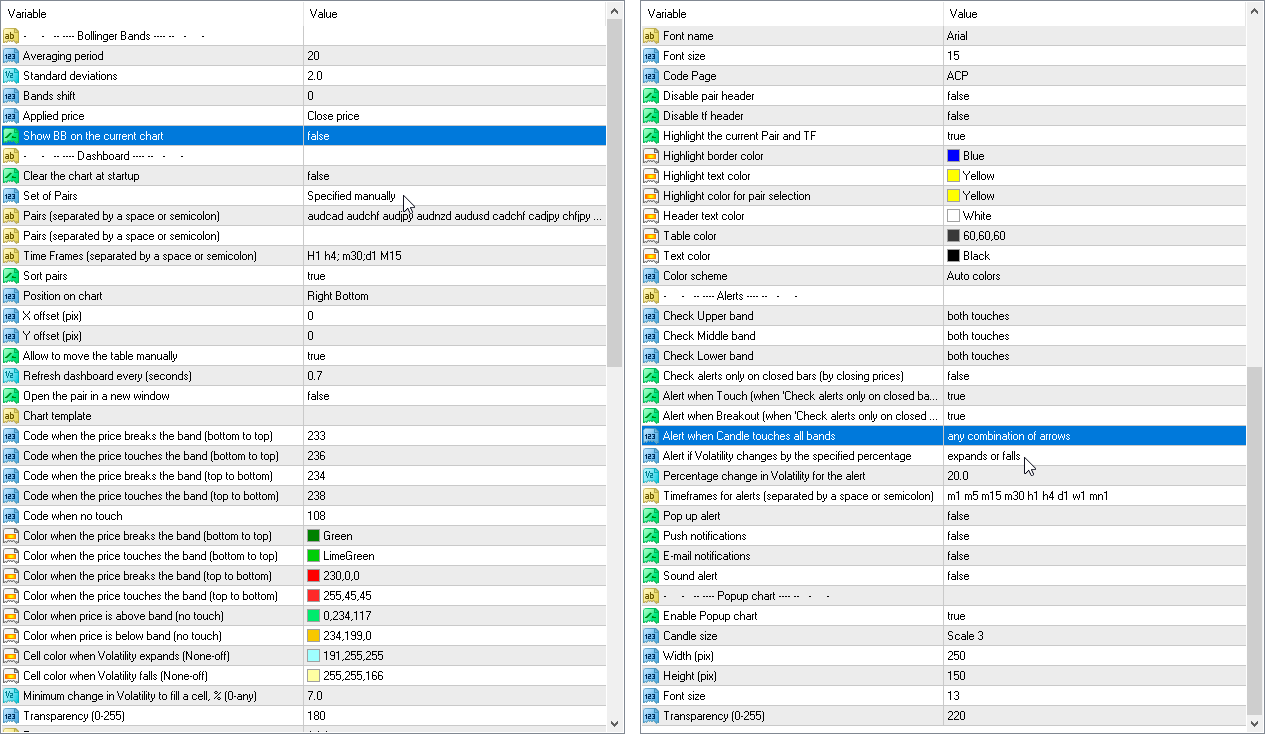
Bollinger Bands Settings
Averaging period — göstergenin hesaplanması için ortalama periyodu.
Standard deviations — ana hattan standart sapmaların sayısı.
Bands shift — fiyat grafiğine göre gösterge kayması.
Applied price — hesaplama için kullanılan fiyat.
Show BB on the current chart — Mevcut grafikte BB'yi gösterin
Gösterge Paneli
Clear the chart at startup — başlangıçta grafiği temizleyin.
Set of Pairs — semboller kümesi
— Market Watch — MT'nin "Piyasa Gözlemi"nden çiftler.— Specified manually — "Çiftler" parametrelerinde manüel olarak belirtilen çiftler.— Current pair — yalnızca geçerli çifti gösterir.
Pairs (separated by a space or semicolon) — boşluk veya noktalı virgülle ayrılmış sembollerin listesi. Para birimi adları, büyük/küçük harf ve önek/sonek korunarak tam olarak komisyoncununki gibi yazılmalıdır.
Time Frames (separated by a space or semicolon) — boşluk veya noktalı virgülle ayrılmış zaman dilimlerinin listesi (çoklu zaman dilimi).
Sort pairs — çiftlerin listesini sıralama.
Position on chart — panelin grafikte görüntüleneceği köşe.
X offset (pix) — paneli X ekseni boyunca kaydırın;
Y offset (pix) — paneli Y ekseni boyunca kaydırın;
Refresh dashboard every (seconds) — tüm çiftler ve zaman dilimleri için güncelleme süresi.
Open the pair in a new window — tıklayarak yeni bir grafik penceresinde bir sembol açın.
Chart template — grafik yeni bir pencerede açılırsa, grafiğin şablonunun adı.
Code when touch from bottom to top (price above band) — aşağıdan yukarıya doğru dokunulduğunda ve fiyat bandın üzerinde olduğunda sembol kodu;
Code when touch from bottom to top (price below band) — aşağıdan yukarıya doğru dokunulduğunda ve fiyat bandın altında olduğunda sembol kodu;
Code when touch from top to bottom (price below band) — yukarıdan aşağıya dokunulduğunda ve fiyat bandın altında olduğunda sembol kodu;
Code when touch from top to bottom (price above band) — yukarıdan aşağıya dokunulduğunda ve fiyat bandın üzerinde olduğunda sembol kodu;
Code when no touch — dokunma olmadığında sembol kodu;
Color when touch from bottom to top (price above band) — Aşağıdan yukarıya doğru dokunulduğunda renk (bant üzerindeki fiyat);
Color when touch from bottom to top (price below band). With clrNONE it will just lighten the touch color — Aşağıdan yukarıya doğru dokunulduğunda renklenir (fiyat bandın altındadır). clrNONE ile sadece dokunma rengini açacaktır;
Color when touch from top to bottom (price below band) — Yukarıdan aşağıya dokunulduğunda renk (fiyat bandın altındadır);
Color when touch from top to bottom (price above band). With clrNONE it will just lighten the touch color — Yukarıdan aşağıya dokunulduğunda renklenir (fiyat bandın üzerindedir). clrNONE ile sadece dokunma rengini açacaktır;
Color when price is above band (no touch) — Fiyat bandın üzerinde olduğunda renk (dokunma yok);
Color when price is below band (no touch) — Fiyat bandın altında olduğunda renk (dokunma yok);
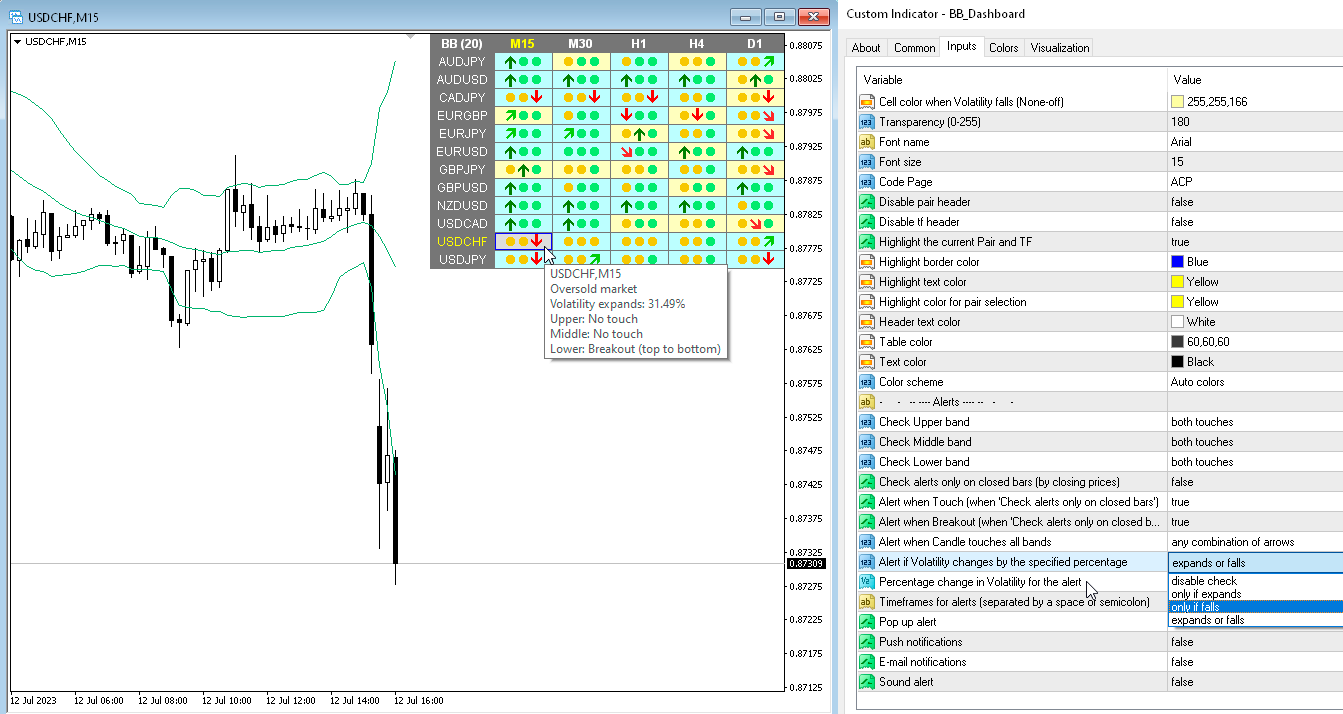
Cell color when Volatility expands (None-off) — Volatilite genişlediğinde hücre rengi (Yok-kapalı)
Cell color when Volatility falls (None-off) — Volatilite düştüğünde hücre rengi (Yok-kapalı)
Minimum change in Volatility to fill a cell, % (0-any) — Bir hücreyi doldurmak için Volatilitedeki minimum değişiklik, % (0-herhangi biri)
Transparency (0-255) — Şeffaflık (0-255);
Font name — Yazı tipi adı;
Font size — Yazı Boyutu.
Uyarılar
Check Upper band — Üst Bollinger bandını izleyin;
Check Middle band — Orta Bollinger bandını izleyin;
Check Lower band — Alt Bollinger bandını izleyin;
Check alerts only when the candle is closed — Uyarıları yalnızca mum kapalıyken kontrol edin;
— disable — devre dışı bırakmak— between Upper and Lower bands — Üst ve Alt bantlar arasında— outside Bands — Bantların dışında— any close — herhangi bir yakın
Alert when Touch (when 'Check alerts only on closed bars') — Dokunduğunda Uyarı ('Yalnızca kapalı çubuklardaki uyarıları kontrol et' olduğunda)
Alert when Breakout (when 'Check alerts only on closed bars') — Patlama olduğunda uyarı ver ('Yalnızca kapalı çubuklardaki uyarıları kontrol et' olduğunda)
Alert when Candle touches all bands — Mum tüm bantlara dokunduğunda uyarı ver
Alert if Volatility changes by the specified percentage — Volatilitenin belirtilen yüzde oranında değişmesi durumunda uyarı ver
Percentage change in Volatility for the alert — Uyarının Volatilitesindeki değişim yüzdesi
Timeframes for alerts (separated by a space or semicolon) — Uyarılara ilişkin zaman dilimleri (boşluk veya noktalı virgülle ayrılmış).
Pop up alert — Açılan uyarı;
Push notifications — Push bildirimleri;
E-mail notifications — E-posta Bildirimleri;
Sound alert — Ses Alarmi.
Açılan grafik
Enable Popup chart — Pop-up grafiğini etkinleştir
Candle size — Mum boyutu
Width (pix) — Genişlik (piks)
Height (pix) — Yükseklik (piksel)
Font size — Yazı Boyutu
Transparency (0-255) — Şeffaflık (0-255)
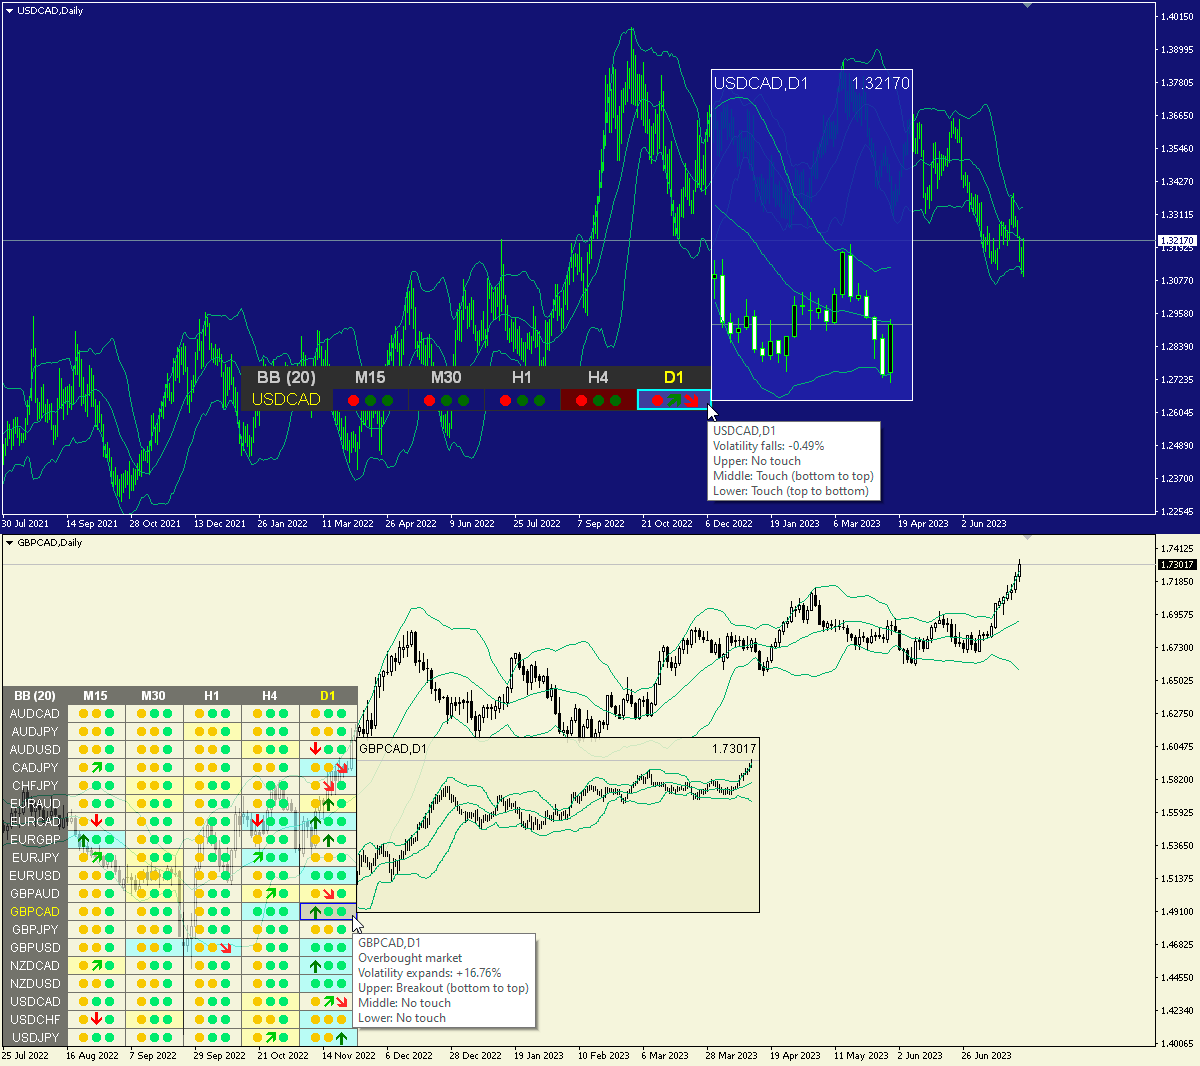
Simply stunning in every aspect. Alerts on the close of price on the time frame your trading, and alerts when price is moving before the current bar has closed. Its visual, so you know exactly what's happening, just by looking at the dashboard, and when you click on the symbol and timeframe dot, your right there at the chart. Wow