MasterDot
- Göstergeler
- Sürüm: 1.0
- Etkinleştirmeler: 20

Detect Volatility Exhaustion Before the Market Returns to Balance
Master Dot is a professional non-repainting indicator designed to detect moments when price moves beyond its statistically expected volatility range. These situations often occur during sharp market impulses, liquidity grabs or temporary emotional moves, when price departs from its normal trading conditions.
Instead of following trends, Master Dot highlights volatility exhaustion — moments where the market has expanded beyond its adaptive channel and may begin returning toward its normal equilibrium. This makes the indicator particularly suitable for scalping and other short-term trading approaches that focus on price reactions after extreme movements.
The adaptive channel is built around a moving average, while its width is calculated from either Average True Range (ATR) or Standard Deviation, allowing the indicator to automatically adjust to changing market volatility.
Real-Time Signals Without Repainting
Master Dot is designed for live trading conditions.
Unlike many reversal indicators, arrows are plotted immediately on the current (zero) bar as soon as the breakout conditions are satisfied. Previously generated signals never repaint or disappear, allowing traders to evaluate historical signals exactly as they originally appeared.
To reduce unnecessary noise, the algorithm avoids duplicate signals in the same direction, allows a configurable pause between consecutive signals and intelligently resolves situations where both channel boundaries are exceeded within a single candle.
Instant Notifications
Every new signal can be delivered immediately through Push Notifications, Email or standard MetaTrader alerts. Each notification includes the trading symbol, timeframe, signal direction, price and signal time, allowing traders to monitor multiple charts without constantly watching the terminal.
Input Parameters
Master Dot provides flexible settings for different trading styles without making the interface unnecessarily complicated.
- Channel Period defines the calculation period of the adaptive channel. Larger values create a smoother channel with fewer signals.
- Channel Center Method selects the moving average used as the channel center (EMA, SMA, SMMA or LWMA).
- Applied Price specifies which price is used for channel calculations, including Close, Open, High, Low, Median, Typical or Weighted Price.
- Channel Width Source chooses how market volatility is measured: Average True Range (ATR) or Standard Deviation.
- Channel Width Multiplier controls the channel width. Lower values produce more frequent signals, while higher values require stronger volatility expansion before a breakout is detected.
- Volatility Smoothing Period smooths the volatility calculation to create a more stable adaptive channel.
- Use Bar Extremes For Breakout determines whether breakouts are detected using candle High/Low or only the Close price.
- Minimum Bars Between Signals prevents multiple nearby signals by specifying the minimum number of bars required before another signal can be generated.
- Send Push Notification, Send Email Notification and Show Screen Alert enable the available notification methods.
- Upper Arrow Symbol, Lower Arrow Symbol, Arrow Colors and Arrow Offset allow complete customization of the indicator's visual appearance.
Signal Interpretation
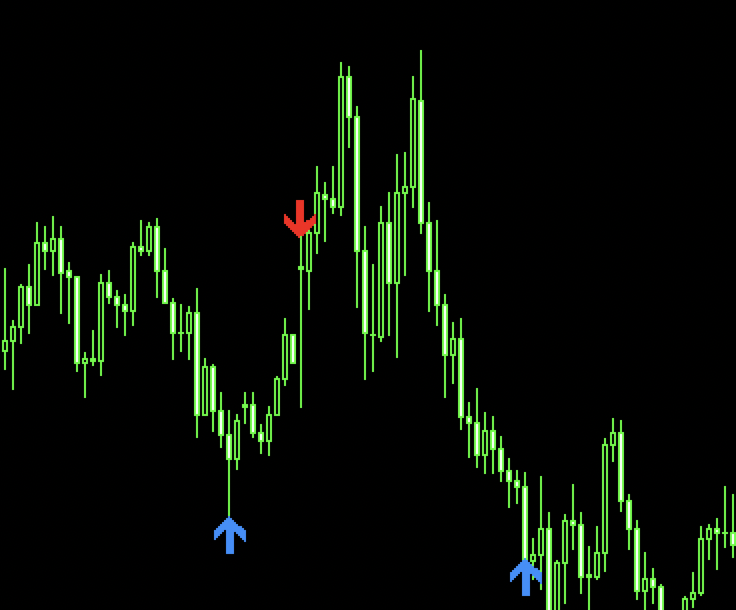
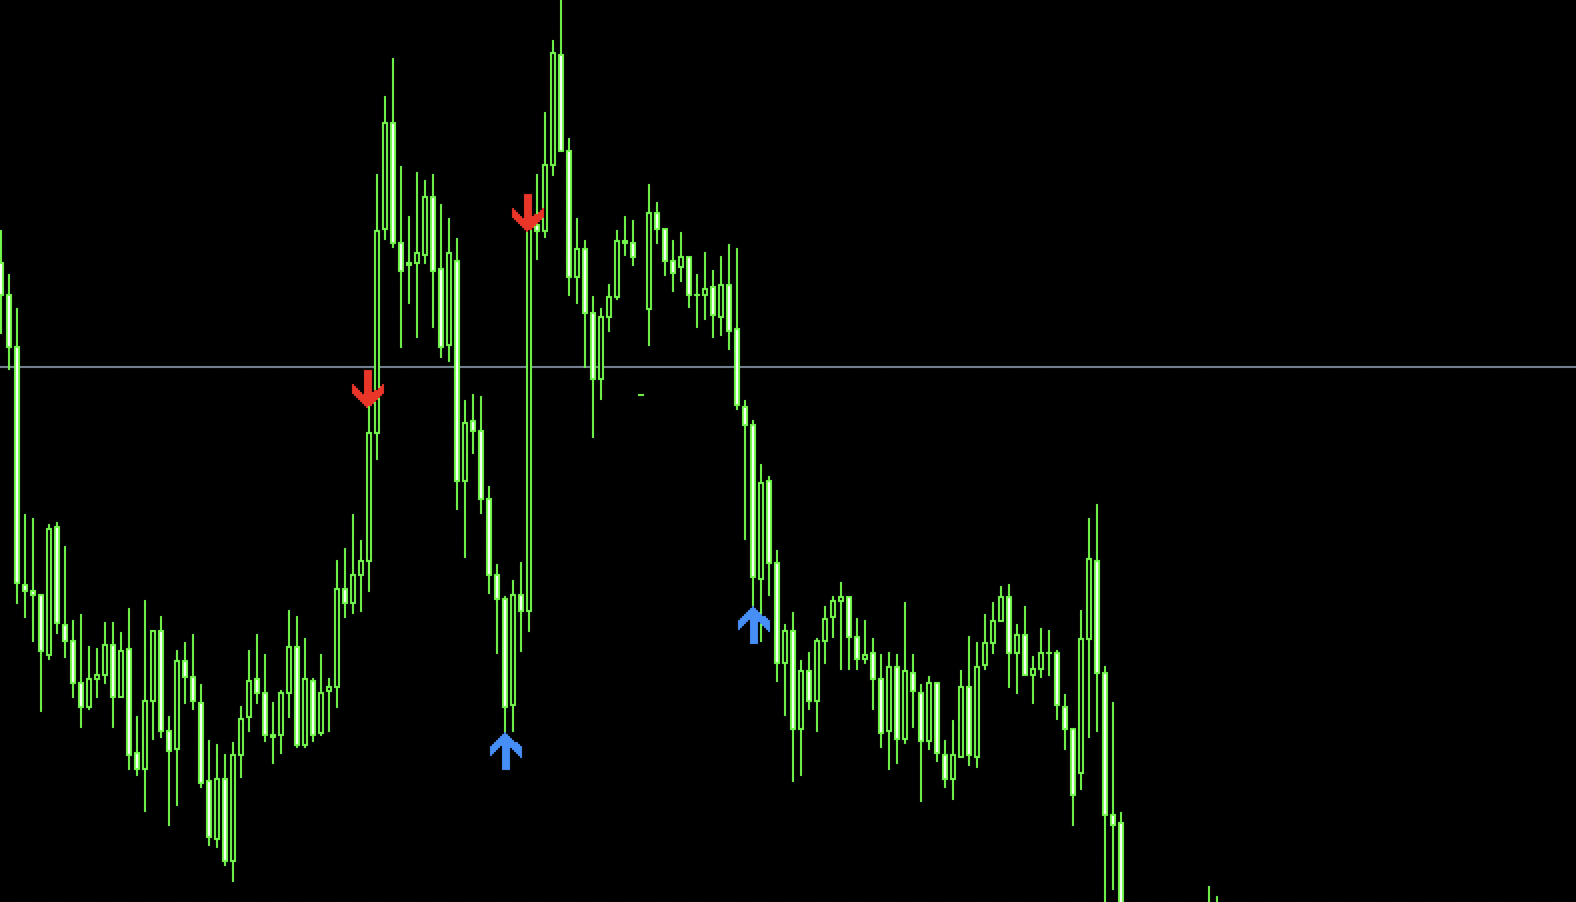
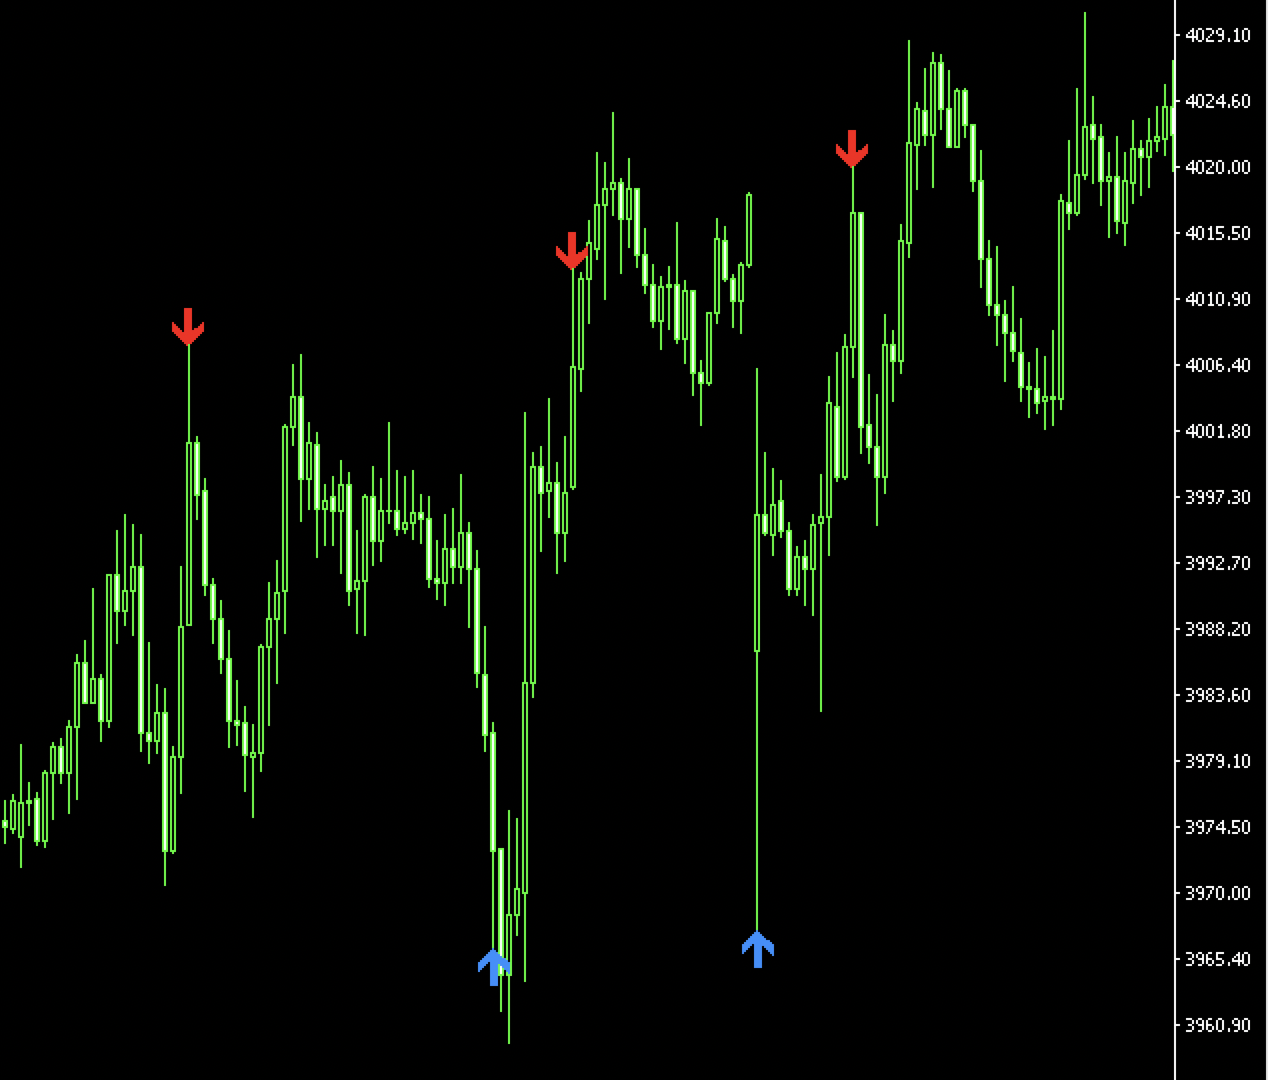
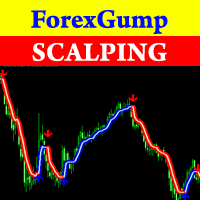
A red arrow appears when price breaks above the upper volatility boundary, indicating an upward volatility expansion.
A blue arrow appears when price breaks below the lower volatility boundary, indicating a downward volatility expansion.
Master Dot does not attempt to predict future price direction. Instead, it identifies statistically significant volatility excursions that may be useful for monitoring potential market normalization, especially when combined with a broader trading strategy and additional technical analysis.