Fractals Dashboard MT4
- Göstergeler
- Sürüm: 4.50
- Güncellendi: 19 Temmuz 2026
- Etkinleştirmeler: 10

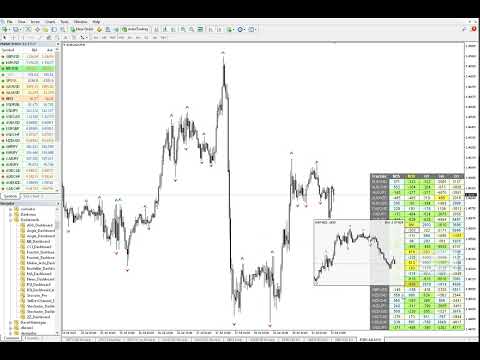
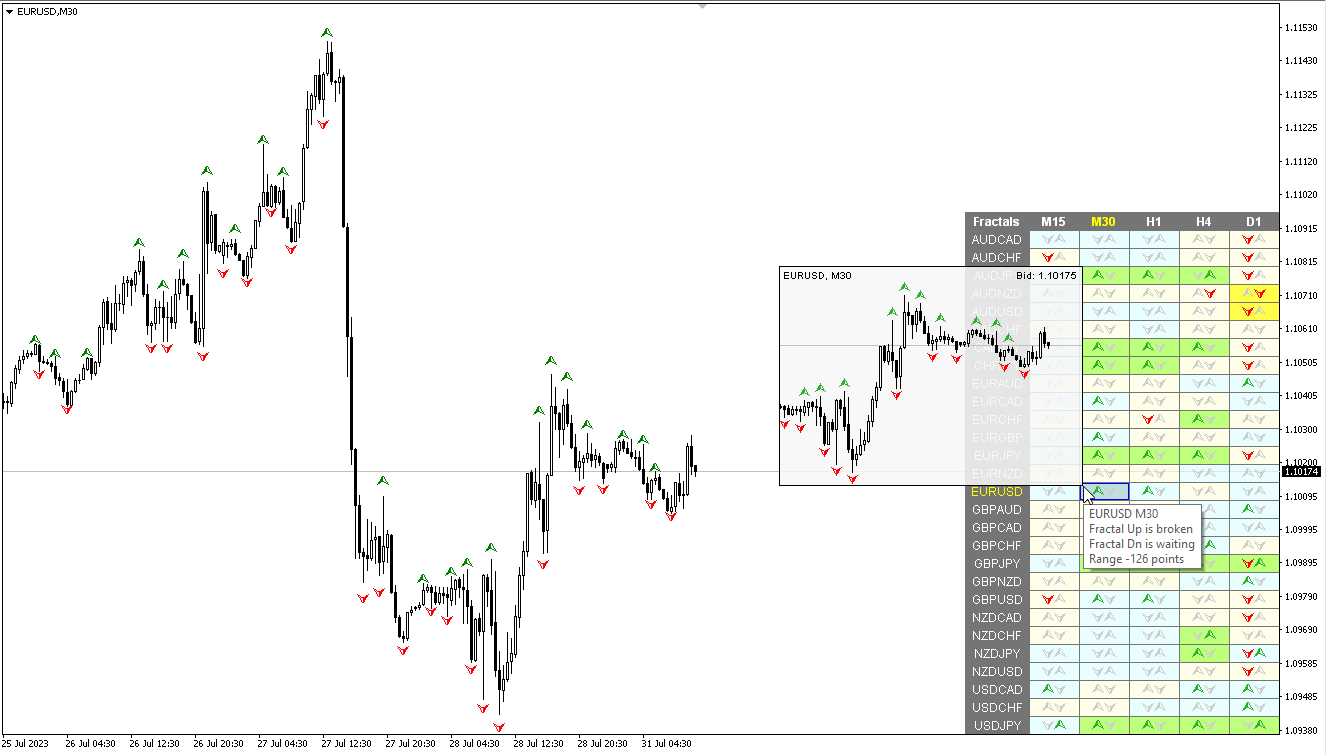
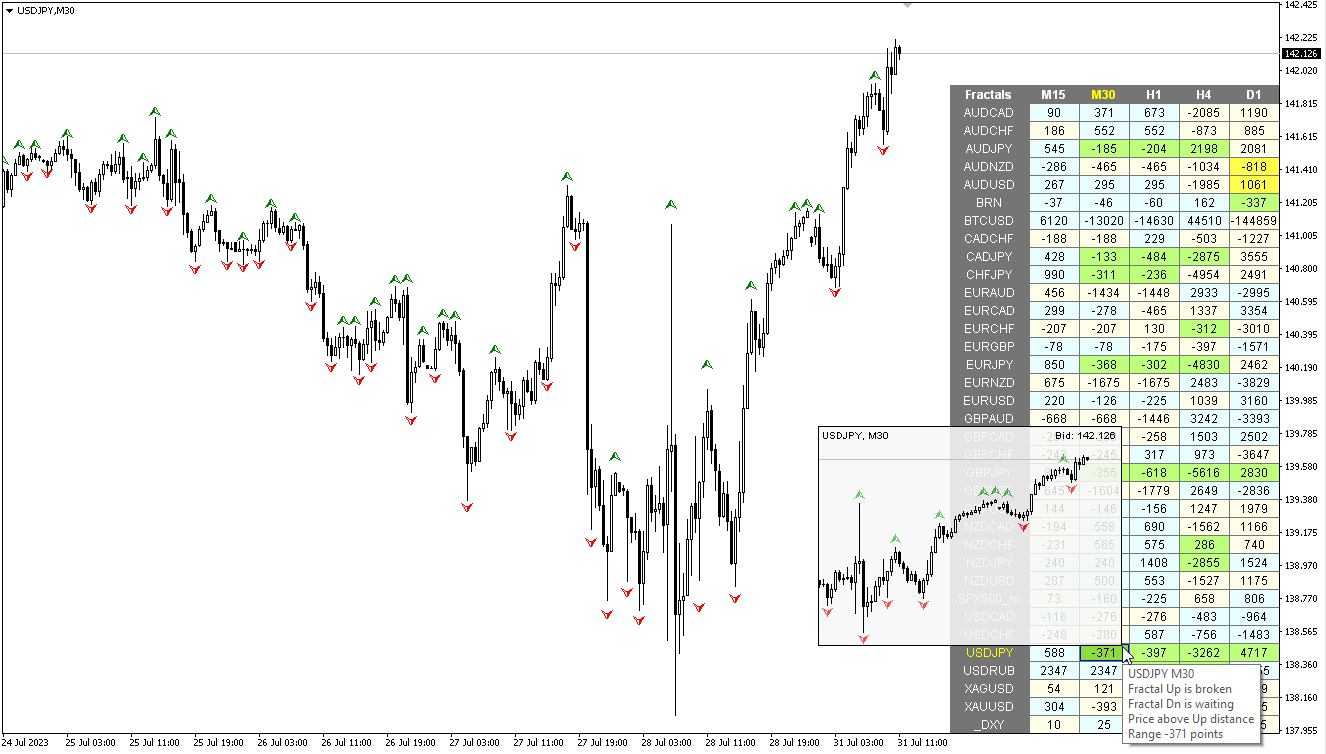
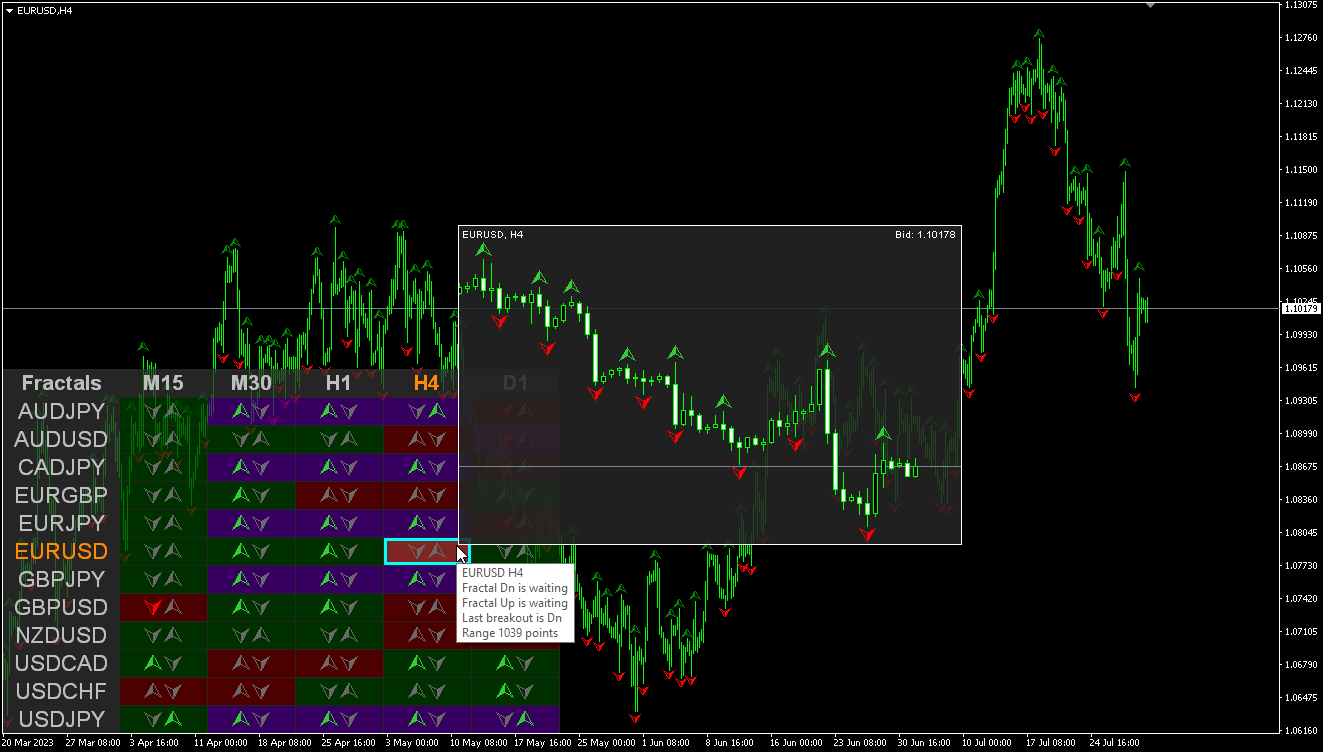
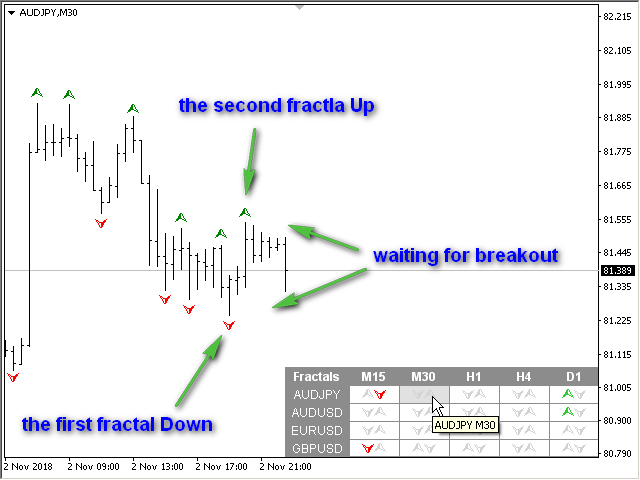
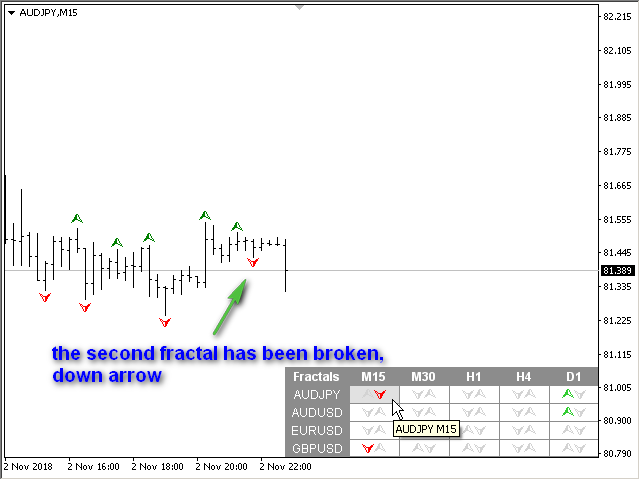
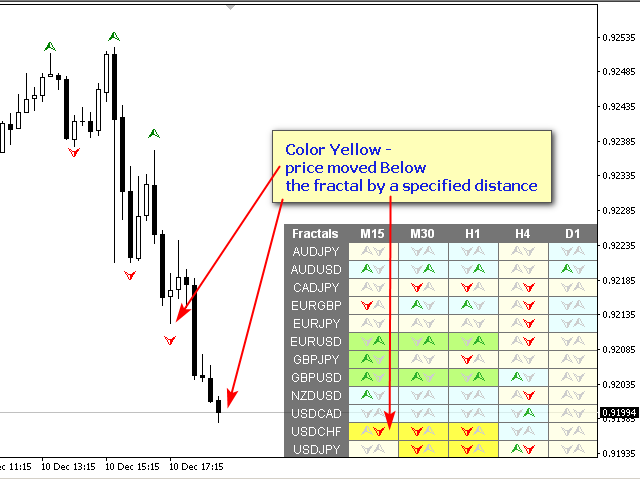
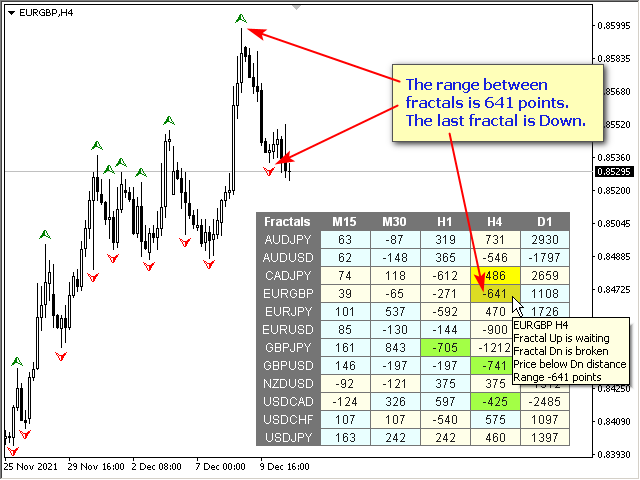
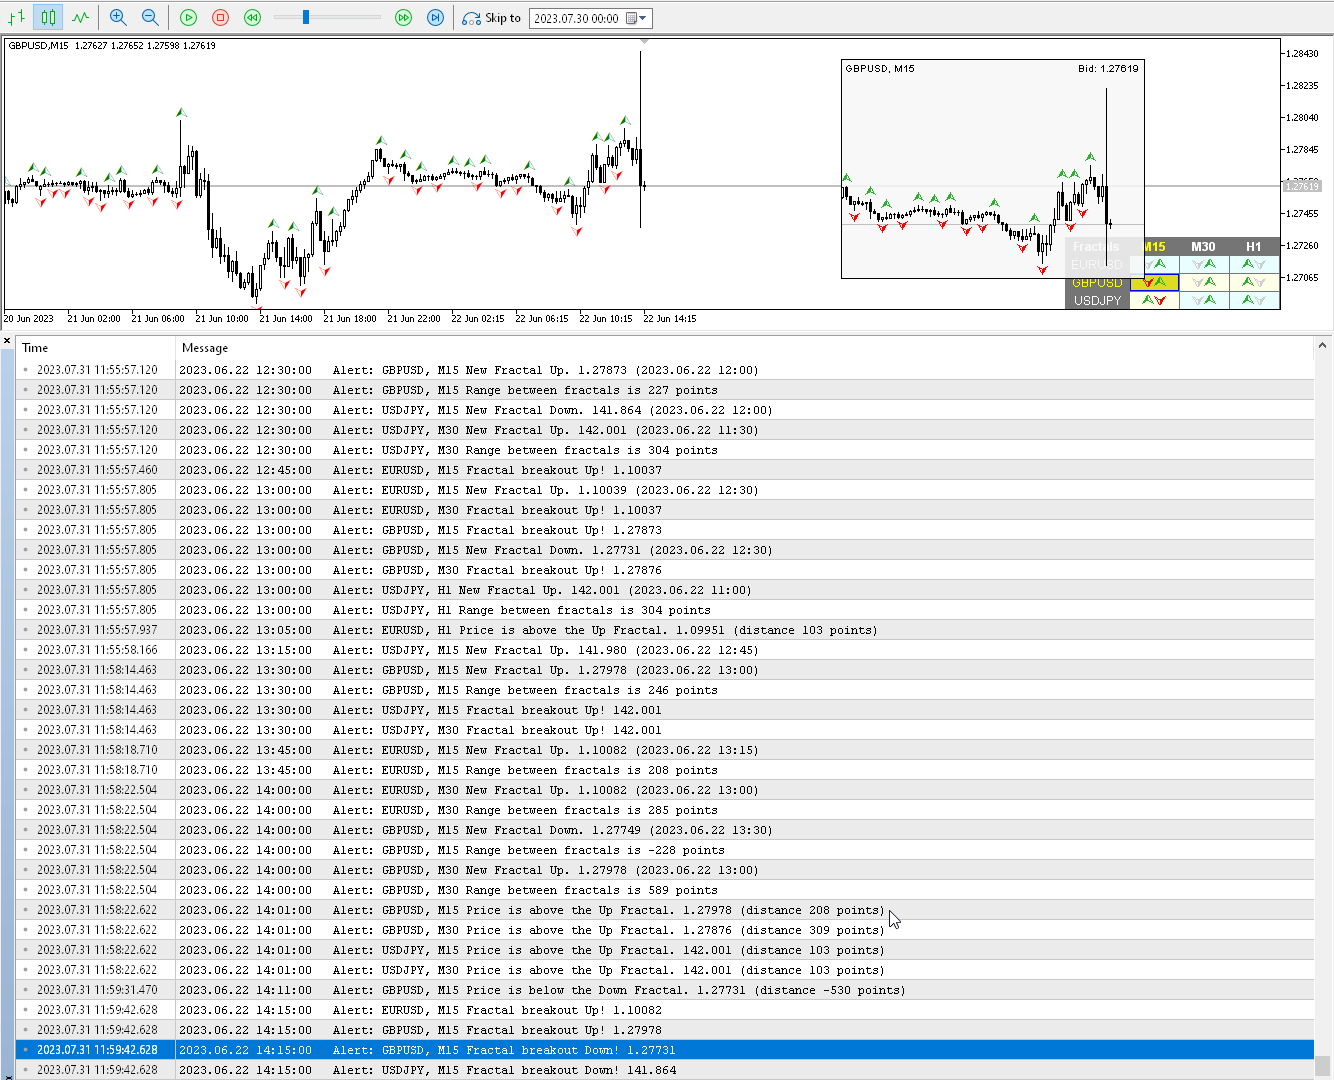
Fraktallar göstergesinin çoklu para birimi ve çoklu zaman çerçevesi modifikasyonu. Son iki fraktalın sırasını (ve hangisinin bozuk olduğunu) veya aralarındaki mesafeyi görüntüler. Parametrelerde istediğiniz para birimini ve zaman dilimlerini belirtebilirsiniz. Ayrıca panel, bir fraktalın kırılmasıyla ilgili bildirimler gönderebilir. Noktalı bir hücreye tıkladığınızda bu sembol ve nokta açılacaktır. Bu MTF Tarayıcıdır.
Kontrol panelini grafikten gizlemenin anahtarı varsayılan olarak "D"dir
Parametreler
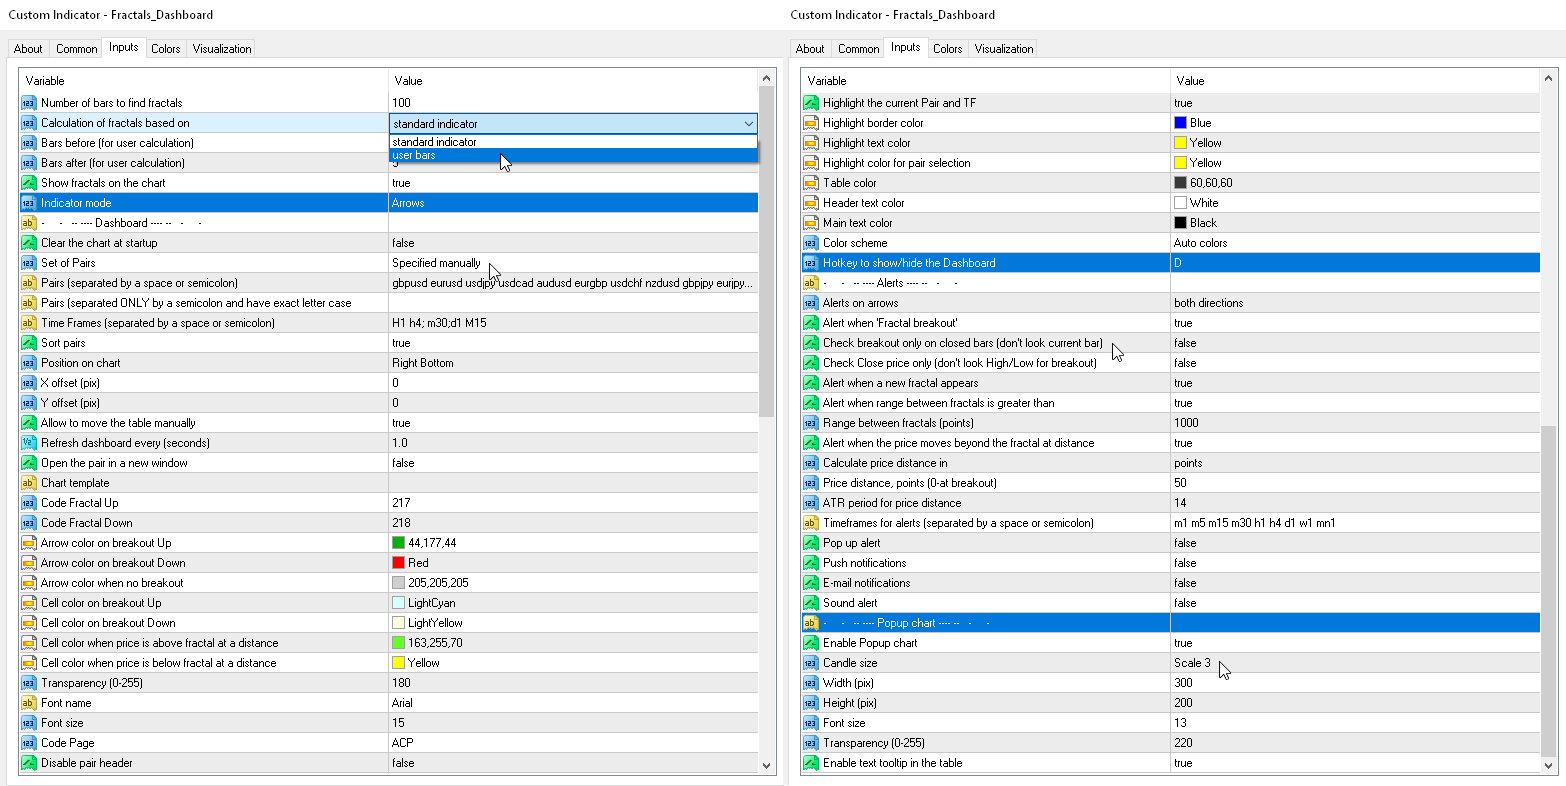
Calculation of fractals based on — fraktal arama moduna:
— standart indicator — standart göstergeye göre;— user bars — özel çubukların sayısına göre (ayarlanabilir fraktal);
Bars before (user calc) — fraktaldan önceki çubukların sayısı;
Bars after (user calc) — fraktaldan sonraki çubukların sayısı
Indicator mode — ekran modları
— Arrows — fraktalların son iki oku;— Distance — son iki fraktal arasındaki mesafe;
Show fractals on the chart — mevcut fraktalları grafikte gösterin;
Clear the chart at startup — başlangıçta grafiği temizleyin.
Set of Pairs — semboller kümesi
— Market Watch — MT'nin "Piyasa Gözlemi"nden çiftler.— Specified manually — "Çiftler" parametrelerinde manüel olarak belirtilen çiftler.— Current pair — yalnızca geçerli çifti gösterir.
Pairs (separated by a space or semicolon) — boşluk veya noktalı virgülle ayrılmış sembollerin listesi. Para birimi adları, büyük/küçük harf ve önek/sonek korunarak tam olarak komisyoncununki gibi yazılmalıdır.
Time Frames (separated by a space or semicolon) — boşluk veya noktalı virgülle ayrılmış zaman dilimlerinin listesi (çoklu zaman dilimi).
Sort pairs — çiftlerin listesini sıralama.
Position on chart — panelin grafikte görüntüleneceği köşe.
X offset (pix) — paneli X ekseni boyunca kaydırın;
Y offset (pix) — paneli Y ekseni boyunca kaydırın;
Refresh dashboard every (seconds) — tüm çiftler ve zaman dilimleri için güncelleme süresi.
Open the pair in a new window — tıklayarak yeni bir grafik penceresinde bir sembol açın.
Chart template — grafik yeni bir pencerede açılırsa, grafiğin şablonunun adı.
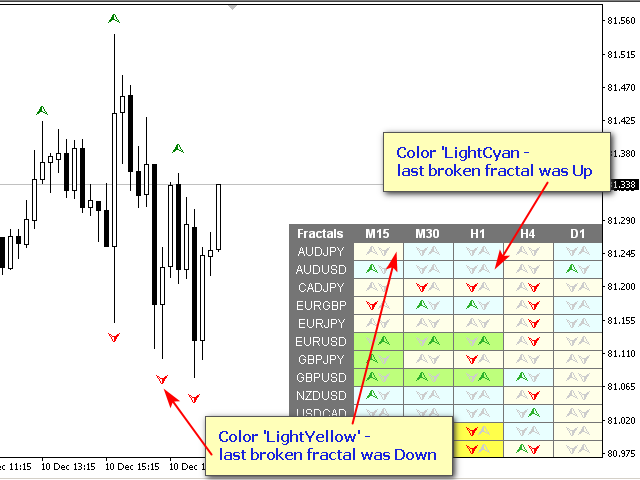
Color Up — kopuşta yukarı ok rengi.
Color Down — kopuşta aşağı ok rengi.
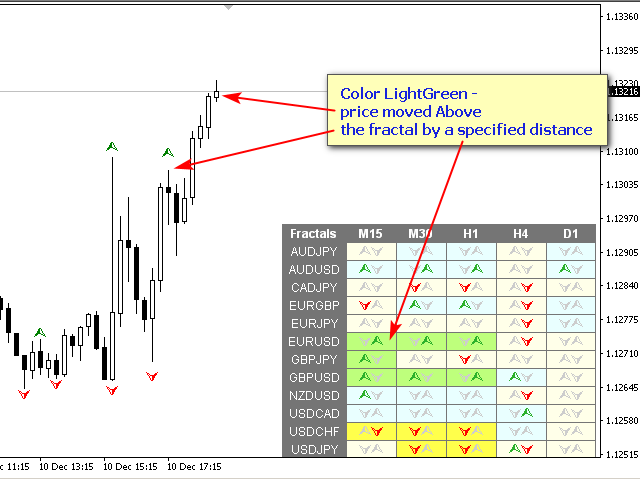
Color Stop — ilerlemesiz ok rengi.
Transparency (0-255) — panelin şeffaflığı.
Font name — yazı tipi adı.
Font size — yazı tipi boyutu.
Code Page — kod sayfasını değiştirin. Paneldeki karakterler hatalı görüntüleniyorsa diğer kodlamaları deneyin (örn. ACP veya UTF7);
Uyarılar
Alert when a new fractal appears — yeni bir fraktal göründüğünde uyarı gönder;
Alert when 'Fractal breakout' — fiyat son fraktalı geçtiğinde bir uyarı gönderin;
Check breakout only on closed bars (don't look current bar) — fraktal dökümü yalnızca kapalı çubuklarda kontrol edin;
Check Close price only (don't look High/Low for breakout) — Fraktalın kırılmasını belirlemek için yalnızca çubuğun kapanış fiyatı dikkate alınacaktır.
Alert when distance between fractals is greater than — Fraktallar arasındaki mesafe Mesafe'den büyükse veya Mesafe'ye eşitse bir uyarı gönderin.
Distance (points) — fraktallar arasındaki mesafe.
Timeframes for alerts (separated by a space or semicolon) — uyarının gönderileceği dönemlerin listesi (boşluk veya noktalı virgülle ayrılmış olarak).
Pop up alert — açılır pencere uyarısı.
Push notifications — anında bildirim.
E-mail notifications — e-posta bildirimi.
Sound alert — sesli uyarı.
Одни из самых лучших продуктов в маркете! Ничего не глючит, не тормозит. Лучшая поддержка от разработчика! Спасибо Вам за ваши труды!