Bollinger Bands Dashboard MT4
- 지표
- 버전: 4.0
- 업데이트됨: 19 7월 2026
- 활성화: 10

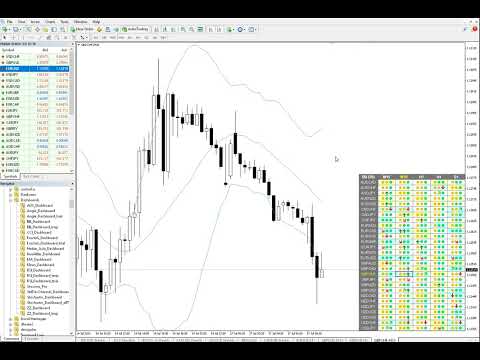
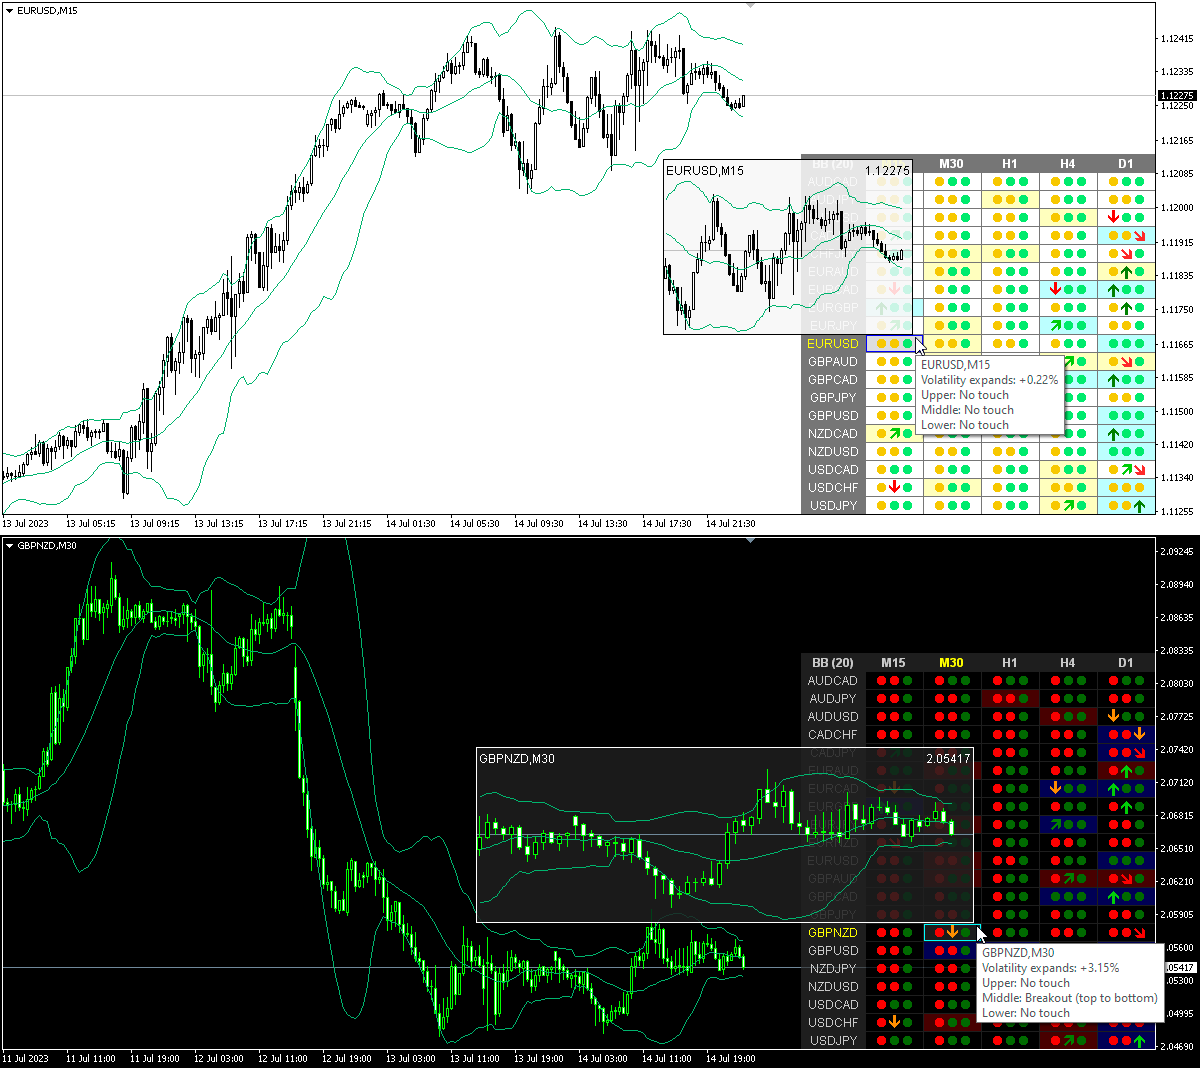
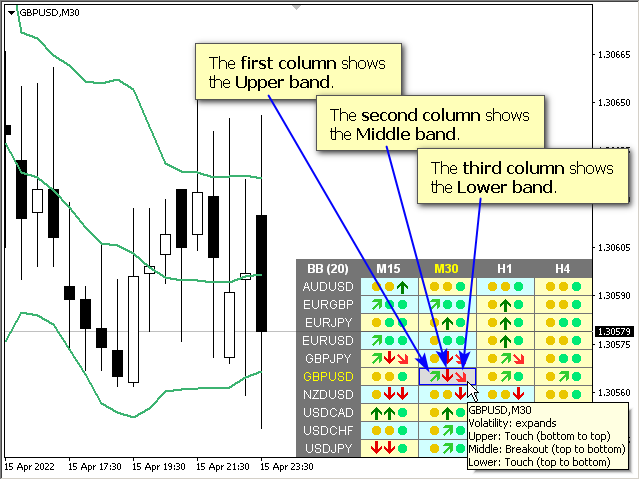
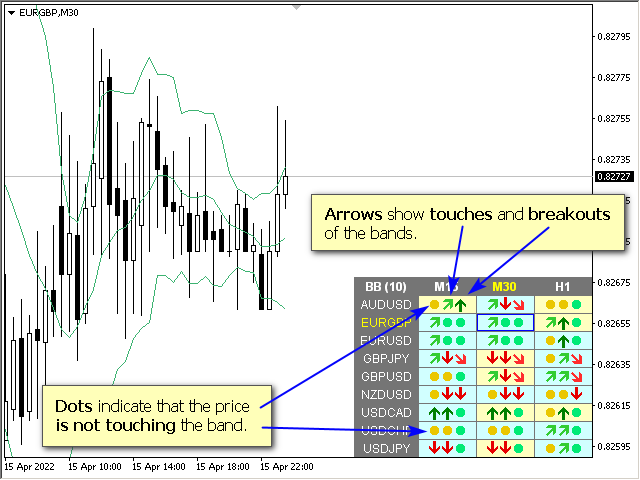
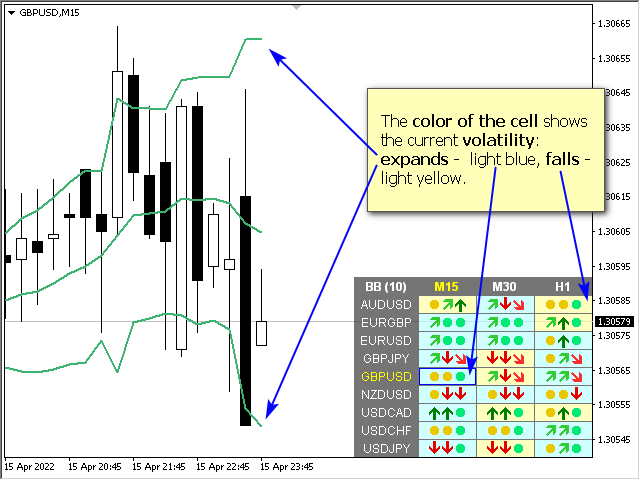
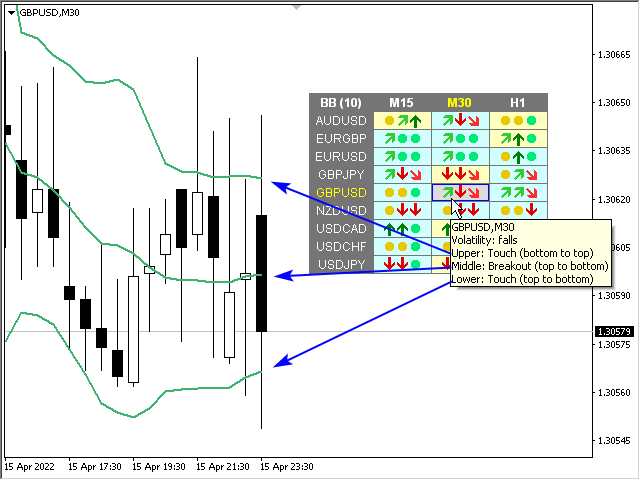
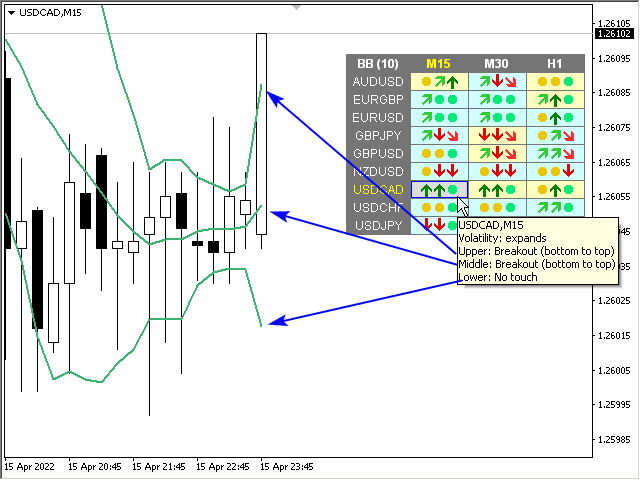
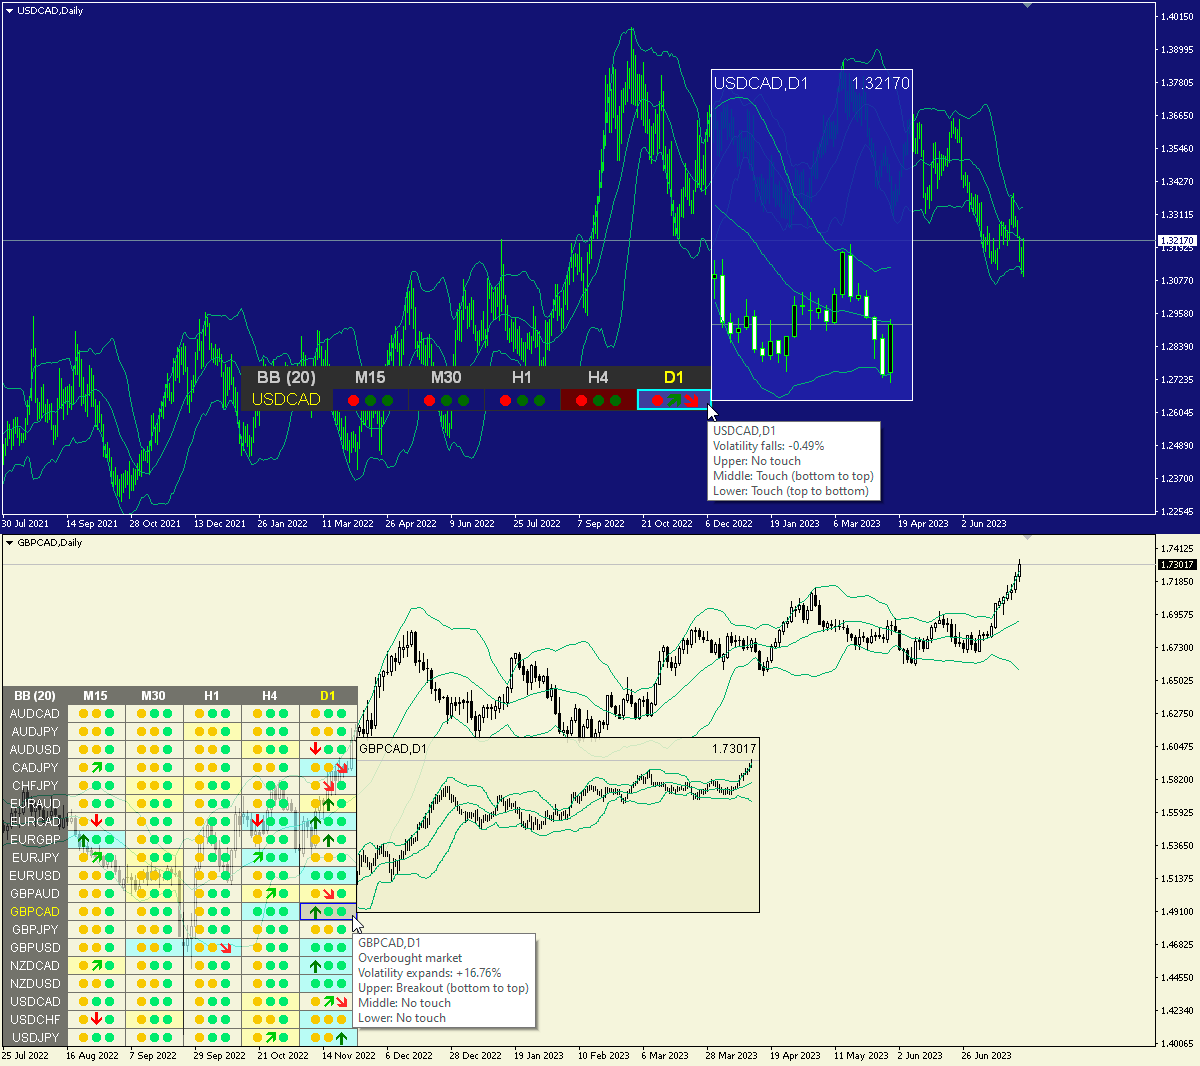
Multicurrency and multitimeframe modification of the indicator Bollinger Bands. On the dashboard you can see breakouts and touches of the Bollinger Bands. In the parameters you can specify any desired currencies and timeframes. The indicator can also send notifications when the price touches the Bollinger Bands, when the current volatility changes (expands or falls), and when the price touches all the bands. By clicking on a cell with a period, this symbol and period will be opened. This is MTF Scanner — BB Dashboard.
The key to hide the dashboard from the chart is "D" by defaultParameters
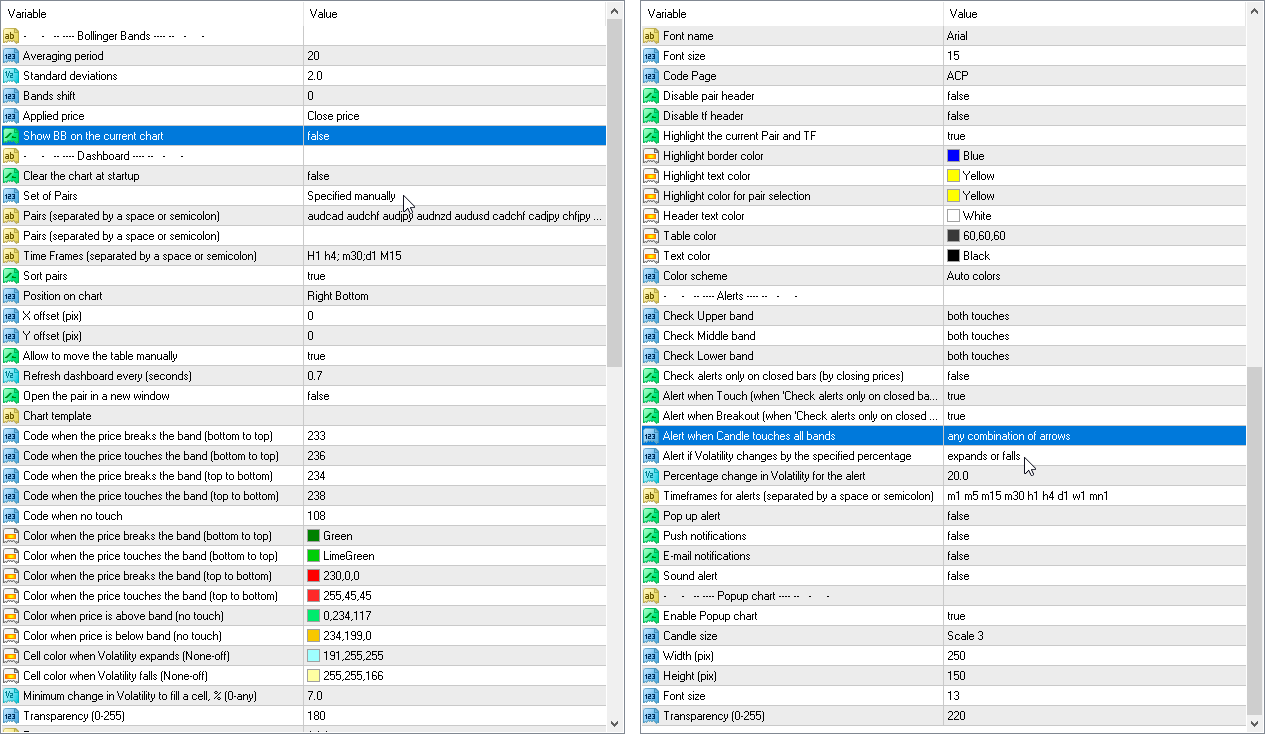
Standard deviations — number of standard deviations from the main line.
Bands shift — indicator shift relative to the price chart.
Applied price — price used for calculation.
Show BB on the current chart
Set of Pairs — set of symbols
— Market Watch — pairs from the "Market Watch".— Specified manually — pairs specified manually, in the parameters "Pairs".— Current pair — show only the current pair.
Time Frames (separated by a space or semicolon) — list of timeframes separated by spaces or semicolons (multi timeframe).
Sort pairs — sorting the list of pairs.
Position on chart — corner to display the panel on the chart.
X offset (pix) — shift the panel along the X axis;
Y offset (pix) — shift the panel along the Y axis;
Refresh dashboard every (seconds) — update period for all pairs and timeframes.
Open the pair in a new window — open a symbol in a new chart window by clicking.
Chart template — the name of the template for the chart, if the chart opens in a new window.
Code when touch from bottom to top (price above band) — symbol code when touched from bottom to top and the price is above the band;
Code when touch from bottom to top (price below band) — symbol code when touched from bottom to top and the price is below the band;
Code when touch from top to bottom (price below band) — symbol code when touched from top to bottom and the price is below the band;
Code when touch from top to bottom (price above band) — symbol code when touched from top to bottom and the price is above the band;
Code when no touch — symbol code when there is no touch;
Color when touch from bottom to top (price above band);
Color when touch from bottom to top (price below band). With clrNONE it will just lighten the touch color;
Color when touch from top to bottom (price below band);
Color when touch from top to bottom (price above band). With clrNONE it will just lighten the touch color;
Color when price is above band (no touch);
Color when price is below band (no touch);
Font name;
Font size.
Check Upper band — track the Upper Bollinger band;
Check Middle band — track the Middle Bollinger band;
Check Lower band — track the Lower Bollinger band;
Check alerts only when the candle is closed;
— disable
— between Upper and Lower bands
— outside Bands
— any close
Timeframes for alerts (separated by a space or semicolon).
Pop up alert — MT alerts;
Push notifications;
E-mail notifications;
Sound alert.
Simply stunning in every aspect. Alerts on the close of price on the time frame your trading, and alerts when price is moving before the current bar has closed. Its visual, so you know exactly what's happening, just by looking at the dashboard, and when you click on the symbol and timeframe dot, your right there at the chart. Wow