Fibonacci Trend Marker
- 지표
- 버전: 1.1
- 업데이트됨: 19 8월 2025
- 활성화: 10
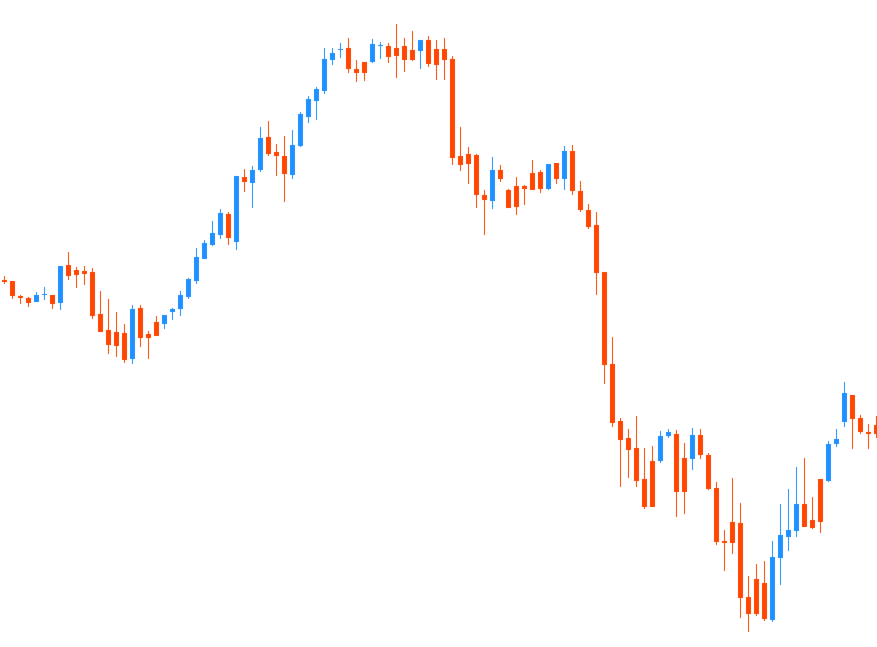
Fibonacci Trend Marker — is a trend indicator that analyzes the behavior of the current candle relative to the High-Low (HL) range of previous candles using Fibonacci retracement levels. It visually tracks trend strength, signaling potential weakening or reversal through a change in candle color.
Features:
- Designed for trend-focused traders, it helps quickly identify trend changes based on Fibonacci levels.
- Effective on any timeframe with sufficient market volatility, when a sequence of 3–5 candles forms a clear movement.
- Candle size automatically adjusts to the chart scale, ensuring proper display when zooming.
- High sensitivity to trend changes, driven by real-time analysis of the current candle, makes it ideal for scalping on M1 and M5 timeframes.
How to Trade?
Entry: Open a position after the previous closed candle changes color. For example, if a candle closes blue after a red one, it signals an uptrend—open a Buy trade.Exit: Close the position when the previous candle’s color reverses or upon reaching a target, such as 1–2 candles in the trend direction, depending on market volatility.
The color of the current (unclosed) candle may change with price quotes, which is especially useful for scalpers, allowing trades to be closed before the candle completes.
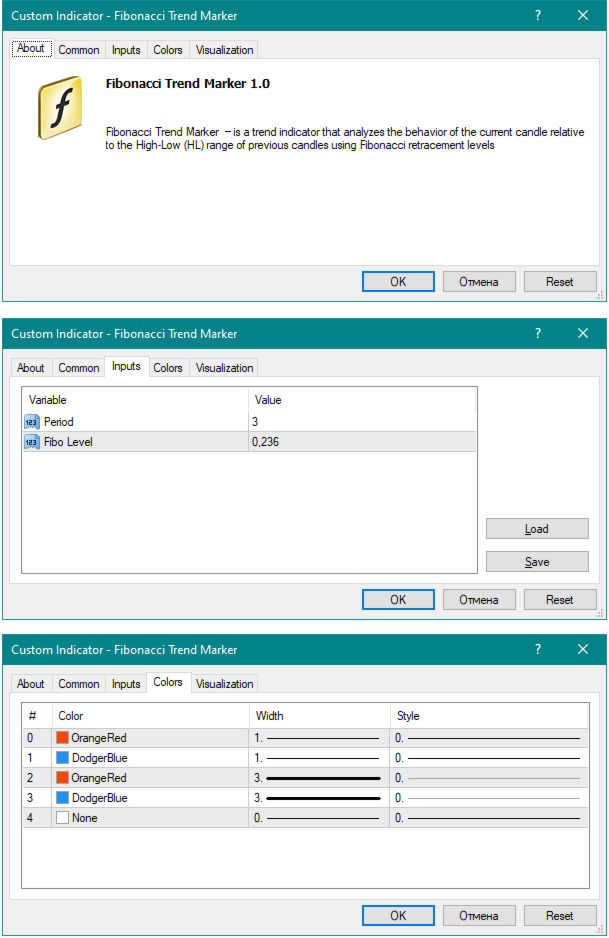
Settings:
- Period — Sets the number of previous candles for calculation (e.g., 3, 5, 10).
- Fibo Level — Defines the allowable retracement level of the current candle based on Fibonacci (0.236, 0.382, etc.). Higher values delay the trend change signal.
- Candle Color — Allows customization of colors for bullish and bearish signals.