Abiroid Auto Fibonacci Indicator

4.91

A Fibonacci indicator is best used with other indicators like Pivots, Support/Resistance etc.

Price tends to use Fibo levels as Support or Resistance lines. So, this indicator is very useful to know when price might reverse or if a level is crossed, price might continue the trend.

Also, to find the best Take Profit and StopLoss lines.

Don't use Fibo Indicator alone for trading as it might not always be accurate. Use it to make your strategies better as a supporting indicator.
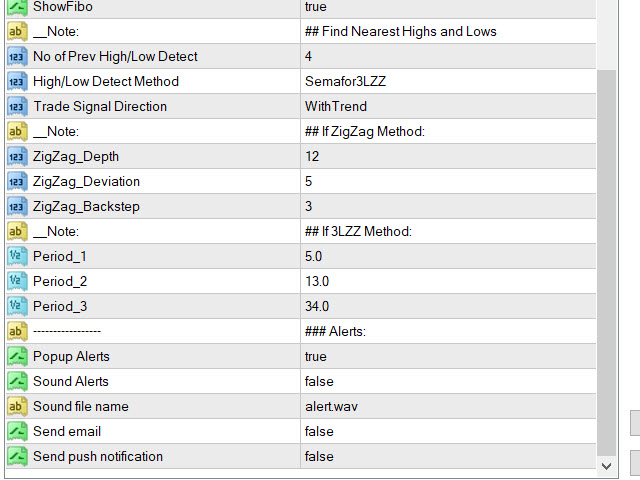

Settings:

Auto Fibo Indicator plots Fibonacci Retracements by automatically finding high and low price points using following 2 ways:

  • ZigZag
  • 3LZZ Semafor

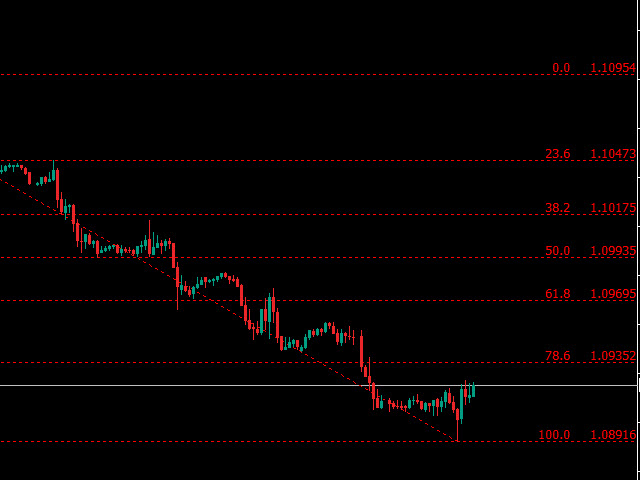
Red Fibo means current trend is bearish and Green Fibo means trend is bullish.
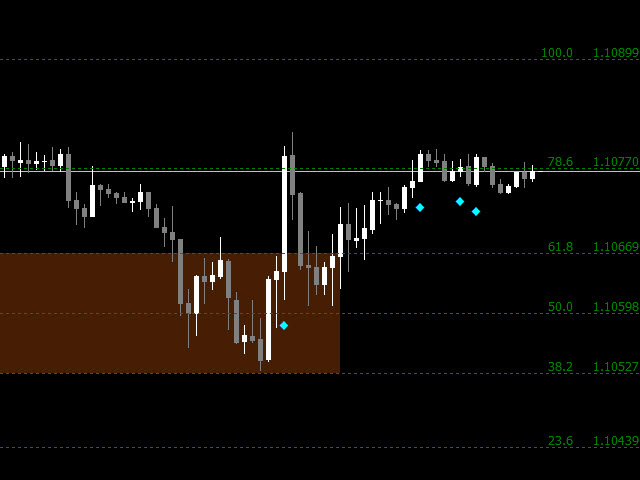

Golden Zone:

You can also specify a golden Zone: GoldenZone_Start_Percent and End_Percent

And indicator will mark Golden Zone when price enters inside it.


Show Levels:

FiboShowLevelsStr = "23.6,38.2,50,61.8,78.6"

Which Fibo Levels to Show on chart. By default 0 and 100 levels will be show. Specify all other levels you want to see as comma separated values.

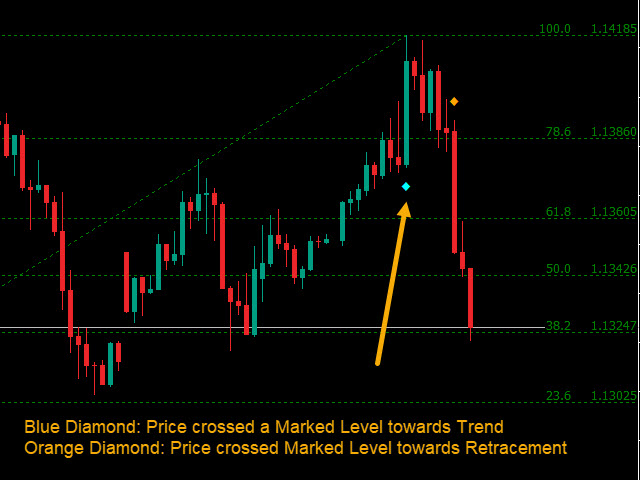
And Which Fibo Levels to Mark when price crosses that level.


Price Cross Direction:

WithTrend, WithRetracement, WithBoth


If you like to trade only Trends select WithTrend, If you want to trade retracements specify WithRetracement.

Try not to use WithBoth as that will give too many signals.


Değerlendirmeler 36
JUAN rulfo
348
JUAN rulfo 2025.12.10 08:54 
 

Hello Abir. This is an excellent indicator on H1 timeframe. Thanks in advance

TT77IRL
394
TT77IRL 2025.11.03 16:35 
 

Very handy!

Jozsef Lakatos
521
Jozsef Lakatos 2024.02.12 20:38 
 

GOOOD

Önerilen ürünler
Indicador de Fibonacci Semanal para MT4 Maximize suas operações no mercado financeiro com o Indicador de Fibonacci Semanal para MetaTrader 4 (MT4) , a ferramenta essencial para traders que buscam identificar pontos estratégicos de suporte e resistência com base na ação do preço da última semana. Principais Recursos: Atualização Automática : O indicador recalcula os níveis de Fibonacci automaticamente a cada novo candle semanal. Níveis Personalizados : Traça apenas os níveis essenciais de Fibonac
FREE
MetaTrader 4 için Akıllı Pivot Noktaları — Akıllı İşlemler için Net Seviyeler Akıllı Pivot Noktaları, MetaTrader 4 için otomatik olarak hesaplanan ve grafikte önemli işlem seviyelerinin tam bir setini gösteren profesyonel bir göstergedir. Fiyat hareketinin kaosunu net bir yapılandırılmış haritaya dönüştürerek destek, direnç, fiyat dengesi ve potansiyel hedef bölgelerini vurgular. Netliğe değer veren yatırımcılar için tasarlanan bu araç, her piyasada çalışır: Forex, kripto paralar (Bitcoin, Ethe
Fibonacci Trend Marker —  mevcut mumun önceki mumların Yüksek-Düşük (High-Low, HL) aralığına göre davranışını Fibonacci geri çekilme seviyelerini kullanarak analiz eden bir trend göstergesidir. Trendin gücünü görsel olarak takip eder ve mum renginin değişimiyle olası zayıflama veya tersine dönüş sinyalleri verir. Özellikler: Trend odaklı traderlar için tasarlanmıştır ve Fibonacci seviyelerine dayanarak trend değişikliklerini hızlıca tespit etmeye yardımcı olur. Piyasada yeterli volatilite olduğ
TradingView Style Chart Watermark Transform your MetaTrader 4 charts to look as elegant and professional as TradingView. Are you tired of the default, plain look of MetaTrader? WaterMark MT4 is a lightweight, fully customizable indicator designed to enhance your charting experience by adding sleek, modern watermarks directly to your trading terminal. This indicator bridges the visual gap between standard MetaTrader charts and premium web based charting platforms. It allows you to display the cur
FREE
Please contact me at telegram  https://t.me/smartforex7 After purchasing SmartForex Indicator then Use This Indicator...................... SMART EXIT PROFIT LINE Indicator is very Helpful with SmartForex Indicator ........................................ SMART EXIT PROFIT LINE Indicator Attach with SmartForex Indicator after then Red Line Show Exit buy Profit , Green Line show Exit Sell Profit................
FREE
Pulsar V
Dmitriq Evgenoeviz Ko
PULSAR X — Gold Market Momentum Monitoring The XAUUSD market doesn't forgive simple decisions. High volatility, false breakouts, and aggressive reactions to news make classic indicator-based strategies vulnerable. PULSAR X is a next-generation algorithmic system designed to accurately operate in market congestion and impulse exhaustion conditions. This is not a trend bot or an averaging mechanism. PULSAR X analyzes the moment when crowd pressure loses its force and the market moves from chaos t
The indicator draws trend lines based on Thomas Demark algorithm. It draws lines from different timeframes on one chart. The timeframes can be higher than or equal to the timeframe of the chart, on which the indicator is used. The indicator considers breakthrough qualifiers (if the conditions are met, an additional symbol appears in the place of the breakthrough) and draws approximate targets (target line above/below the current prices) according to Demark algorithm. Recommended timeframes for t
Dear Trader It is my pleasure to introduce to you my tool called the " Forex Sniper Indicator" . The major aim of this tool is to help serious traders and investors in all type of Financial Markets to catch price next movement right at the moment the price direction is about to change. This tool can be used to snipe the price direction in both down trend, uptrend and ranging markets. This tool can be used as the stand alone tool though it may be combined with other tools as well. My goal is to h
SR levels true mql4
Egidijus Bikulcius
5 (1)
Indicator SR levels true in small time frames is very useful for scalping while in bigger ones it is good for day or position trading. SR levels true can draw 4 support/resistance levels based on defined maximum rebouds from price level. Indicator scans  defined number of bars in time axis and defined number of pips in price axis (both sides - up and down) and calculates how much times price was rejected from scanned price levels. At the price levels where maximum rebounds are counted, support
FREE
VaviStar is an indicator based on trend retracements determined by ZigZag segments. It is theorized, and statistics confirm, that stocks react to certain retracement levels. Many use Fibonacci retracement levels (23.6%, 38.2%, 61.8%). It is assumed that once the price goes beyond the 61.8% retracement, we can already speak of a trend reversal. This indicator allows you to comfortably chart a segment of the ZigZag with the relative operating levels chosen. With a reversal mindset , you can use it
Signal Eskiya
Vitalii Zakharuk
Signal Eskiya, in addition to channel lines, reflects entry signals in the form of arrows. Trading strategies using the channel indicator belong to the classic methods of technical analysis, are easy to execute, and therefore available even to beginners. Price ranges work equally well on any trading assets and timeframes, they can be used both independently and with additional confirmation from oscillators and market volumes. American traders say: “Trend is your friend”, which means “Trend is
Pyro Trend
Oleksii Ferbei
Pyro Trend is a new product that allows you to identify the current market phase (uptrend, downtrend or flat). The indicator is applicable for any data and periods. The middle of the trend wave, as well as the edges, are places of special heat and market behavior; when writing the indicator, an attempt was made to implement precisely finding the middle. Pyro Trend is a trend indicator that uses an original calculation algorithm. This indicator paints arrows in different colors depending on the
Master Phi is an indicator based on Fibonacci numbers. It analyzes the percentage values returning the proportion of the Golden Section. You can customize values and set custom levels so you will create your personal Trading. The attention on the minimums and the maximums of timeframes allows accurate analysis in order to intercept very precisely the trading levels after the various impulse movements. Input Values Time_Frame to analyze LEVELS SETTINGS 9 levels (in percentage) 9 colors LINE SETT
The Wamek Support and Resistant (WSR) Indicator is a remarkable tool that stands out in the world of technical analysis. It sets itself apart by cleverly combining price action and leading indicators to delineate support and resistance levels with a high degree of accuracy. Its unique feature is its adaptability; users can fine-tune the indicator by adjusting input parameters, enabling them to create customized support and resistance levels that suit their trading strategies. Notably, one of WSR
Trend Divergence Indicator: Your Essential Tool for Market Analysis The Trend Divergence Indicator is a powerful tool designed to assist traders in identifying market trends and pinpointing entry points with precision. By leveraging price divergence, this indicator enhances your trading strategy, offering reliable insights and filtering unnecessary signals. Key Features and Benefits of the Trend Divergence Indicator Accurate Trend Analysis: The Trend Divergence Indicator uses price divergence t
Optimized for Asia- London- US- Open-Session  the best Features from MOMENTUM-SOLO true Momentum - time-based Indicator it's based on a self-developed candle Pattern, in relation to the ATR Filter Daytime Weekdays Moving Averages Keltner-Channel MACD Advantages Optimised for Asia- London- US- Open-Session choose your personal times to trade - select Daytime and Weekdays Keltner-Channel => to reduce market noise - sideways movement will be hidden 3x Moving Averages => for the Trend,
Max Ribbon
Stefano Frisetti
WARNING: This indicator is distributed EXCLUSIVELY on MQL5.com MT4 version:   https://www.mql5.com/it/market/product/160363 MT5 version:   https://www.mql5.com/it/market/product/160410 MAX RIBBON ver 1.00 The indicator that shows you the TREND clearly and unambiguously! DESCRIPTION MAX RIBBON is an advanced trend indicator that combines two ribbon systems to accurately identify market direction: • MaxRib2 (Fast Ribbon): Responsive to short-term movements, ideal for capturing rapid reversals an
Colored indicator of the linear channel based on the Fibonacci sequence. It is used for making trading decisions and analyzing market sentiment. The channel boundaries represent strong support/resistance levels, as they are the Fibonacci proportion levels. Users can select the number of displayed lines of channel boundaries on the chart by means of the input parameters. Attaching multiple instances of the indicator to the chart with different calculation periods leads to displaying a system of c
Pisces TheProfitZone "Pisces TheProfitZone MT4 Indicator Powered byFxGangster" This indicator will calculate new support and resistant zone everyday, and that give us a trading zone such as thats telling us TP and SL, So it still telling us for where should the price will go reach? Fore Example. Uptrend : If Price can stay upper a Line and price close higher above a Line, then the price will continue go up to reach next Line. Downtrend : If Price can't pass to stay upper a Line and the price
Super trend is one of the best trend indicators in metatrader 4 (MT4). Triple SuperTrend indicator is an indicator that consist of three super trend indicator that can be aranged. This indicator is built by mql4 language and doesn't provided by MT4 platform. Highly recommended using EMA SuperTrend Strategy Indicator if you want to get better result in here: https://www.mql5.com/en/market/product/91664 This indicator is easy to use, power full and has many benefits, there are: Using three indic
FREE
Daily Volatility Tracker is a practical and lightweight indicator designed to help traders monitor and analyze market volatility based on historical daily price movements. Whether you're a day trader, swing trader, or scalper, understanding how much a market moves per day is critical for: Choosing the right pairs to trade Setting accurate stop-loss and take-profit levels Adapting to changing market conditions MT5 Version -  https://www.mql5.com/en/market/product/134960/ Join To Learn Market Dept
FREE
MA bounce LITE arrows is simplified version of main indicator MA bounce . It's for people who don't need to use all features of main indicator. Lite version shows only arrows on chart when there is high probability of price bounce from selected MA. MA bounce LITE arrows input settings: Current MA period  - period of moving average on current TF Current     MA type   - moving average calculation method  on current TF Current     MA applied price   - applied price of moving average  on current TF
Top Movers Spotlight v1.0 See the strongest moves. Trade with confidence. Act faster. Stop wasting time flipping through charts. Top Movers Spotlight v1.0  is a powerful forex dashboard that instantly shows you: what’s moving in which direction and whether that move is actually strong Built for serious traders, this tool combines: ATR-normalized momentum multi-timeframe analysis true currency strength So you can focus only on the best opportunities — and ignore the noise. What Makes It Differe
Description A universal indicator RSI together with moving averages based on it. Depending on the need, moving averages can be disabled. You can color the indicator lines and levels: lines of RSI, moving average lines and thresholds of overbought and oversold levels.   The indicator can be calculated as the standard one on the basis of a price or as a derivative on the basis of the following eighteen other indicators included in the standard package of the MT4 terminal: AD - an indicator of accu
Indicator. Zones of support and resistance levels The most reliable tool in the hands of any technical analyst is support and resistance levels.It is these levels that magically work in the market, because the price then bounces off them, on the contrary, gaining maximum acceleration, punching them and striving for a new price point.However, in practice, many beginners face enormous difficulties in building them.This is due to the fact that the price may react quite differently to them, and ofte
FREE
The ABC Indicator analyzes the market through waves, impulses, and trends, helping identify key reversal and trend-change points. It automatically detects waves A, B, and C, along with stop-loss and take-profit levels. A reliable tool to enhance the accuracy and efficiency of your trading. This product is also available for MetaTrader 5 =>  https://www.mql5.com/en/market/product/128178 Key Features of the Indicator: 1. Wave and Trend Identification:    - Automatic detection of waves based on mov
The price is moving between two curve tunnel lines in a trend. The two lines of a tunnel represent support and resistance. In an uptrend, for instance, a trade might be entered at the support of the trend line (shown by the red line in the chart) and exited at resistance of the upper tunnel line (shown by the blue line). Tunnel show trend direction for any timeframe (if you have enough bars on the chart for higher timeframes). Trend, or price tunnel, can be up, down or sideways. If the current p
Introduction to Fractal Moving Average Fractal Moving Average indicator was designed as part of Fractal Pattern Scanner. Inside Fractal Pattern Scanner, Fractal Moving Average Indicator was implemented as multiple of chart objects. With over thousands of chart object, we find that it was not the best and efficient ways to operate the indicator. It was computationally too heavy for the indicator. Hence, we decide to implement the indicator version of Fractal Moving Average indicator to benefit o
FREE
Description: This indicator draw ZigZag Line in multiple time frame also search for Harmonic patterns before completion of the pattern. Features: Five instances of ZigZag indicators can be configured to any desired timeframe and inputs. Draw Harmonic pattern before pattern completion. Display Fibonacci retracement ratios. Configurable Fibonacci retracement ratios. Draw AB=CD based on Fibonacci retracement you define. You can define margin of error allowed in Harmonic or Fibonacci calculations
FREE
Provides instant signals on the chart in panel form. Equipped with signal description and trading analysis tools such as drawing auto trendlines, support/resistance area, regression channel, Fibonacci levels, Pivot levels and current signal price, signal time, signal expiry and stoploss recommendation. Also sending alert messages to all available mt4 alert tool. A detailed description panel provides information about where the signal comes from and what indicators are behind the signal. Includin
Bu ürünün alıcıları ayrıca şunları da satın alıyor
Neuro Poseidon MT4
Daria Rezueva
4.94 (34)
Neuro Poseidon is a new indicator by Daria Rezueva. It combines precise trading signals with adaptive TP/SL levels - creating best possible trades as a result! Message me and get  Neuro Poseidon Assistant  as a gift to automize your trading process! What makes it stand out? 1. Proven profitability on all assets and timeframes 2. Only confirmed BUY and SELL signals present on the chart 3. Adaptive TP & SL levels generated by the software for each trade 4. Easy to understand - suitable for all
Gann Made Easy
Oleg Rodin
4.84 (165)
Gann Made Easy , bay teorisini kullanarak ticaretin en iyi ilkelerine dayanan, profesyonel ve kullanımı kolay bir Forex ticaret sistemidir. WD Gann. Gösterge, Zararı Durdur ve Kâr Al Seviyeleri dahil olmak üzere doğru SATIN AL ve SAT sinyalleri sağlar. PUSH bildirimlerini kullanarak hareket halindeyken bile işlem yapabilirsiniz. Satın alma işleminden sonra, alım satım talimatlarını ve harika ek göstergeleri ücretsiz olarak almak için lütfen benimle iletişime geçin! Muhtemelen Gann ticaret yöntem
M1 Sniper
Oleg Rodin
5 (24)
M1 SNIPER kullanımı kolay bir işlem göstergesi sistemidir. M1 zaman dilimi için tasarlanmış bir ok göstergesidir. Gösterge, M1 zaman diliminde scalping için bağımsız bir sistem olarak kullanılabilir ve mevcut işlem sisteminizin bir parçası olarak kullanılabilir. Bu işlem sistemi özellikle M1'de işlem yapmak için tasarlanmış olsa da, diğer zaman dilimleriyle de kullanılabilir. Başlangıçta bu yöntemi XAUUSD ve BTCUSD ticareti için tasarladım. Ancak bu yöntemi diğer piyasalarda işlem yaparken de ya
Trend Catcher ind
Ramil Minniakhmetov
5 (2)
TREND YAKALAYICI GÖSTERGE Trend Yakalayıcı Gösterge, yazarın tescilli ve özelleştirilmiş uyarlanabilir trend analiz göstergelerinin bir kombinasyonunu kullanarak piyasa fiyat hareketlerini analiz eder. Kısa vadeli gürültüyü filtreleyerek ve temel momentum gücüne, volatilite genişlemesine ve fiyat yapısı davranışına odaklanarak gerçek piyasa yönünü belirler. Ayrıca, hareketli ortalamalar, RSI ve volatilite filtreleri gibi yumuşatma ve trend filtreleme özelleştirilmiş göstergelerinin bir kombina
Bu gösterge, pratik ticaret için mükemmel olan otomatik dalga analizine yönelik bir göstergedir! Dava... Not:   Dalga sınıflandırması için Batılı isimleri kullanmaya alışkın değilim. Tang Lun'un (Tang Zhong Shuo Zen) adlandırma kuralının etkisiyle, temel dalgayı   kalem   , ikincil dalga bandını ise   segment   olarak adlandırdım. aynı zamanda segmentin trend yönü vardır. Adlandırma   esas olarak trend segmentidir   (bu adlandırma yöntemi gelecekteki notlarda kullanılacaktır, öncelikle söyleyey
Scalper Inside PRO
Alexey Minkov
4.74 (68)
Scalper Inside PRO Scalper Inside PRO is an intraday trend and scalping indicator for MetaTrader 4 that uses an exclusive algorithm to quickly detect market direction and key target levels. It automatically calculates entry, exit and multiple profit targets, and shows detailed performance statistics so you can see how different instruments and strategies performed. This helps you choose the most suitable trading instruments for the current market conditions. Additionally, you can easily integrat
Breakout Arrows Mt4
Michael Oko Oboh
5 (1)
Trend Breakout Arrows Indicator The Trend Breakout Arrows Indicator is a momentum-based signal tool designed to identify potential bullish and bearish breakout opportunities. It displays clear arrow signals directly on the price chart, helping traders quickly recognize possible trend changes and continuation setups. Up Arrow (Buy Signal) A magenta up arrow appears below a candle when bullish momentum begins to strengthen. This signal indicates that buying pressure may be overtaking selling press
PRO Renko Sistemi, RENKO grafikleri ticareti için özel olarak tasarlanmış son derece hassas bir ticaret sistemidir. Bu, çeşitli ticaret araçlarına uygulanabilen evrensel bir sistemdir. Sistemi etkin piyasa sana doğru ters sinyallerine erişim hakkı denilen ses nötralize eder. Göstergenin kullanımı çok kolaydır ve sinyal üretiminden sorumlu tek bir parametreye sahiptir. Aracı, seçtiğiniz herhangi bir ticaret aracına ve renko çubuğunun boyutuna kolayca uyarlayabilirsiniz. Yazılımımla karlı bir
Current event:  https://c.mql5.com/1/326/A2SR2025_NoMusic.gif A. A2SR nedir ?   * Önde gelen bir teknik göstergedir (yeniden boyama yok, gecikme yok). -- Rehberlik : -- https://www.mql5.com/en/blogs/post/734748/page4#comment_16532516 adresinde -- ve https://www.mql5.com/en/users/yohana/blog A2SR, Destek (talep) ve Direnç (arz) seviyelerini belirlemede özel bir tekniğe sahiptir. İnternette gördüğümüz sıradan yoldan farklı olarak A2SR, gerçek SR seviyelerini belirlemede özgün bir konsepte sahi
Advanced Supply Demand
Bernhard Schweigert
4.91 (300)
Özel Ticaret –%30 İndirim Yeni Başlayanlar veya Uzman Yatırımcılar İçin En İyi Çözüm! Bu gösterge, bir dizi özel özellik ve yeni bir formül içerdiği için benzersiz, yüksek kaliteli ve uygun fiyatlı bir işlem aracıdır. Bu güncelleme ile çift zaman dilimi bölgeleri gösterebileceksiniz. Sadece daha yüksek bir zaman dilimini değil, hem grafik zaman dilimini hem de daha yüksek zaman dilimini gösterebileceksiniz: İÇ İÇE GEÇMİŞ BÖLGELER GÖSTERİYOR. Tüm Arz Talep yatırımcıları buna bayılacak. :) Önem
MetaBands M4
Vahidreza Heidar Gholami
3.5 (6)
MetaBands uses powerful and unique algorithms to draw channels and detect trends so that it can provide traders with potential points for entering and exiting trades. It’s a channel indicator plus a powerful trend indicator. It includes different types of channels which can be merged to create new channels simply by using the input parameters. MetaBands uses all types of alerts to notify users about market events. Features Supports most of the channel algorithms Powerful trend detection algorith
Genesis Matrix Pro is a professional multi-timeframe trend detection indicator designed to help traders identify high-quality market alignment with clarity and structure. It combines 12 different technical indicators into one visual alignment matrix, allowing traders to quickly see when market conditions are bullish, bearish, or neutral. A signal is generated only when the selected strategies are aligned, helping reduce noise and improve decision-making. PLEASE CONTACT ME AFTER PURCHASE TO GET
Bu ürün 2026 piyasası için güncellendi ve en son MT5 sürümleri için optimize edildi. FİYAT GÜNCELLEME BİLDİRİMİ: Smart Trend Trading System şu anda $99 fiyatıyla sunulmaktadır. Sonraki 30 satın alma işleminden sonra fiyat $199 olacaktır. ÖZEL TEKLİF: Smart Trend Trading System satın aldıktan sonra bana özel mesaj gönderin, Smart Universal EA’yı ÜCRETSİZ olarak alın ve Smart Trend sinyallerinizi otomatik işlemlere dönüştürün. Smart Trend Trading System, daha temiz sinyaller, daha iyi trend yönü
Dynamic Forex28 Navigator
Bernhard Schweigert
4.43 (7)
Dynamic Forex28 Navigator - Yeni Nesil Forex Ticaret Aracı. ŞU ANDA %49 İNDİRİM. Dynamic Forex28 Navigator, uzun zamandır popüler olan göstergelerimizin evrimidir ve üçünün gücünü tek bir göstergede birleştirir: Gelişmiş Döviz Gücü28 Göstergesi (695 inceleme) + Gelişmiş Döviz İMPULS ve UYARI (520 inceleme) + CS28 Kombo Sinyalleri (Bonus). Gösterge hakkında ayrıntılar https://www.mql5.com/en/blogs/post/758844 Yeni Nesil Güç Göstergesi Ne Sunuyor?  Orijinallerde sevdiğiniz her şey, şimdi yeni
BTMM State Engine Pro is a MetaTrader 4 indicator for traders who use the Beat The Market Maker approach: Asian session context, kill zone timing, level progression, peak formation detection, and a multi-pair scanner from a single chart. It combines cycle state logic with a built-in scanner dashboard so you do not need the same tool on many charts at once. What it does Draws the Asian session range; session times can follow broker server offset or be set in inputs. Tracks level progression (L
IQ FX Gann Levels a precision trading indicator based on W.D. Gann’s square root methods . It plots real-time, non-repainting support and resistance levels to help traders confidently spot intraday and scalping opportunities with high accuracy. William Delbert Gann (W.D. Gann) was an exceptional market analyst, whose trading technique was based on a complex blend of mathematics, geometry, astrology, and ancient mathematics which proved to be extremely accurate. Setup & Guide:  Download  MT5 Ver
PZ Swing Trading
PZ TRADING SLU
5 (3)
Protect against whipsaws: revolutionize your swing trading approach Swing Trading is the first indicator designed to detect swings in the direction of the trend and possible reversal swings. It uses the baseline swing trading approach, widely described in trading literature. The indicator studies several price and time vectors to track the aggregate trend direction and detects situations in which the market is oversold or overbought and ready to correct. [ Installation Guide | Update Guide | Tro
Neo Wave PRO
Nikolay Raykov
5 (1)
Price & Time Market Structure Indicator A professional market structure tool that analyzes waves through both price and time — not price alone. Main Description NeoWave PRO is a professional market structure indicator for MetaTrader 4 designed for traders who want to move beyond traditional one-dimensional wave tools such as ZigZag, swing indicators, and basic high/low systems. Most wave indicators analyze only one thing: Price. But a real market wave is not only a price movement. A true wave de
GOLD Impulse with Alert
Bernhard Schweigert
4.67 (12)
Bu gösterge, 2 ürünümüz Advanced Currency IMPULSE with ALERT  +   Currency Strength Exotics  'in süper bir kombinasyonudur. Tüm zaman dilimleri için çalışır ve 8 ana para birimi artı bir Sembol için grafiksel olarak güç veya zayıflık dürtüsünü gösterir! Bu Gösterge, Altın, Egzotik Çiftler, Emtialar, Endeksler veya Vadeli İşlemler gibi herhangi bir sembol için para birimi gücü ivmesini göstermek için uzmanlaşmıştır. Türünün ilk örneğidir, Altın, Gümüş, Petrol, DAX, US30, MXN, TRY, CNH vb. içi
Market Structure Order Block Dashboard MT4, piyasa yapısını ve fiyatın ana tepki bölgelerini doğrudan grafikte okumak isteyen yatırımcılar için tasarlanmış bir MetaTrader 4 göstergesidir. BOS, ChoCH, Order Blocks, Fair Value Gaps (FVG), Likidite, Kill Zones, Volume Profile ve hızlı analiz için kompakt bir gösterge panelini birleştirir. Bu gösterge, piyasa yapısı, ICT ve Smart Money kavramlarını karar çerçevesi olarak kullanan yatırımcılara yöneliktir. Trend devamlarını, olası dönüşleri, fiyat de
" Dynamic Scalper System " göstergesi, trend dalgaları içinde işlem yapmak için scalping yöntemi için tasarlanmıştır. Başlıca döviz çiftleri ve altın üzerinde test edilmiştir, diğer işlem araçlarıyla uyumluluğu mümkündür. Ek fiyat hareketi desteğiyle trend boyunca pozisyonların kısa vadeli açılması için sinyaller sağlar. Göstergenin prensibi. Büyük oklar trend yönünü belirler. Küçük oklar şeklinde scalping için sinyaller üreten bir algoritma trend dalgaları içinde çalışır. Kırmızı oklar yüksel
MT5 sürümü de mevcuttur https://www.mql5.com/tr/market/product/170916 M30/H1/H4 Swing versiyonu mevcut Büyük hareketleri yakalamak mı istiyorsunuz? Gold Signal Swing Pro (M30/H1/H4). Hedef: işlem başına $20-$80+. https://www.mql5.com/en/market/product/177643 KURAMA GOLD SIGNAL PRO (MT4) — 7 Katmanlı Filtre, Otomatik TP/SL ve Kalite Puanı ile Komple XAUUSD Trading Sistemi REPAINT YOK. YENİDEN ÇİZİM YOK. GECİKME YOK. H
PZ 123 Pattern
PZ TRADING SLU
1 (1)
Unlock powerful breakout opportunities The 123 Pattern is one of the most popular, powerful and flexible chart patterns. The pattern is made up of three price points: a bottom, a peak or valley, and a Fibonacci retracement between 38.2% and 71.8%. A pattern is considered valid when the price breaks beyond the last peak or valley, moment at which the indicator plots an arrow, rises an alert, and the trade can be placed. [ Installation Guide | Update Guide | Troubleshooting | FAQ | All Products  ]
Enigmera
Ivan Stefanov
5 (8)
ENIGMERA: Pazarın Kalbi Önemli: MQL5.com demosu Strategy Tester'da çalışır ve Enigmera'nın tüm işlevlerini tam olarak yansıtmayabilir. Daha fazla bilgi için açıklamayı, ekran görüntülerini ve videoyu kontrol edin. Herhangi bir sorunuz varsa, bana mesaj göndermekten çekinmeyin! Göstergenin kodu tamamen yeniden yazılmıştır. 3.0 sürümü, yeni işlevler ekler ve göstergenin başlangıcından bu yana biriken hataları giderir. Giriş Bu gösterge ve ticaret sistemi, finansal piyasalara dikkat çekici bir ya
Sismograf Marketquake Dedektörü. Description in English : https://www.mql5.com/en/market/product/113869?source=Site+Market+Product+Page#description How to use the Seismograph : https://www.mql5.com/en/market/product/113869#!tab=comments&page=2&comment=52806941 Create an EA : https://www.mql5.com/en/market/product/113869#!tab=comments&page=3&comment=52816509 Hangi şekilde işlem yaparsanız yapın, düşük likidite piyasasına girmekten kesinlikle kaçınmak istersiniz.- Sismograf, piyasa rallisin
Scalper Vault
Oleg Rodin
5 (37)
Scalper Vault , başarılı bir scalping için ihtiyacınız olan her şeyi size sağlayan profesyonel bir scalping sistemidir. Bu gösterge, forex ve ikili opsiyon tüccarları tarafından kullanılabilecek eksiksiz bir ticaret sistemidir. Önerilen zaman çerçevesi M5'tir. Sistem size trend yönünde doğru ok sinyalleri sağlar. Ayrıca size üst ve alt sinyaller ve Gann piyasa seviyeleri sağlar. Göstergeler, PUSH bildirimleri dahil her türlü uyarıyı sağlar. Göstergeyi satın aldıktan sonra lütfen benimle iletişim
Introduction to Fractal Pattern Scanner Fractal Indicator refers to the technical indicator that makes use of the fractal geometry found in the financial market. Fractal Pattern Scanner is the advanced Fractal Indicator that brings the latest trading technology after the extensive research and development work in the fractal geometry in the financial market. The most important feature in Fractal Pattern Scanner is the ability to measure the turning point probability as well as the trend probabi
Trend Lines PRO
Roman Podpora
5 (1)
TREND ÇİZGİLERİ PRO     Piyasanın gerçek yön değişimini anlamaya yardımcı olur. Gösterge, gerçek trend dönüşlerini ve büyük oyuncuların piyasaya yeniden girdiği noktaları gösterir. Anlıyorsun     BOS hatları  Daha yüksek zaman dilimlerindeki trend değişiklikleri ve önemli seviyeler, karmaşık ayarlar veya gereksiz gürültü olmadan gösterilir. Sinyaller yeniden çizilmez ve çubuk kapandıktan sonra grafikte kalır. VERSION MT 5     -    RFI LEVELS PRO  göstergesiyle birlikte kullanıldığında maksimum p
The Propfolio Master Suite is the ultimate all-in-one analytical workstation for professional traders. Combining the power of the Beat The Market Maker (BTMM) methodology, Smart Money Concepts (SND/Liquidity), and Advanced Volume Profile, this suite replaces multiple different indicators with one optimized engine. Monitor up to 14 pairs simultaneously from a single chart, instantly identify market cycles, and seamlessly map institutional footprints with the click of a button. The Command Center
RFI levels PRO
Roman Podpora
5 (1)
Bu gösterge, fiyat dönüş noktalarını ve fiyat geri dönüş bölgelerini doğru bir şekilde gösterir.       Başlıca oyuncular   . Yeni trendlerin nerede oluştuğunu görüyorsunuz ve her işlem üzerinde kontrolü elinizde tutarak, azami hassasiyetle kararlar alıyorsunuz. TREND LINES PRO   göstergesiyle birlikte kullanıldığında maksimum potansiyelini ortaya koyar.  VERSION MT5 Göstergenin gösterdiği şey: Yeni bir trendin başlangıcında aktivasyonla birlikte tersine dönüş yapıları ve tersine dönüş seviyeler
Yazarın diğer ürünleri
Read detailed blogpost with screenshots here: https://www.mql5.com/en/blogs/post/764306 Note: This is the MT5 only version. The MT4 version is available here: https://www.mql5.com/en/market/product/149941 Features Kalman smoothing to reduce market noise. Supertrend bands for trend direction. Color-coded dots and arrows for quick reading. Arrow signals for trend continuation. Alerts for trend changes. Adjustable inputs for different styles. How to Use Green dots = bullish bias. Red dots = bea
Extreme TMA System with Arrows Indicator And Buy/Sell Boxes with Take Profit & Stop Loss This is a Non-Repainting Arrows Indicator based on the Extreme TMA System. It shows TMA cross signals and the best BUY/SELL signals. Along with the most predicted TakeProfit. And StopLoss based on TakeProfit ratio. Please note: This is an Arrows only Indicator. Dashboard is sold separately here: https://www.mql5.com/en/market/product/44825 About Indicator: This indicator shows BUY/SELL Signal Arrows and
About: The Nadaraya-Watson Envelope is a sophisticated yet practical technical indicator that helps traders identify overbought and oversold conditions using advanced kernel regression methods. This is the MT5 only Version. For MT4 Version go here: https://www.mql5.com/en/market/product/158640/ Key Features ATR-Based Bands: Three upper and three lower bands provide graduated overbought/oversold zones Logarithmic Scale Calculation Center Line - bullish (teal) or bearish (red) What is the Nad
FREE
Read detailed blogpost with screenshots here: https://www.mql5.com/en/blogs/post/770947 Features at a Glance One-click symbol change across all charts simultaneously One-click timeframe change across all charts simultaneously Live trade status on every pair button — buy/sell counts, profit/loss coloring Pending order indicators shown separately on buttons Panel background color changes with your overall profit or loss Sync panel position across all charts Sync the number of buttons per row acro
FREE
3 Level ZZ Semafor Scanner: This is a Dashboard indicator which uses 3LZZ Indicator in the background to find semafors. It will give priority to the semafors3 because they specify a strong signal. So, even if there is a sem1 or 2 on current bar, and if Sem3 was within "Check Previous Bars for Sem 3". Then it will show Sem3 instead. Read about this in detailed post: https://www.mql5.com/en/blogs/post/758250 And get all extra Indicators/Template from above link. Please note: Number of settings
Check out the detailed blogpost with screenshots: https://www.mql5.com/en/blogs/post/771285 Features All trades in one subwindow — Every open BUY and SELL order gets its own mini candlestick chart, no matter what symbol it belongs to. Smart price scaling — EURUSD and BTCUSD look the same size. The indicator uses ATR normalization so every trade is equally readable. Live candle updates — The latest candle reflects the real-time Bid price, not just the last close. Entry, SL & TP lines — See exact
FREE
How To Use Check out this post for detailed description on  All Indicator extras and template: https://www.mql5.com/en/blogs/post/758259 The Best Heiken Ashi System is a simple trading system for trading based only two indicators for generate signals: Heiken ashi smoothed and Vqzz indicator multi-timeframe. The system was created for scalping and day trading but can also be configured for higher time frames. As mentioned, the trading system is simple, you get into position when the two indica
FREE
This indicator is based on Guppy's GMMA Strategy. And shows arrows when GMMA lines cross up or down. To have this indicator and get alerts for Multiple Timeframes and multiple Pairs you can check out the demo of this GMMA Trend Scanner indicator: https://www.mql5.com/en/market/product/38747 About GMMA In Brief: GMMA attempts to identify trends by combining two groups of moving averages with differing time periods: The long-term EMAs (30, 35, 40, 45, 50, and 60) the behaviors of investors that h
FREE
This is a Sharkfin Arrows Indicator. Detailed explanation and TDI extras: https://www.mql5.com/en/blogs/post/759138 This indicator will show only Arrows. It does not have TDI symbols on chart. Please get the extras from links above for TDI indicators. Sharkfin Scanner (paid): https://www.mql5.com/en/market/product/123566 TDI Scanner Dash (paid): https://www.mql5.com/en/market/product/41826 About: This Indicator finds the Shark Fin Pattern. It will show an arrow in the current bar if RSI sha
FREE
This is an MT5 only version. For MT4: https://www.mql5.com/en/market/product/162600/ Read detailed blogpost here with screenshots and best settings: https://www.mql5.com/en/blogs/post/766909 Introduction This tool takes raw, noisy price data and transforms it into smooth, easy-to-read trend lines that make market direction much clearer. Whether you’re a day trader, swing trader, or long-term position trader, this indicator can adapt to your style thanks to flexible kernel selection, adjustab
This Scanner Dashboard uses the Extreme TMA System Arrows Indicator to show good BUY/SELL signals. This Product contains dashboard only. It does not contain the Abiroid_Arrow_Extreme_TMA.ex4 indicator. Arrows indicator is not necessary for dashboard to work.  To see arrows, you can buy the arrows indicator separately if you like: https://www.mql5.com/en/market/product/44822 Dash shows Slopes for current and Higher Timeframes. - 1st diamond is current TF. Next diamonds are higher TFs (Please Not
Detailed blogpost: https://www.mql5.com/en/blogs/post/766378 Key Features Adaptive Upper/Lower bands Smooth Center Line Customizable Length (sensitivity) Non-Repainting (only current ongoing bar is updated every "Refresh After Ticks" number of ticks) Multiple Price Sources - Choose from close, open, high, low, median, typical, or weighted close Components: The Basis Line The smooth center line represents the weighted average of price. Think of this as the "true" price level when all the noise
FREE
Features: 1- Get OB/OS Levels from Golden MA Levels 2- Wait for Buy/Sell Start Level Cross 3- Optional: Should price cross Mid Level in earlier bars 4- Optional: Crossing bar High/Medium Volume 5- Optional: MA Stacked to check up/down trend for current TF 6- Optional: NRTR higher timeframes aligned Check Detailed blog post explained: https://www.mql5.com/en/blogs/post/758457 Levels with Buffers available here: Golden MA Levels Indicator: https://www.mql5.com/en/market/product/119515 Note: Arr
FREE
Description This scanner uses 3LZZ TRO ex4 and scans for Semafors at given “Shift” bar. Scanner Detailed Settings: https://www.mql5.com/en/blogs/post/747456 Other Settings: Set Periods for Semafor 1,2,3 Set alerts on/off for Semafor 1,2,3 Shift bar (Bar on which semafor is scanned) Refresh After Ticks (Number of ticks when dash is refreshed) This scanner is pretty simplistic version. And a more detailed version with a different strategy is available here: https://www.mql5.com/en/market/product
FREE
EMA Multi meter
Abir Pathak
4.92 (13)
How the Indicator Works: This is a Multi-timeframe MA multimeter indicator which studies if price is above or below a particular EMA range and shows Red/Green/Yellow signals. Red: Price Below EMA range Green: Price above range Yellow: Price within range Indicator Properties: EMA Settings: - Default Period is 200. You can change all MA Settings like Period, MA Method (SMA, EMA, etc) or MA Applied Price (Close, Open, etc). - EMA Range list is a comma separated value list for different timeframes
FREE
Abiroid Slope MA
Abir Pathak
4.67 (3)
Features: - Moving Average Slope for Max Past Bars - Slope Period - Slope Thresholds - Multiple Slope Type options - See slope visually as a histogram - Info Panel Show/Hide Slope Calculations and Types: The slope value is calculated using the Slope Period. Suppose Period is 5, it will check the MA value for bar (x) and bar (x+5). And find the slope angle between them. Read detailed description about Slope Types and Settings here: https://www.mql5.com/en/blogs/post/747651
FREE
Abiroid Multi Slope indicator allows you to calculate a Slope Histogram for any line of any indicator . Histogram is for 1 slope line only, but slope values can be calculated for 3 lines total. To have multiple histograms, add as many Slope indicators for custom indicators as you like on chart. You just need to provide the Indicator name, buffer value, slope's period and max number of bars back. By default it has slope calculation for TDI_v4.ex4 indicator. There is no way to specify parameters f
FREE
Abiroid MA Stack
Abir Pathak
4.5 (4)
Moving Average Rainbow Stack: Free: Single Currency & Single Timeframe MA Stack Very useful for finding current and higher timeframe trends. Best suited for long term trend based trading. Use fewer MAs for quick scalping. And not suitable during low volatility. Only use during high volatility and steady trending markets. Use this to enhance your existing Trend based strategies to find best trends. Read detailed description https://abiroid.com/product/abiroid-ma-stack Available MTF and Scanner v
FREE
Features: - Current TF GMMA Cross and Trend (Mandatory Check.. G-Up/G-Down) - HTF GMMA Trend Check (Optional.. slanting arrow) - TDI or NRTR Trend Check (Optional.. diamond) Read post for detailed description and downloading extra indicators: https://www.mql5.com/en/blogs/post/758264 Scanner: This is a Dashboard Scanner for finding good trades using the GMMA method as base and TDI method for trend verification. All buttons for all Pairs and Timeframes are clickable and will change the chart f
Dashboard uses Ichimoku Strategy to find best trades. Get extra Indicators/Template: And read more about detailed Product Description and usage here: https://www.mql5.com/en/blogs/post/747457 Read more about Scanner Common features in detail here: https://www.mql5.com/en/blogs/post/747456 Features: Price Kumo Breakout Tenkan-Kijun Cross Chikou/CLoud and Chikou/Price Support/Resistance (SR-SS or SR-NRTR) Stochastic OB/OS and back Awesome Oscillator Higher Timeframe Ichimoku Trend Align
TDI Multi Timeframe Scanner: This Dashboard indicator uses the TDI (Trader's Dynamic Index) Indicator to find best trades. Read detailed How to Use Guide: https://www.mql5.com/en/blogs/post/758252 Extra indicators also available in above post. Checks for: - SharkFin Pattern Free indicator for SharkFin: https://www.mql5.com/en/market/product/42405/ - TDI Trend: Strong/Weak Trend Up/Down - TDI Signal: Strong/Medium/Weak Signal for Buy/Sell - Consolidation - Overbought/Oversold - Volatility Ban
Scanner Dashboard for Best Heiken Ashi VQZZ Arrows Indicator here: https://www.mql5.com/en/market/product/45900 Check out this post for detailed description on How To Use All Indicator extras and template: https://www.mql5.com/en/blogs/post/758259 Please note that if you are using too many pairs/timeframes, then VQZZ calculations might slow down the dashboard. So be careful not to use too many VQZZ Higher timeframes if you are using too many pairs. Also, VQZZ is based on higher timeframes. e.g
Abiroid Profit Percent Series 1: Arrows Indicator Stochastic Ichimoku with ATR Get the Scanner for free. For getting Profit Percentages for Multiple Timeframes and Multiple Pairs. And read detailed description about this indicator and all the settings here. And get extra Indicators, Templates and settings for download: https://abiroid.com/product/profit-percent-stoch-ichimoku-with-atr Watch the tutorial video here: https://youtu.be/C45-9kWPE2Q About The Strategy: This strategy has 3 main par
Profit Percent Series 2 The scanner dashboard available here (for  Free) : And read detailed information about MA Confluence here: https://www.mql5.com/en/blogs/post/747474 Here's a post about Common Settings for all Profit Percent Series Indicators: https://www.mql5.com/en/blogs/post/747456 Strategy: Main Signal Indicators (Any One): MA Cross (In-built) or Hull, OBV Cross, Heiken Ashi Cross Validation Indicators (Preferably less than 3): OBV (with Min Distance), Heiken Ashi, ADX, SuperTren
This is a slope indicator for COG (Center of Gravity) indicator.   Download extra COG Indicators and read detailed description and strategy here: https://www.mql5.com/en/blogs/post/759120 Description: You can set the Slope Threshold for indicating Buy/Sell heightened levels. In the above Image the Threshold is set to 0, because of that all Bullish slope is Green and Bearish is Red. Suppose we set Threshold to -10 and 10, then this is what we get: And also set Slope Period. Default is 5, which
This Indicator uses Center of Gravity (COG) Indicator to find you the best trades. It is a reversal based Swing Indicator which contains an  Arrows Indicator. That you can buy here from Metatrader Market. Check out this blog post for detailed How to Use Guide and links to free scanner: https://www.mql5.com/en/blogs/post/758262 Scanner needs this arrows indicator in same directory to run Copy scanner ex4 in same folder as your Arrows Indicator: MQL4/Indicators/Market/ All extra indicators and
This strategy is best used for Trend based trading. While market is trending, price still makes smaller ranges. Darvas boxes show breakouts from these small ranges, while still following the original market trend. Detailed Description: https://www.mql5.com/en/blogs/post/747919 Features: Darvas - Check Darvas Box Breakout -   Check Price Above/Below MA or Darvas Box has crossed MA -   Min, Max Box Height -   Max Distance Between Entry Price and Darvas Box Other Indicators: - NRTR Trend Check
Free scanner available here: https://abiroid.com/product/abiroid-ema-scalper Basic Strategy: 1: MA Crossover Up/Down Arrow (Mandatory Check) Optional Checks: 2: If NRTR Check On (Optional): For BUY: Check if NRTR blue and For SELL: NRTR Red If NRTR Shadow Distance On (Optional): Check price for 'x' bars back: at Shadow distance (ATR Multiplier distance) from NRTR line. 3: If High Volume bar On: Check if High Volume or if Medium (if on) Volume bar 'x' bars back 4: If HTF Trend Align On (Optiona
This is a Multi-currency multi-timeframe Support/Resistance Scanner Dashboard for Metatrader 4 (MT4) platform. Get all extras and download free demo here: https://www.mql5.com/en/blogs/post/760210 Read detailed description in post above. And get the SR Indicator for individual charts. Features: Scan Support/Resistance zones (also called Supply/Demand zones) Show alert when price is inside these zones and highlights the pair/timeframe Show or hide SR zones price nearest to current price (Price
This strategy is useful for small timeframe scalping and binary options. Best timeframes: M5,M15,M30 M1 timeframe is too unpredictable. So be careful with that. Read Detailed Description and Get All: - Free Demo - Free Scanner - Extra Indicators ex4 files from https://abiroid.com/product/abiroid-donchian-scanner-and-arrows Arrows Demo only works in strategy tester. So, Arrows Demo won't work with the free scanner. Scanner needs "Abiroid Donchian Arrow.ex4" to work. So make sure both arrows and
Filtrele:
JUAN rulfo
348
JUAN rulfo 2025.12.10 08:54 
 

Hello Abir. This is an excellent indicator on H1 timeframe. Thanks in advance

Abir Pathak
53946
Geliştiriciden yanıt Abir Pathak 2025.12.11 10:57
Thanks :)
TT77IRL
394
TT77IRL 2025.11.03 16:35 
 

Very handy!

gurung7979
14
gurung7979 2024.12.10 22:03 
 

Kullanıcı değerlendirmeye herhangi bir yorum bırakmadı

Abir Pathak
53946
Geliştiriciden yanıt Abir Pathak 2024.12.10 22:05
Hi, Sorry..I don't share the source code for my products. But this has buffer values for fibo 0 and 100. You can use those buffers using iCustom. For your EA.
Jozsef Lakatos
521
Jozsef Lakatos 2024.02.12 20:38 
 

GOOOD

Ruggero Moroni
18
Ruggero Moroni 2023.11.07 16:24 
 

Hola,estoy empezando ahora con el trading y me encanta tu fibonacci. Una pregunta tienes un video donde puedo ver bien como utilizarlo a lo mejor posible? mill gracias

Abir Pathak
53946
Geliştiriciden yanıt Abir Pathak 2023.11.07 16:57
Hi,
Glad you liked it :) Sorry no video. You can read the detailed tutorial on how to use here https://abiroid.com/product/abiroid-auto-fibo-indicator/ And use it with your fav fibo strategy.
Martin Brown
813
Martin Brown 2023.02.10 14:06 
 

⭐⭐⭐⭐⭐ The "Golden Zone" has really simplified my trading. By coordinating these on the daily, 1 Hour, and 5 minute charts what once was a chaotic sea is now a peaceful lake. Thank you 😉

Abir Pathak
53946
Geliştiriciden yanıt Abir Pathak 2023.02.10 14:10
Thank you for the wonderful review :)
Torsten Wiese
48
Torsten Wiese 2022.11.08 00:12 
 

Really good tool. I use it for trading Indices.

fxpat
540
fxpat 2022.11.01 06:46 
 

Kullanıcı değerlendirmeye herhangi bir yorum bırakmadı

[Silindi] 2022.10.31 03:29 
 

Kullanıcı değerlendirmeye herhangi bir yorum bırakmadı

are1971
747
are1971 2022.08.12 13:24 
 

thank you for sharing free great tool

DREECKOVICH
64
DREECKOVICH 2022.07.11 18:13 
 

Kullanıcı değerlendirmeye herhangi bir yorum bırakmadı

[Silindi] 2022.06.23 10:52 
 

Kullanıcı değerlendirmeye herhangi bir yorum bırakmadı

Abir Pathak
53946
Geliştiriciden yanıt Abir Pathak 2022.06.23 12:59
Hi,
Nice to hear from you!
Actually I'm not really looking to add new enhancements to this one. I want to keep it simplistic and free :)
Seems like you have very specific requirements for an Indicator, merging 3 different ones. It sounds really cool.
You could try maybe posting it in freelance mql5 section. I'm sure someone will be able to make something with your requirements.
Good luck :)
John Winsome Munar
3471
John Winsome Munar 2022.06.14 05:35 
 

Kullanıcı değerlendirmeye herhangi bir yorum bırakmadı

topline8000
1144
topline8000 2022.05.03 12:14 
 

very good

Max
1639
Max 2022.01.26 14:12 
 

Super cool and unique, love it, thank you so much, almost perfecyt *^^*

EllyMaus
374
EllyMaus 2021.12.03 13:02 
 

Abiroid Auto Fibonacci Indicator in combination with Best Heiken Ashi VQZZ System are useful instruments/tools. THANX !!!

Forexan
497
Forexan 2021.11.29 09:25 
 

good

Elusive Pimpernel
182
Elusive Pimpernel 2021.10.28 15:39 
 

Thank you, will use and update here.

Suvashish Halder
177443
Suvashish Halder 2021.10.23 08:26 
 

Good Work 🙂

Andreas Door
76
Andreas Door 2021.10.18 19:54 
 

Thank you very much. Its perfekt!

12
Değerlendirmeye yanıt