YouTube'dan Mağaza ile ilgili eğitici videoları izleyin
Bir alım-satım robotu veya gösterge nasıl satın alınır?
Uzman Danışmanınızı
sanal sunucuda çalıştırın
sanal sunucuda çalıştırın
Satın almadan önce göstergeyi/alım-satım robotunu test edin
Mağazada kazanç sağlamak ister misiniz?
Satış için bir ürün nasıl sunulur?
MetaTrader 5 için Uzman Danışmanlar ve göstergeler - 63
This trading robot is based on a candlestick pattern and RSI indicator strategy. It looks for candles that have a small body relative to their shadows, indicating indecision in the market. It also checks if these candles are placed at the pivot point. If the close of one of the next candles breaks the resistance line from below and the RSI is above the MA of RSI, then the robot opens a buy order. If the close of one of the next candles breaks the support line from above and the RSI is below th
FREE

The indicator looks for the "Fifth dimension" trade signals and marks them on the chart. A detailed description of the chart patterns that generate the trade signals can be found in Chapter 8 "The Balance Line Trades" in the book Williams' "New Trading Dimensions". Signal levels with indication of the position entry or stop loss placement price are indicated directly on the chart. This feature creates additional convenience for the trader when placing pending orders. A solid horizontal line is d
FREE

Breakout based strategy, generates market entry signals when the price crosses a border of a certain price range. To create the strategy, we have used the history data with 99,9% quality for the last 15 years. The best signals had been selected and the false signals have been filtered out. The Expert Advisor performs technical analysis and considers only the breakouts that show the best result.
It uses a system of filtering false signals. The EA uses adaptive trailing stop. The EA uses a ver
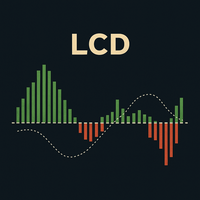
LCD Laguerre Yakınsama Farklılaşması: Klasik MACD'nin Gelişmiş Bir Versiyonu LCD Laguerre Yakınsama Farklılaşması (Laguerre Convergence Divergence) , klasik MACD'yi geliştirmek için tasarlanmış gelişmiş bir teknik göstergedir. Daha hızlı, daha hassas ve uyarlanabilir bir momentum tespiti sunar. En büyük avantajı, geleneksel hareketli ortalamalardan daha doğru bir şekilde fiyat değişikliklerine tepki veren Laguerre filtreleri kullanmasıdır. Temel Avantajlar Daha Yüksek Hassasiyet ve Daha Az Gecik
FREE

BotGPT edition 2024 is different from what you have seen so far, it independently adapts to market conditions in real time. In 10 years, it will still be at the cutting edge and will fulfill its role flawlessly, guided by customer suggestions in order to create a perfect system, only 150 traders will be able to use it. Its success rate is exceptional, download the demo version for free and see its results for yourself : Try it ! It's an intraday, it trades at its own pace, programmed for (EURU

The Fisher Transform is a technical indicator created by John F. Ehlers that converts prices into a Gaussian normal distribution. The indicator highlights when prices have moved to an extreme, based on recent prices. This may help in spotting turning points in the price of an asset. It also helps show the trend and isolate the price waves within a trend. The Fisher Transform is a technical indicator that normalizes asset prices, thus making turning points in price clearer. Takeaways Turning poi
FREE
The Vix_Fix indicator, or "Vix Fix," is a tool designed to identify potential market bottoms. It operates on the principle of measuring extreme fear or pessimism among the crowd, which are moments when the market often has a high probability of reversing to the upside. Main Purpose: To help traders find high-probability BUY (Long) entry points by identifying when the market is "oversold." How it Works In simple terms, the Vix Fix measures the distance between the current bar's Low and the Highes
FREE

Ichimoku Kijun Trader Ichimoku Kijun Trader es un Expert Advisor diseñado para operar tendencias limpias , utilizando únicamente el sistema Ichimoku Kinko Hyo, sin indicadores añadidos ni filtros artificiales. La lógica del EA es simple y disciplinada:
identificar una tendencia clara y entrar en el pullback , no en la persecución del precio. El Kijun-sen actúa como eje central de la operativa, funcionando como nivel dinámico de equilibrio desde el que el sistema busca incorporarse a la tendenci
FREE
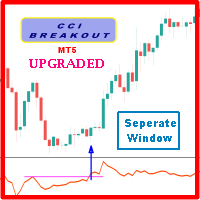
Probability emerges to record higher prices when Commodity Channel Index breaks out oscillator historical resistance level when exhibit overbought values. Since, oscillator breakout of support and resistance have similar effect as price breaks support and resistance levels, therefore, its highly advised to confirm price breakout with oscillator breakout; certainly, will have the same output in short trades. Concept is based on find swing levels which based on number of bars by each side of peak
FREE

Note: Talk to me for broker timing configuration because some brokers may have different time offset. EA will not work well with some of the brokers like Exness . Valkyrie GBPUSD is a professional-grade scalping Expert Advisor designed specifically for the GBPUSD . It combines multiple confirmations , a unique good risk-to-reward structure , and strict trade timing to deliver consistent performance. Key Features Built with many confirmations for safe and precise entries. Designed exclusively f

Этот советник торгует на пересечении двух индикаторов ЕМА и ТЕМА, сигналом на покупку будет когда быстрая ЕМА пересекает медленную ТЕМА с низу вверх, на продажу с верху вниз, управляя сделками с настраиваемыми параметрами для SL, TP и размеров лотов, так-же можно изменять период индикаторов EMA и TEMA, есть трейлинг-стоп на основе индикатора Parabolic SAR. Он использует комбинацию проверки данных в режиме реального времени и исторических индикаторов для принятия торговых решений. Советник структ
FREE
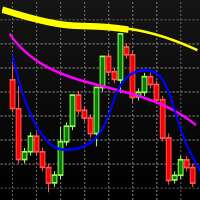
Baseado no indicador MIMA SAR, que é uma combinação dos indicadores MIMA Consolidação e MIMA Tendência, da metodologia Phicube. O indicador é composto pelos 8 fractais, 17,34.72.144.305,610.1292,2554. Sendo a tendência indicada pelas linhas finas e a consolidação pelas linhas mais espessas. Para usar o indicador de maneira adequada deve-se partir do princípio de que tudo na natureza segue o caminho que oferece menor resistência. Isso significa que para uma reversão da tendência ocorrer nesse mod
FREE

BITCOIN DAILY TOP BOTTOM ENGINE (V1)
This is not a simple indicator. This is a professional-grade market observation and decision engine designed for serious Bitcoin traders who demand clarity, structure, and precision.
The Bitcoin Daily Top Bottom Engine is built to identify high-probability daily extremes using adaptive range logic, sweep behavior analysis, and market condition filtering. Instead of reacting late, this engine prepares you in advance by defining where the market is most like
FREE

Osiris Royal Arises is an integration of the Python programming language, deep learning machine and mql5 code to be able to predict USDCAD,USDCHF and EURUSD price movements so as to produce the most profitable entries and exits with minimal average risk per order.
Why Osiris Royal Arises ? + Osiris Royal Arises has been through the research and development stage for almost 1 year, and has passed the testing phase. + Osiris Royal Arises uses martingale only when it is deemed to be an ideal
FREE
NeoBull Breakout Indicator - Profesyonel Kırılım Ticareti Kolaylaştı NeoBull Breakout Indicator, özellikle kırılım yatırımcıları için tasarlanmış MetaTrader 5 için güçlü bir teknik göstergedir. Yüksek olasılıklı kırılım kurulumlarını belirlemek için kanıtlanmış En Yüksek/En Düşük seviyelerini SMA 200 trend filtresi ile birleştirir. Ana Özellikler: * Basamaklı En Yüksek (20) Çizgisi - Son 20 periyodun en yüksek değerini net bir yatay çizgi olarak gösterir (TradingView'daki gibi) * Basamaklı En Dü
FREE

A "simple design" trading panel, which is characterized by small byte size, low CPU usage, simple steps, and quick operation, 1 to 2 clicks to complete a functional operation,
saving time and increasing efficiency . The panel is easy to use, and it is not complicated to set parameters, which is in line with traders' habits. At the same time, its compact-
design, clear at a glance, and comprehensive functions are a powerful tool for manual trading! Key features of the panel:
Click "Bid/Ask Pri

StopLevel The meter controls the STOPLEVEL level. When the level changes, it signals with an alert. STOPLEVEL - the minimum offset in points from the current closing price for placing Stop orders, or the minimum allowable stop loss / take profit level in points. A zero value of STOPLEVEL means either the absence of a restriction on the minimum distance for stop loss / take profit, or the fact that the trading server uses external mechanisms for dynamic level control that cannot be transmitte
FREE

PropSurge One MT5 — Prop Challenge’ları geçmek için danışman Bu ticaret algoritması , disiplin ve Prop Firm gerekliliklerine uyum odaklı olarak tasarlanmıştır. Mimarisi, risk kontrolü ve sermaye kurallarının temel faktör olduğu eğitim koşullarına yöneliktir. Algoritma, değerlendirme programlarında istikrarlı çalışacak şekilde optimize edilmiştir. Dikkat! Satın aldıktan hemen sonra benimle iletişime geçin , kurulum talimatlarını almak için! Önemli: Prop Firm Challenge’ın ne olduğunu bilmiyorsanız

MACD Pro – MACD Indicator for MetaTrader 5 Description
MACD Pro is a Moving Average Convergence Divergence (MACD) indicator for MetaTrader 5. It follows the standard MACD calculation method and displays trend direction and momentum in a separate indicator window. Indicator Elements MACD line based on the difference between fast and slow exponential moving averages Signal line calculated as an exponential moving average of the MACD line Histogram showing the difference between the MACD and signa
FREE

CRAZY WHALE MT5 — fully automated grid trading. The EA that survives the storm and conquers the trend.
Why Traders Choose Crazy Whale Super Grid Intelligence — Positions, hedges, clears, rebalances and lot automatically.
You trade — it thinks, reacts, and adapts. Trend Hunter — Reads Market Structure in real time to follow the whales, not the crowd. Risk Customization — Choose your aggression level and auto-scaled lot size. Plug & Play Simplicity — No setup headaches. Attach, run, and watch it
FREE

SmartGridCloserEA v.2 – Adaptive Grid Trading with Pair-Based Profit Closures Description:
SmartGridCloserEA v.2 is a fully automated Expert Advisor for MetaTrader 5 that applies a dynamic BUY-only grid strategy across multiple asset classes such as Forex, Gold, and Indices . Unlike traditional grid EAs that rely on fixed take-profit levels, this robot introduces an intelligent system for pair-based position closures based on profit differences, helping to lock in gains even during ranging or c
FREE

Bu gösterge, temiz ve doğru sinyalleri tercih eden traderlar için tasarlanmış, basit ama son derece güvenilir bir trend yönü tahmin aracıdır. Ana Özellikler Trend tahmin okları – fiyat hareketine göre Buy/Sell sinyalleri. Az ama yüksek doğrulukta sinyal – genelde günde 1 sinyal. Exit sinyalleri – en uygun kapanış zamanı için Exit okları. Repaint yok – oklar asla değişmez. Buffer desteği – özel araçlar veya EA için uygun. Uyarılar dahil – popup, ses ve push bildirimleri. Ayarlanabilir ok boyutu –

DF Fib Trader Pro DF Fib Trader Pro, MetaTrader 5 için tasarlanmış otomatik bir işlem sistemidir. Giriş ve çıkış noktalarını tanımlamak için Fibonacci tabanlı fiyat seviyelerini trend ve yapı analiziyle birleştirir. EA hem uzun hem de kısa pozisyonları destekler ve yerleşik risk yönetimi parametreleri içerir.
Temel Özellikler: • Giriş, SL ve TP noktalarını çizmek için Fibonacci geri çekilme ve uzatma mantığını kullanır. • Yapılandırılabilir lot büyüklüğü ve zarar durdurma/kâr alma seviyeleri •
FREE

The Martinware Manual Trading Helper indicator is aimed at helping people start their lives in manual trading. It can be used to display both some generic images at the right side of the graph, where custom operational remarks may be displayed or just a blank rectangle hiding the chart while backtesting. Moreover, it can periodically play a list of sounds. To show a blank rectangle, let the first image name input field empty and select the desired color. To show one or more custom images inste
FREE

HA Trend Flow is a professional two-stage smoothed Heiken Ashi trend indicator for MetaTrader 5.
It is designed to clearly visualize market trends , reduce noise and reliably identify sideways market phases – without repainting. Ideal for trend traders, scalpers, swing traders and multi-timeframe analysis . Key Benefits Much smoother trends compared to standard Heiken Ashi 2-stage smoothing (OHLC + Heiken Ashi) Automatic sideways / chop detection Clear neutral & doji candle identificat
FREE

The XU_H4_910440109_S_PS_CF_SQX is an algorithmic trading strategy for MetaTrader, tested on XAUUSD (Gold) using the H4 timeframe from April 1, 2004, to April 24, 2024. There is no need to set up parameters, all settings are already optimized and fine-tuned.
Recommended broker RoboForex because of EET timezone.
You can find the strategy source code for StrategyQuant at the link: https://quantmonitor.net/gold-bulls-power-trader/
Key details are:
Parameters
MagicNumber: 910440109
Main Ch
FREE

Gatotkaca Support Resistance Trendline Indicator is a simple indicator that detects support, resistance and trendlines. It will helps you find breakout momentum based on lines calculated by this indicator. This is conceptually based on fractals, but with customizable periods. Compatible for any timeframes. You can customize how this indicator work by setting up the period input.
FREE

Zone Alerts by iXOpay - MT5 Indicator What it is Indicator that marks price zones and sends alerts when the price touches, breaks, exits, or retests those zones. Neutral, informative tool. No promises of profit. How to use Attach to any symbol and timeframe. Set the zone boundaries and enable the desired events. Optionally enable trend/volatility filters. Receive alerts and manage your plan. Inputs EMA_Period (20/50/100/200) - optional trend filter Stoch_K , Stoch_D , Stoch_Smooth - confirmation
FREE

Apply to the 5 minute timeframe against the major USD forex pairs. AUDUSD EURUSD GBPUSD USDCAD USDCHF USDJPY Highlights the PropSense Book Levels Turn on/off for Sydney, Asia, London and New York Sessions Shows the Tokyo and London Fixes Turn on/off for Tokyo and London Configure how many historical fixes to show Shows the Sessions Turn on/off visible indication for sessions (supports 4 sessions) Visibly shows the sessions (out of the box configuration for Sydney, Tokyo, London and New York) Hig
FREE

KDJ Indicator for MT5 The KDJ Indicator for MT5 is a professional-grade momentum and trend analysis tool designed to help traders identify trend reversals , overbought/oversold conditions , and entry or exit opportunities with high accuracy. Originally developed as an enhancement of the Stochastic Oscillator , the KDJ adds a powerful J-line that reacts faster to price movement, giving traders earlier warnings of potential reversals. Key Features Three-Line System (K, D, J):
The K and D lines r
FREE

VeMAs, hacim dinamiklerini ve piyasa yapısını analiz ederek ticaret stratejinizi geliştirmek için tasarlanmış yenilikçi bir ticaret aracıdır. İster yeni başlayan ister deneyimli bir tüccar olun, VeMAs size avantaj sağlar. VeMAs göstergesi sadece 50 $ karşılığında temin edilebilir. Göstergenin orijinal fiyatı 299 dolardır
SINIRLI SÜRELI TEKLIF. Version MT4
Here are some blogs on the VeMAs indicator
Piyasa hacmi ve yapısı, göz önünde bulundurulması gereken birkaç önemli unsurdan bazılarıdır.

Introducing the Professional Indicator ARKA – Candle Close Time
Do you want to always know the exact remaining time for the current candle to close? Or do you want to instantly see the real-time broker spread right on your chart without any extra calculations?
The ARKA – Candle Close Time indicator is designed exactly for this purpose: a simple yet extremely powerful tool for traders who value clarity, precision, and speed in their trading.
Key Features:
Displays the exact time re
FREE

Multi-timeframe trend indicator based on the ADX / ADXWilder indicator with Fibonacci levels
The indicator shows trend areas using ADX or ADXWilder indicator data from multiple timeframes. The impulse mode of the indicator allows you to catch the beginning of a trend, and several "Screens" with different timeframes allow you to filter out market noise. Fibonacci levels are added to the price chart, which have flexible settings.
How the indicator works: if PDI is greater than NDI, then it`s
FREE

Golden Scalper EA - MetaTrader 5’te Mum Formasyonu Analizi ile Otomatik Scalping Danışmanı AÇIKLAMA Golden Scalper EA, MetaTrader 5 platformu için tamamen otomatik bir danışmandır (EA) ve yüksek frekanslı işlem ile scalping’de maksimum verimlilik ve minimum risk sağlamak üzere tasarlanmıştır. Danışman, mum formasyonlarını analiz eden gelişmiş algoritmalar ve hareketli ortalama (MA - Moving Average) filtreleme sistemi kullanarak giriş noktalarını hassas bir şekilde belirler. Golden Scalper EA, gü

Daily VWAP — Institutional Reference for Intraday Value The Daily VWAP is a professional indicator based on the Volume-Weighted Average Price (VWAP) , designed to reveal the true balance between price and volume throughout the trading session. Unlike traditional moving averages, the Daily VWAP incorporates the weight of traded volume in every price movement, providing a much more accurate reference to the behavior of institutional traders and large market participants. What the indicator deliver
FREE

Kanunay Expert Advisor
Overview Kanunay is a MetaTrader 5 Expert Advisor designed for automated forex trading. It combines the Kwiatkowski-Phillips-Schmidt-Shin (KPSS) test for stationarity with the Relative Strength Index (RSI) to generate trading signals. The EA is designed to open trades during specific hours and uses a set of conditions to determine entry points.
Key Features 1. KPSS-RSI Combination: Uses KPSS for trend identification and RSI for overbought/oversold conditions. 2. Time-Ba
FREE

One of the best trend indicators available to the public. Trend is your friend. Works on any pair, index, commodities, and cryptocurrency Correct trend lines Multiple confirmation lines Bollinger Bands trend confirmation Trend reversal prediction Trailing stop loss lines Scalping mini trends Signals Alerts and Notifications Highly flexible Easy settings Let me know in the reviews section what you think about it and if there are any features missing.
Tips: Your confirmation line will predict tre
FREE

Candle Close Timer – MT5 Utility indicator for MetaTrader 5 that displays the remaining time until the current candle closes directly on the chart. Real-time countdown Appears above the active candle Adjustable color and font size Works on all symbols and timeframes Provides clear candle timing information to support chart analysis and execution planning.
FREE

BU GÖSTERGE, EA'NİN BİR PARÇASIDIR: HIPERCUBE PRO GALE BTC Darwinex Zero için %20 indirim kodu: DWZ2328770MGM_20
Donchian Göstergesinin Yeni Sürümünü Tanıtıyoruz
Donchian göstergesinin yeni sürümünü sunmaktan heyecan duyuyoruz. En son geliştirmeler ve artırılmış hassasiyetle tasarlandı. Artık tamamen HiperCube Pro Gale için uyarlanmış olan bu güncellenmiş araç, daha etkili ticaret için sorunsuz bir deneyim sunuyor.
Bu sürüm neden bir dönüm noktasıdır:
HiperCube Pro Gale için uyarlanmıştı
FREE
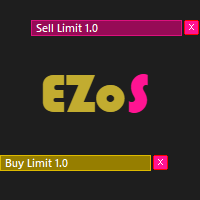
Easy Order Send help you to put your order on the chart using shortcuts keys like (SHIFT or CTRL). To send a order, hold CTRL or SHIFT and press left click mouse. It's a Beta version with features below: 1 - Send Buy and Sell order with SHIFT AND CTRL
2 - Cancel Button to your order
3 - Cancel Button to your position
4 - Move your order
5 - Monitor your Profit after trade on.
FREE

Mostra a média móvel quando ADX > 20 e pinta de verde ou vermelho quando os valores de ADX estão subindo indicando tendência. Quando o ADX é menor que 20 indica movimento lateral consolidado. O indicador não define pontos de entrada, somente mostra a média colorida quando a tendência está se fortalecendo. Faz parte do grupo de indicadores do Indicador Tavim.
FREE

ClickDrag grafik üzerinde kolayca çizgiler çizer ve nesneleri taşır.
Bir trend çizgisi çizmeye başlamak için tıklayın ve ardından Sürükleyin.
Fareyi yatay olarak hareket ettirmek bir fiyat çizgisi çizer.
Fareyi dikey olarak hareket ettirmek bir tarih çizgisi çizer.
Mevcut çizgiler ve nesneler Tıkla ve Sürükle ile taşınabilir.
Başlangıç noktası ile bitiş noktası arasındaki fiyat ve zaman farkını görüntüler.
Başladıktan sonra Tıkla ve Sürükle,
Rengi değiştirmek için sola ve sağa sallayın
FREE

SAM Waves AutoTrader – Intraday Trader’lar için Hassas Çoklu Döviz Uzman Danışmanı
(M15 Grafik EA • H4 Trend Onayı • Sabit SL/TP ile Forex robotu • Grid / Martingale / Hedging yok • Yukarıdan Aşağı Analiz • 2025’in En İyi MT5 EA’sı • Prop-Firm Dostu & Güvenli Otomatik Forex Botu) Lansman Teklifi – Erken Kullanıcılar için Özel Fiyatlar
31 Temmuz 2025 tarihine kadar veya Temmuz ayındaki ilk 15 satış gerçekleşene kadar geçerlidir (hangisi önce gerçekleşirse). Lisans Türü Kampanya Fiyatı Normal F

This strategy is designed for high-frequency scalping , utilizing the Daily High/Low levels and the Andean Oscillator to identify optimal trade opportunities. It works best in volatile market conditions where price frequently reacts to key levels.
How It Works: • Daily High/Low Levels act as dynamic support and resistance zones where price often consolidates or reverses. • Andean Oscillator measures momentum shifts and trend strength, confirming entries with high precision. • Trade Entry:

Liquidity Seeker EA
Why You MUST Have This EA Unlock the power of ICT (Inner Circle Trader) methodology with the most advanced Smart Money Concept trading system available. This EA transforms complex institutional trading concepts into automated precision, giving you the unfair advantage that professional traders use to consistently profit from liquidity manipulation and market structure shifts. START trading WITH market makers using their own playbook. You don't need to do much other than to
FREE

BullBear Strength Meter The BullBear Strength Meter is a dynamic market sentiment and momentum indicator that quantifies the real balance of power between buyers and sellers. Instead of relying on a single formula, it fuses multiple proven analytical engines into one comprehensive strength model — giving traders an accurate visual readout of bullish and bearish dominance in real time. This tool measures, compares, and displays the intensity of market forces using advanced statistical and trend-b
FREE

The script tries to determine the overall direction of the market, using smoothed Heiken Ashi candles. The coloring system (using bright and dark colors) is an attempt to detect strong market and weak market conditions. There's also an oscillator within the script
These are the features: Alert condition Features: You can now set alerts in the alert dialog for events like trend switch, trend strengthening and weakening; all for both Bullish and Bearish trend.
I also added the code for custom a
FREE

Expert Advisor - Advanced AI/ML Multi-Algorithm Trading System
Deep Q-Network + 5-Network Ensemble with Continuous Learning & Pattern Recognition CORE SPECIFICATIONS & CAPABILITIES AI Strategy:
Component Type Primary Deep Q-Network Ensemble 5 Neural Networks Learning Reinforcement + Meta Pattern Chart Recognition Regime Market Classification Trading Specs:
Parameter Value Primary TF M15 Analysis M1-D1 Multi-TF Instruments ALL Markets Min Deposit $500+ Lot Size 0.1 Default Risk Protection:
F
FREE

Adaptive ATR Trailing Stop Volatility-Adaptive Stop Loss Management Tool This Expert Advisor manages stop losses for existing positions using the Average True Range indicator to adapt trailing distance based on current market volatility. Brief Description Adaptive ATR Trailing Stop is a utility Expert Advisor that automatically adjusts stop loss levels for open positions. The tool uses ATR to calculate appropriate trailing distances that adapt to changing market conditions, protecting gains whil
FREE

Forex Çarkı - Victorious Creations Labs
Trend piyasaları ,Yatay Piyasalar .Kimin umurunda ! . Korelasyonsuz rastgele pariteler kaç kez yanılabilir?
Analiz felcinden kurtul ve alışılmadık yöntemlerle olumlu sonuçlar görmeye başla. Yatırımcıların %95'i başarısız olur çünkü yatırımcıların %95'i sana öğrettikleri senden yapmani istedikleri şeyi yapar ! . Oyunu kendi tarzında oyna .
ERKEN KULLANICI FİYATI: $59.99 Forex Çarkı, tüccarların piyasaya pratik bir yaklaşım yoluyla temel beceriler gelişt
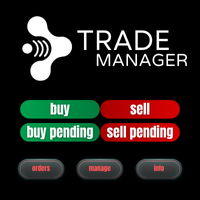
XC Trade Manager for MT5 Manage Your Trades with Precision and Ease
Welcome to XC Trade Manager, the ultimate solution for traders seeking efficient and intuitive trade management on the MT5 platform. Developed by xignalcoding.com, our seventh product in the MQL5 Market lineup, the XC Trade Manager is designed to streamline your trading experience, allowing you to focus on what truly matters—making informed trading decisions. Key Features 1. Orders Tab Effortlessly place and manage your trades

Key Features: Automatic swing detection on any timeframe (M1 to MN1) Visual arrow indicators (red for swing highs, blue for swing lows) Adjustable sensitivity with customizable swing strength parameter Dynamic arrow positioning that never overlaps with candles Instant display when changing timeframes - no delays Compatible with MT4 and MT5 platforms Clean, professional interface with minimal screen clutter Lightweight code for fast performance Customizable colors and arrow sizes
Customizable S
FREE

Alligator Window Indicator : Potencialize suas análises no MetaTrader com o Alligator Window. Este indicador coloca o clássico Alligator de Bill Williams em uma janela separada, permitindo uma visualização mais clara e organizada. Ideal para traders que buscam precisão e eficiência em suas operações, o Alligator Window proporciona insights nítidos e facilita a identificação de tendências sem poluir o gráfico principal. Experimente agora e leve suas estratégias de trading a um novo patamar!
FREE
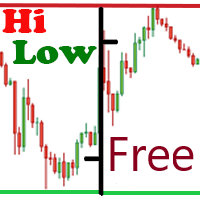
The free version of the Hi Low Last Day indicator . The Hi Low Levels Last Day indicator shows the high and low of the last trading day . The ability to change the color of the lines is available . Try the full version of the Hi Low Last Day indicator , in which additional indicator features are available : Displaying the minimum and maximum of the second last day Displaying the minimum and maximum of the previous week Sound alert when crossing max . and min . levels Selecting an arbitrary audio
FREE

VM SuperAshi Trend Precision Trend Sniper using Smoothed Heiken Ashi, Supertrend and EMA Trend
Optimized for M1–M5 Scalping
Overview VM SuperAshi Trend is an indicator that combines a standardized Supertrend with smoothed Heiken-Ashi candles to deliver clear, confirmed, and non-repainting buy/sell signals directly on the chart. It automatically draws Buy/Sell arrows, displays Fast, Slow, and Trend EMA lines, and provides Popup, Email, and Push notifications.
Key Features Supertrend-based signal

EMA Crossover Expert Advisor (Free MT5 EA) Automate Your Trading with the Classic Trend-Following Strategy The EMA Crossover EA is a free, fully automated trading tool designed for MetaTrader 5. It simplifies one of the most reliable technical strategies—the Moving Average Crossover into a "set and forget" solution for retail traders. Perfect for capturing big trends on major currency pairs like EURUSD and GBPUSD, this EA handles the entry, exit, and risk management so you don't have to watch th
FREE

Gina Dual TPO — Brief MQL5 indicator TPO + Volume profile overlaid on chart — fast, scalable, and beginner-friendly. Built for traders who read market structure by POC and Value Area. What it is An MQL5 indicator that overlays dual market profiles—Time-at-Price (TPO) and Volume-at-Price (VPO)—directly on your chart. It’s fast (pixel-based drawing), scalable, and beginner-friendly. Who it’s for Intraday and swing traders who read market structure via POC (Point of Control) and Value Area to spot
FREE

RSI AutoTrader Pro – Smart Multi-Symbol ATR Engine Introduction RSI AutoTrader Pro is not another simple RSI bot — it’s a complete, intelligent trading system built for multi-symbol automation and dynamic risk control .
Attach it to any chart , and it automatically scans every symbol in your Market Watch , identifies RSI signals, manages trades with ATR-based stop levels , and optimizes each position size according to your selected risk percentage . It’s more than an indicator
FREE

Arbi V 0.1 is a sophisticated Expert Advisor (EA) designed for traders looking to capitalize on arbitrage opportunities in the cryptocurrency market. Developed by Samir Ranguni, this EA automates a dual-pair trading strategy, simultaneously opening a then waits for a specified market drop before initiating new trades. Ideal for traders seeking a hands-off approach to crypto trading, Arbi V 0.1 combines precision, flexibility, and a clear trading logic.
Input Parameters Symbol1 (default: "BTCUS
FREE

The Expert Advisor is based on the signals of the Stochastic indicator in the overbought zone-we sell, in the oversold zone-we buy. Version for MT4 https://www.mql5.com/ru/market/product/62952 Monitoring the work of the adviser MT4 https://www.mql5.com/ru/signals/1178019 MT5 https://www.mql5.com/ru/signals/1178043 If the Expert Advisor is used in 5/24 mode on a VPS, I recommend using this Expert Advisor in a conservative mode, limiting the number of orders in the grid using the " Count_Order
FREE

Ritz Conspiracy 16 – Multi-Layer Market Intelligence System Ritz Conspiracy 16 adalah indikator analisis pasar multi-layer yang menggabungkan 16 indikator teknikal utama ke dalam satu panel visual terpadu.
Dirancang dengan konsep market intelligence , indikator ini bekerja seperti pusat komando yang membaca perilaku pasar dari berbagai sudut: trend, volatilitas, momentum, volume, hingga struktur harga. Dengan pendekatan “konspiratif”, indikator ini menghubungkan jejak kecil dari 16 algoritma unt
FREE

This Supertrend strategy will allow you to enter a long or short from a supertrend trend change. Both ATR period and ATR multiplier are adjustable. If you check off "Change ATR Calculation Method" it will base the calculation off the S MA and give you slightly different results, which may work better depending on the asset. Be sure to enter slippage and commission into the properties to give you realistic results. If you want automatic trade with Supertrend indicator, please buy following pr
FREE
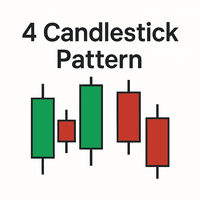
Here’s your MQL5 description for "4 Candlestick Pattern": 4 Candlestick Pattern is a powerful tool designed for MetaTrader 5 that detects reliable price action patterns based on consecutive four-candle formations. This indicator simplifies pattern recognition for both reversal and continuation signals, enhancing your technical analysis. Whether you are a beginner or professional trader, this tool helps identify critical market turning points and potential trade setups with ease. Features: Detect
FREE

system designed to follow strong trends.
Core Principle operates on a simple yet powerful concept: identify strong trends and stay in them until the market gives a clear signal of change. Every trade opens with an automatically calculated stop loss. What You Get Two Independent Strategies that can be activated together or separately based on your preference: Strategy One - SuperTrend Classic Uses the ATR indicator to determine trend direction, with ADX filtering to confirm movement strength
FREE

Having trouble marking where the various forex sessions start and end? Or perhaps your strategy requires you trade only in a specific session, then this is for you.
The session indicator shades the session you require in a certain color so that you can identify it easily. The sessions shown include: London session, New York session, Asian Session, Asian - London overlap and London - New York Overlap.
Difference source give varying time ranges for the various session, mostly differing by not m
FREE
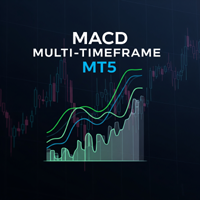
The Multi-Frame MACD Indicator is a robust MetaTrader 5 (MT5) indicator that utilizes the Moving Average Convergence Divergence (MACD) to analyze trends across multiple timeframes. This indicator synchronizes MACD-based trend signals from up to nine timeframes (M1, M5, M15, M30, H1, H4, D1, W1, MN1) and presents them with clear visual cues, including a colored MACD line, signal arrows, and a customizable dashboard. Perfect for traders seeking momentum and trend reversal insights. Features Multi-
FREE

LongTerm — Orta ve Uzun Vadeli Trend Yönü Analiz Göstergesi LongTerm , orta–uzun vadeli trendin gücünü ve kalitesini yorumlamak için tasarlanmış bir yönsel analiz göstergesidir ve özellikle long (alış) odaklı analiz üzerine yoğunlaşır. Bu gösterge bir giriş sinyali değildir ve operasyonel zamanlama aracı da değildir .
Amacı, kısa vadeli dalgalanmaların yarattığı gürültüyü azaltarak, piyasanın orta–uzun vadeli long trend için elverişli veya elverişsiz koşullar sunup sunmadığını anlamada trader’a
FREE

MACD with 4-Color Histogram Overview MACD with 4-Color Histogram is a modern upgrade of the classic MACD indicator — redesigned for clarity, precision, and visual power .
It provides instant insight into market momentum , signal strength , and trend reversals using four distinct color zones that make trading decisions faster and more confident. Color Logic Color Condition Interpretation Green MACD > 0, Signal < MACD Bullish momentum strengthening Orange MACD > 0, Signal > MACD Bul
FREE

This indicator is a very simple indicator that draws candlesticks on a chart. However, it is possible to draw not only on the main chart but also on several sub-charts. In addition,it is possible to draw different symbols and timeframes from the main chart. features. 1. any symbols 2. any timeframes 3. two candle type(normal and heikin ashi) 4. many candle colors(intersection with ma_1) 5. pivot line (ver1.2) In case of positive candle, FULL : change color if low is over ma_1 PARTIAL :
FREE

It's no secret. One of the best edges in trading is the mean-reversion strategy on US indices. Don't believe me? Do just a little research. Hence, having an EA that does this is very much a must-have in any portfolio. I made this for myself, but I am also offering it to anyone who needs it as well at a fair price. The process of making it was using RSI and using a point for buying and closing. I then used machine learning to test 100,000s of variables to get to this configuration. How does it
FREE
MetaTrader mağazası, MetaTrader platformu için uygulama satın almak adına rahat ve güvenli bir ortam sunar. Strateji Sınayıcıda test etmek için Uzman Danışmanların ve göstergelerin ücretsiz demo sürümlerini doğrudan terminalinizden indirin.
Performanslarını izlemek için uygulamaları farklı modlarda test edin ve MQL5.community ödeme sistemini kullanarak istediğiniz ürün için ödeme yapın.
Alım-satım fırsatlarını kaçırıyorsunuz:
- Ücretsiz alım-satım uygulamaları
- İşlem kopyalama için 8.000'den fazla sinyal
- Finansal piyasaları keşfetmek için ekonomik haberler
Kayıt
Giriş yap
Gizlilik ve Veri Koruma Politikasını ve MQL5.com Kullanım Şartlarını kabul edersiniz
Hesabınız yoksa, lütfen kaydolun
MQL5.com web sitesine giriş yapmak için çerezlerin kullanımına izin vermelisiniz.
Lütfen tarayıcınızda gerekli ayarı etkinleştirin, aksi takdirde giriş yapamazsınız.