YouTube'dan Mağaza ile ilgili eğitici videoları izleyin
Bir alım-satım robotu veya gösterge nasıl satın alınır?
Uzman Danışmanınızı
sanal sunucuda çalıştırın
sanal sunucuda çalıştırın
Satın almadan önce göstergeyi/alım-satım robotunu test edin
Mağazada kazanç sağlamak ister misiniz?
Satış için bir ürün nasıl sunulur?
MetaTrader 4 için ücretli teknik göstergeler - 112
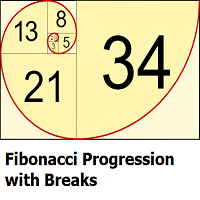
This indicator highlights points where price significantly deviates from a central level. This deviation distance is determined by a user-set value or using a multiple of a period 200 Atr and is multiplied by successive values of the Fibonacci sequence. Settings
Method: Distance method, options include "Manual" or "Atr"
Size: Distance in points if the selected method is "Manual" or Atr multiplier if the selected method is "Atr"
Sequence Length: Determines the maximum number of significant devia
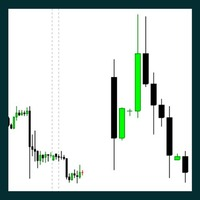
The Indicator is useful for professional trader, such as ICT , Smart Money Concept trader; who do the top-down analysis and want to display the candles of the Higher Timeframe on the Lower Timeframe. It allows you to stay in your entry timeframe while following the narrative of the Higher timeframe. Here are some easy input: Number Of Bars: The total of HTF's candle you want to display. Auto Timeframe: If true, the indicator will recommend the Higher timeframe that suit the current timeframe you
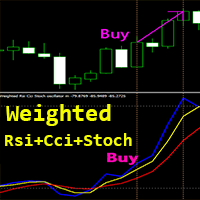
MT4 için Crypto_Forex Göstergesi "Ağırlıklı Rsi Cci Stoch Osilatörü", Yeniden Boyama Yok.
- Bu benzersiz gösterge 3'ü 1 arada birleştiriyor: Hesaplama için RSI, CCI ve Stokastik! - Bu yazılımla hassas momentum ticareti fırsatları - resimlerdeki örneklere bakın. - Gösterge 3 çizgiden oluşur: - Ağırlıklı Rsi Cci Stoch Osilatörünün kendisi (Mavi renk); - Osilatörün hızlı MA'sı (Sarı renk); - Osilatörün yavaş MA'sı (Kırmızı renk); - 50'nin üzerindeki bölge - aşırı alım bölgesi (Orada SATIN ALMAYIN

DYJ BoS MT4 göstergesi, piyasa yapısındaki değişimlerin temel unsurlarını otomatik olarak belirler ve işaretler, bunlar arasında şunlar yer alır:
Yapının Kırılması (BoS): Fiyatın önceki bir yapı noktasını kırarak önemli bir hareket yapması durumunda tespit edilir.
Olası yükseliş trendi çizgilerini ve düşüş trendi çizgilerini (UP & DN, yani sürekli yeni zirveler ve yeni dipler) işaretler ve fiyat bu çizgileri aştığında kırmızı (AYI) ve yeşil (BOĞA) okları işaretler
BoS genellikle fiyatın önce
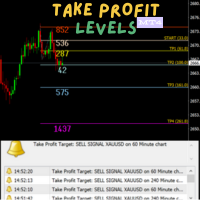
This indicator outlines take profit (TP) stations derived from the Dinapoli ABC price projections. The key levels identified include COP (the critical operation point) designated as TP1, OP (the optimal point) marked as TP3, and SXOP (the secondary operation point) noted as TP4.
This indicator proves to be especially beneficial for traders entering positions without clearly defined exit points. The Dinapoli levels provide precise price projections that highlight where the market is most likely
This is the Parabolic Dashboard MT4. This dashboard will scan multiple timeframes and symbols in MT5 platform, from M1 chart to D1 chart. It will send the buy/sell signals by alert on the platform or sending notification to your phone or message you via a email.
The buy signal is generated when the SAR changes its position from above to below of the candle. The sell signal is is generated when the SAR changes its position from below to above of the candle. The up/down trend color will be di
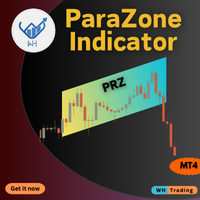
The ParaZone Indicator MT4 helps you spot areas where price trends are likely to reverse. It marks these zones on your chart using a unique parallelogram shape, making it easier to find the best points to enter or exit trades. Whether you’re a beginner or experienced trader, this tool can help improve your trading decisions. Key Features: Accurate Reversal Detection: Identifies key zones where price may change direction. Dynamic Zone Adaptation: Zones adjust in real-time to follow market

One of the key elements in trading is identifying zones or levels that allow traders to make buy or sell decisions during trading. أحد العناصر الأساسية في التداول هو تحديد المناطق أو المستويات التي تسمح للمتداولين باتخاذ قرارات الشراء أو البيع أثناء التداول. The indicator displays Fibonacci levels يعرض المؤشر مستويات فيبوناتشي drawing levels based on historical daily or weekly data. مستويات الرسم بناءً على البيانات التاريخية اليومية أو الأسبوعية. Daily levels update with each new day’s opening

Are you a newbie who feels like trading is rocket science? Fear not! With our new Indicator, you’ll trade like a pro—without the awkward space suit!Say goodbye to the confusion and hello to profits! Now you can impress your friends with your "expert" trading skills—even if you just learned what a stock is! :money_mouth:Trade smart, not hard! Grab the Trade Wiz-A-Matic today and let’s launch your trading journey! Key Features: Dynamic Levels : The indicator calculates and plots key levels based o

Enter/Exit indicator Try trading on signal change BUY/SELL to Sell SELL/BUY to buy or exit by signal change. Very good for trading news. - - - - - - - - - - Please leave positive comments. - - - - - - - - - - - - - - - - - - - - - - - - - - - - - - - - - - - - - - - - - - - - - - - - - - - - - - - - - Info: CalculatedBars = Indicator Calculated Bars; AlertConfirmation = true On false Off LongBarPoints = maximum point value for signal long bar size. Buffer0[] = Arrow Up; Buffer1[] = Arrow Down;

When geometric shapes meet with time and price, they give more confidence in the chart The indicator plots daily and weekly price triangles So that the weekly is kept until the end of the trading week While the Daily is changing with each opening The size of the triangles varies based on the previous data They will be an aid in decision-making, especially on both sides of the Triangle * Contains options to activate and disable triangles * Merge weekly and daily triangles together, each c
When time converges with price in a critical zone, it creates a pivotal area that simplifies decision-making. This is precisely the functionality of this indicator, as it integrates time and price to highlight a robust zone you can rely on.
Key Features of the Indicator: • Dynamic Time-Price Zones: The indicator draws a time-price zone determined by the user, based on customizable settings available in the configuration. • Customizable Day Selection: A dedicated field allows you to choose th
The product has been removed from sale。 Sales suspended, do not download. 2025/1/28 The product has been removed from sale。 Sales suspended, do not download. 2025/1/28 产品已下架 产品已下架 The product has been removed from sale。Sales suspended, do not download. 2025/1/28 The product has been removed from sale。Sales suspended, do not download. 2025/1/28 产品已下架 产品已下架 The product has been removed from sale 产品已下架 The product has been removed from sale 产品已下架 The product has been removed from sale The product

Adjustable Volume Profile Indicator The Adjustable Volume Profile is a custom MetaTrader 4 (MT4) indicator designed to visually display the volume distribution of a financial instrument across a specific price range and time period. This indicator allows traders to analyze the volume profile based on either real volume or tick volume, helping to identify key levels of support, resistance, and market activity.
Key Features: Customizable Timeframe: The indicator can be set to any available timefr
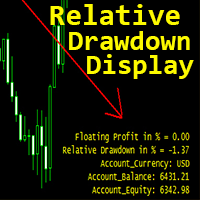
Crypto_Forex Göstergesi "Göreceli Düşüş Göstergesi" MT4 için, kullanışlı bir işlem aracı.
Bu, grid işlem sistemlerini kullanan yatırımcılar için MUTLAKA SAHİP OLUNMASI GEREKEN bir göstergedir!!!
- Göreceli Düşüş Göstergesi göstergesi, hesabınızdaki mevcut Göreceli DD veya Yüzen Karı % olarak gösterir. - PC ve Mobil Uyarılar, ayarlanabilir Tetikleyici seviyesiyle yerleşiktir. - Gösterge ayrıca hesap Bakiyesini ve Sermayeyi gösterir. - Gösterge değerlerini grafiğin herhangi bir köşesinde bulmak
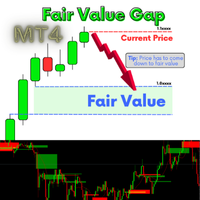
A fair value gap (FVG) is a temporary price gap that occurs when the price of a stock or security is out of line with its fair value. This gap is often caused by an imbalance between buyers and sellers. How it works Price imbalance When there is an imbalance between buyers and sellers, the price of a security can move too quickly. Price gap This creates an unadjusted area on the price chart, known as the fair value gap Price correction The price is often drawn back to the fair value gap, as i

Dynamic Center of Gravity Indicator Revolutionary Price Action Trading System Harness the power of price momentum with the Dynamic Center of Gravity indicator - an advanced price action trading tool designed for serious traders. This innovative indicator identifies powerful gravity zones that attract rapid price movements, creating high-probability trading opportunities when momentum breaks free from these zones. Key Features Pure price action analysis - no lagging indicators Works effectively a
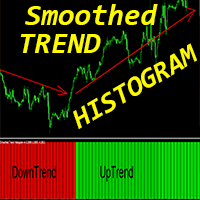
Crypto_Forex Göstergesi "Smoothed Trend Histogram" MT4 için, Yeniden Boyama Yok.
- Smoothed Trend Histogram göstergesi, herhangi bir standart Hareketli Ortalamalar çaprazından çok daha verimlidir. - Özellikle büyük trendlerin tespiti için odaklanmıştır. - Göstergenin 2 rengi vardır: Ayı düşüş trendi için Kırmızı ve boğa yükseliş trendi için Yeşil (renkler ayarlardan değiştirilebilir). - Mobil ve PC uyarılarıyla. - Bu göstergeyi diğer işlem yöntemleriyle birleştirmek harika bir fikirdir: Fiyat
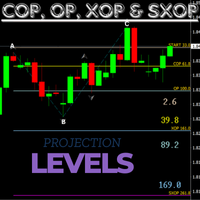
If you're familiar with COP, OP, and XOP levels, this indicator is definitely worth considering. There's no need to manually plot the ABC levels, as the indicator automatically calculates and displays the OP projection levels for you, updating regularly as the price changes.
This is an essential indicator for your trading toolkit. Please if you are unsual on how to use this indicator feel fell to ask me for help and i can assist you where i can.
Happy trading!

If you're familiar with trading using Dinapoli levels, then this indicator is definitely worth your attention. It automatically plots key levels such as COP (Change of Polarity), OP (Objective Price), and XOP (Extended Objective Price) on your charts, regardless of the timeframe you choose to work with.
One of the standout features of this indicator is its ability to generate alerts. Whenever a new ABC pattern is automatically identified and plotted by the indicator, you will receive a notifica
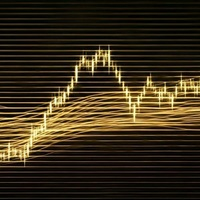
This is an indicator that seeks to show support and resistance zones in channels through expansion .
Abraxis Indicator Discover our innovative Abraxis Indicator , a powerful tool designed for traders seeking to refine their chart analysis and maximize their trading opportunities. This indicator was developed to operate efficiently across different timeframes, allowing you to adjust your strategies according to your needs. Key Features Calculation of Lines Based on Previous Pil

Trump Arrow is for trading the trends of the markets. It uses convergence and divergence. Use it during active times to get behind a trend and follow it with MA filters or other strategies you have. The indicator works well for small time frames just and it suggests using 15 min. Others work too but for day trading 5-15 is best. 1 hr charts if you want to filter for longer term trends.
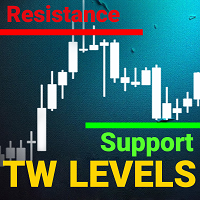
support resistance levels indicator mt4:
Bu araç, insan gözünün aynı doğruluğuyla bir grafikte destek ve direnç çizgilerini, ayrıca Fibonacci seviyelerini tanımlayan ve çizen çok zamanlı bir göstergedir. Forex için TW destek ve direnç seviyeleri, fiyat stabilizasyonu ve sıçramalarının önceki seviyelerini belirlemek için grafiği tarayan karmaşık bir algoritmaya sahiptir ve dokunuş sayısını kaydeder.
Destek ve direnç seviyelerini ve Fibonacci geri çekilmelerini manuel olarak çizmeye mi yoruldun
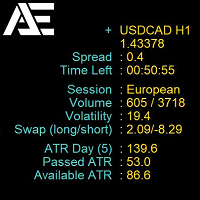
Piyasa Bilgisi Ekranı, doğrudan grafiğin üzerinde kullanıcı dostu bir arayüzde düzenlenen önemli piyasa bilgilerini gösteren çok yönlü bir göstergedir. Özellikleri, tüccarların bilinçli kararlar vermesine yardımcı olan verileri etkili bir şekilde gösterecek şekilde tasarlanmıştır. Mevcut spread, mum kapanana kadar geçen süre, mevcut işlem seansı, hacim, oynaklık, günlük fiyat değişikliği ve ATR (günlük oynaklık) hakkında veri sağlar.
Gösterge, çok dilli özelleştirmeyi (Rusça ve ingilizce) des

Session Liquidity is the most anticipated trading strategy among the ICT trader. With this indicator you could frame the trade by simply deploying it on the chart. By simply inputting the Asian Opening Time, New York Opening Time, and choose the color option and display option you like then you will get the session laid down for you on the chart. You can choose between showing session as box or horizontal line. I personally trade this strategies for quite sometimes.
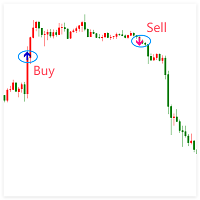
Extreme Breakout Signal is a trading strategy based on price breaking through key support or resistance levels. It indicates potential trend shifts, allowing traders to capture new upward or downward movements.
Parameter extreme radius: extreme radius(Different parameters can be set for different periods) Key Principles Support & Resistance : Prices often reverse near these levels; breaking them may signal a new trend. Confirmation : Use volume or other indicators to verify the breakout's valid

Trend Master ZA Göstergesi Trend analizi gücünden yararlanın ve Trend Master ZA göstergesinin sunduğu derinlemesine piyasa eğilimlerini ve fiyat dalgalanmalarını keşfedin. Birden fazla teknik stratejiyi tek bir göstergeye entegre etmek isteyen trader'lar için tasarlanmış bu güçlü araç, piyasa trendleri hakkında kapsamlı bilgiler sağlar. Temel Özellikler: Bollinger Bantlarıyla Trend Analizi : Piyasadaki trendleri belirlemek için Bollinger Bantları'nın gücünü kullanır. Periyot ve standart sapma ay

This is an indicator that seeks to show consolidation zones .
Discover the Power of Prediction with the Limiar Latus Indicator ! An innovative indicator designed for traders seeking to identify and anticipate crucial turning points in sideways market movements. Key Features: Predicting Changes: Utilizes advanced algorithms to detect sideways patterns, allowing you to anticipate significant movements before they happen. Clear Visual Analysis: With intuitive rectangles representing con
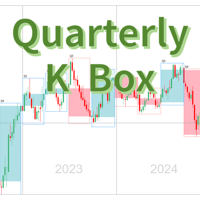
Çeyreklik Mum Kutusu Göstergesi Tanıtımı Ürün Adı Çeyreklik Mum Kutusu Göstergesi (Quarter K Box Indicator) Ürün Tanımı Çeyreklik Mum Kutusu Göstergesi, Forex, hisse senetleri ve vadeli işlemlerle ilgilenen yatırımcılar için özel olarak tasarlanmış bir teknik analiz aracıdır. Bu gösterge, aylık, haftalık, günlük ve daha küçük zaman dilimi grafiklerinde çeyreklik mumların aralığını (en yüksek, en düşük, açılış ve kapanış fiyatları) gösterir. Grafiğin arka planında net kutular çizerek, yatırım

Binary Win 60, M5 (5 dakika) zaman diliminde çalışmak üzere tasarlanmış ikili opsiyon ticareti için profesyonel bir araçtır. Bu gösterge, aşağıdaki popüler para çiftlerinde işlem yapmak için idealdir: AUDCAD, AUDNZD, CHFJPY, EURCAD, EURAUD, EURCHF, EURGBP, EURNZD, GBPAUD, GBPJPY, GBPUSD, USDJPY. Temel özellikler: Ok şeklinde net sinyaller: Yeşil ok: Alım sinyali. Kırmızı ok: Satım sinyali. Anlık bildirimler: Pop-up bildirimi. Sesli uyarı. Önerilen süre sonu: 1 mum (5 dakika).
The KT Dynamic Price Oscillator (DPO) offers a specialized approach to analyzing the trend, momentum, and volatility of financial instruments. It excels at identifying trend continuations, overbought or oversold conditions, and potential reversal points with precision. It is specifically designed to assist traders in identifying short-term price cycles and potential reversals by effectively filtering out long-term trends.
How to use the DPO
Trend Confirmation: The DPO acts as a reliable confir

Waterfall Trading Indicator Overview The Waterfall Trading Indicator is a powerful momentum detection tool designed to identify high-probability trading opportunities across multiple timeframes. Built on pure price action analysis, this indicator provides clear, non-repainting signals that are especially effective for binary options and forex trading. Key Features Non-Repainting Signals : Based on real-time price action, ensuring reliable trade signals Multi-Timeframe Compatibility : Effective a

"The upgraded version of the Gold heat map. The indicator is more effective on the gold chart, where daily opportunities will appear clearly before you. Levels14Golden , introduces the integration of supports, resistances, and time, along with significant enhancements."
1. **Heatmap for Price Dynamics**: A heatmap has been added to indicate the intensity of price movements, ranging from **45 to 630 degrees**. - **Major Levels**: Marked in **blue**, as shown in the video. - **Sec
As an ICT or SMC trader you must do top-down analysis, and you struggle to make template of drawing object on Metatrader just like you normally do on Tradingview. Well, Drawing Assistance indicator will make your top-down analysis much easier on Metatrader. Allow to design template for 3 timeframes. (HTF, MTF and LTF). Each objects drawn on chart will have the color, style and visibility individually by the timeframe it was drawn on. Save time as all analyzing is done on Metatrader chart. Shortc

Fibo Extrema Bands is a unique indicator that visually demonstrates when the market shifts into a trend and highlights key levels acting as support or resistance. It combines easy-to-read “stepped” extrema lines with Fibonacci levels (whose values can be adjusted in the indicator’s inputs), simplifying the search for entry and exit points. Install Fibo Extrema Bands to gain a powerful tool for trend analysis and for identifying critical price levels! This product is also available for MetaTrade

Master alert is an indicator based on deep mathematical and statistical calculations. It generates two types of signals; Buy signals Sell signals It uses the following indicators to generate signals; Adx CCI SAR MACD MA WPR MOM When the indicator shows 6 or more of the above indicators with the same buy signal on the dashboard the market is trending up. It is a good time to place buy order. When the indicator shows 6 or more of the as above signals with the same sell signals the market is trendi
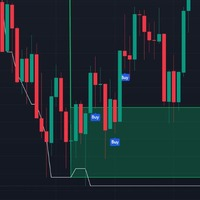
MACDx RSI Supply And Demand Indicator is a dynamic trading indicator designed to identify potential reversal zones in financial markets by combining the momentum insights of the Relative Strength Index (RSI) with order block (supply/demand) levels derived from a MACD-based custom tool. It visually highlights bullish and bearish zones on the chart, offering clear entry signals through directional arrows. Ideal for swing traders and reversal strategists, this tool aims to capture price reversals

Range indicator is a mt4 indicator that shows various levels to enter and Exit a trade. Once you have installed the indicator in the terminal you will see on the trading dashboard various values which include; Support level in pips from the current price, Resistance level in pips from the current price, Stop loss level in pips from the current price to exit if market conditions change
Range bound is a mt4 indicator that shows various levels to enter the market. It uses MACD as the primary reference indicator. When MACD oscillator is showing buy or sell signals these are displayed on your trading dashboard but as levels to buy or sell on the main chart. The indicator shows blue signals and red signals That are support and resistance levels. In short this indicator shows ranges where your trades should be safe from market changes against your order.
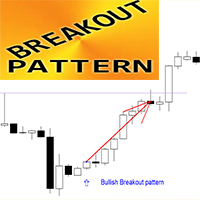
Crypto_Forex Göstergesi MT4 için "Breakout Pattern".
- "Breakout Pattern" Göstergesi Fiyat Hareketi ticareti için çok güçlü bir göstergedir: Yeniden boyama yok, gecikme yok. - Gösterge, grafikte "içeriden 3" olarak da adlandırılan çubukların Breakout kombinasyonunu algılar: - Boğa Breakout Pattern - Grafikte mavi ok sinyali (resimlere bakın). - Ayı Breakout Pattern - Grafikte kırmızı ok sinyali (resimlere bakın). - PC, Mobil ve E-posta uyarılarıyla. - "Breakout Pattern" Göstergesi Destek/Diren
Volonacci Indicator It is an indicator that combines Fibonacci and volume to determine the price direction This indicator helps you identify Fibonacci angles according to the strategy The Volonacci indicator is indeed an interesting combination of Fibonacci levels and volume. This indicator uses Fibonacci tools to identify potential support and resistance levels, and enhances this by using volume to confirm the strength behind the price action.
MT5 Version https://www.mql5.com/en/market/produc

Arrow up down is a mt4 indicator that shows various levels to enter the market. It consists of two signals; Buy signal Sell signal Buy signals are shown as blue arrows on the chart once you install the indicator. Sell signals are shown as red signals on the chart. The indicator uses other underlying indicators like moving average together with statistical calculations to generate signals.

Trendfollow Indicator - with Stoploss and Trailingstop Accurate Signals – Identifies trend reversal candles Filter – for better trend detection Intelligent signal limitation - Only qualified signals in the trend direction are displayed Easy to use – Perfect for beginners & professionals Visual support – arrows in the chart + display in real time Notifications – Receive alerts & push notifications The indicator also provides the initial stoploss. As the position progresses, this is us

RSI bands indicator is a mt4 indicator that shows various levels to enter trades based on market conditions. It consists of the below buffers; Yellow buffer Blue buffer White buffer When the yellow buffer is above blue buffer the market is trending up good place to open buy order. When the blue buffer is above yellow buffer the market is trending downwards good time to place sell order. Also another alternative scenario is when yellow buffer is above upper white band buffer indicates strong uptr

Rsi with Bollinger bands is a mt4 indicator that shows various levels to enter trades in the market based on conditions. It consists of two main buffers; Yellow buffer that is the current price Grey buffer that shows overbought and oversold levels. When the yellow buffer crosses 70 zone in grey buffer market is trending upwards. When the yellow buffer crosses below 30 zone in the grey buffer the market is showing a strong downtrend. The overbought and oversold levels are customizable in the ind

DESCRIPTION: Discover the power of adaptation with Adaptive RSI Bands, a revolutionary indicator based on the concepts of self-adaptive trading rules. Unlike traditional RSI with static levels of 70 and 30, this indicator “breathes” with the market, dynamically adjusting its overbought and oversold bands according to recent volatility.
Why use Adaptive RSI Bands? Markets are not static. An RSI level of 70 may be significant in a sideways market, but irrelevant in a strong trend. This indicator
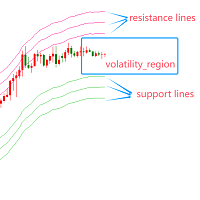
Indicator Introduction: The Volatility Range Indicator aims to help traders identify the current market's volatility range by analyzing historical price data. By calculating the upper and lower bounds of price fluctuations, traders can determine potential support and resistance levels, providing a foundation for subsequent trading decisions. This indicator is particularly suitable for ranging markets and high-volatility environments, as it can effectively assist traders in capturing price breako

The Gann Hi-Lo indicator is a powerful tool for trend analysis.
This modified version colors the signal line and chart candles according to the trend direction.
In an uptrend, the candles and the line appear in a bullish color, while in a downtrend, they are displayed in a bearish shade.
This makes it easier to visually identify trend changes and provides traders with clear guidance.
Thanks to the simple interpretation of the indicator, traders can quickly react to market movements and make wel

RiskMaster Pro Lotsize Protector
Gösterge, riski yönetmenin muhtemelen en basit yolunu sunar. Karmaşık ayarlar olmadan, sipariş yürütme için gerekli olan bilgileri tam olarak sağlar. Karmaşık ayarlar yok, istenen sipariş türünü seçin Market/Pending Siparişler, mevcut sermayenin yüzdesi olarak istenen riski ve risk-getiri oranını (Risk-Reward-Ratio RRR) girin. Market Siparişleri: • Stop Loss (SL) çizgisini fare ile istenen konuma sürükleyin. • Gösterge, izin verilen lot büyüklüğünü, SL/TP’ye o

very simple indicator to help with fast risk management during volatility.
~Displays: - stop loss in points of your choice. - take profit in points of your choice. - what lot size to risk on the trade relative percentage.
~Values that can be changed: - take profit points. - stop loss points. - risk in percentage. - color of lines. - width of lines. - linestyle. - buy / sell trade.

Daha Akıllı Destek ve Direnç Göstergesi Daha Akıllı Destek ve Direnç Göstergesi, teknik analizini geliştirmek için tasarlanmış bir araçtır. Birden çok zaman diliminde anahtar destek ve direnç seviyelerini otomatik olarak tanımlayarak, yatırımcıların daha bilinçli kararlar almasına yardımcı olur. Bu araç, belirli bir geri alma dönemi boyunca en çok test edilen seviyelere dayalı olarak en yüksek ve en düşük fiyat noktalarını verimli bir şekilde hesaplar, ardından bu seviyelerin ortalamasını alarak
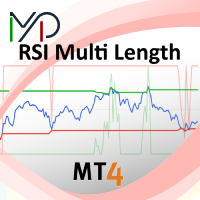
This indicator provides insights into Relative Strength Index (RSI) values over multiple timeframes. It highlights the percentage of RSIs across varying periods that are classified as overbought or oversold, and also calculates the average of these RSIs. The percentage of overbought or oversold RSIs is further utilized to define adaptive thresholds for these levels. Settings: Maximum Length: Specifies the longest RSI period used in the calculations. Minimum Length: Specifies the shortest RSI pe
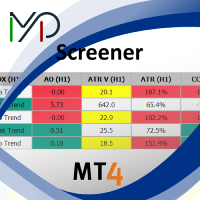
The MP Screener is a powerful and user-friendly tool designed for traders who need to filter and analyze multiple symbols based on various technical criteria. Whether you are a scalper, day trader, or swing trader, this screener helps you quickly identify the best trading opportunities in the market by scanning multiple timeframes and indicators in real time. With the MP Screener, traders can streamline their market analysis, making it easier to focus on profitable setups while saving time. Unl

ForexFire Renkotrader Recognize profitable entries & trade with confidence! Highlights: Precise signals – Identifies reversal candles in the trend EMA filter - Uses Ema`s for reliable signals Intelligent signal limiting - Only qualified signals are displayed Easy to use – Perfect for beginners & professionals Visual support - arrows in the chart + SL display in the chart Notifications – Receive alerts & push notifications This is how the indicator works: Long Signal:
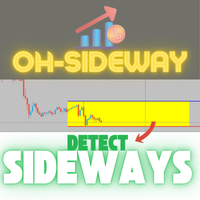
The indicator continuously calculates the current ATR value and displays it on the chart. If an adjustable threshold is undershot, a channel is automatically drawn to indicate a possible sideways movement. As soon as this threshold is exceeded again, the channel is removed from the chart. This is intended to show that the current market movements are weak and the channel shows a possible direction of a sideways movement in the market.
In addition to the threshold, the scaling of the ATR value
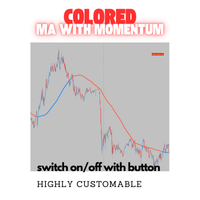
The indicator generates buy and sell signals based on a combination of a modified moving average with a trend momentum algorithm.
To ensure clarity on the chart, this indicator can be switched on and off using a freely positionable button.
Note: If you use this indicator multiple times, e.g. to display different MA periods, then you must change the "button label (ID)" in addition to the period to ensure it works. The label when pressed should also be changed accordingly for a clear overview.
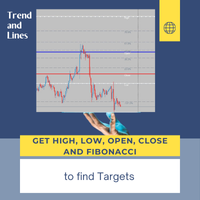
This indicator draws lines at the open, close, high and low price of the last chart candle from the set timeframe.
In addition, a label shows whether it was an up or down candle.
The standard settings follow the original idea of getting the price data from the daily timeframe for day trading/scalping, but
since this indicator is fully customizable, you can also set a different timeframe.
Based on the drawn price lines, you can then also display Fibonacci levels.
This function can also be
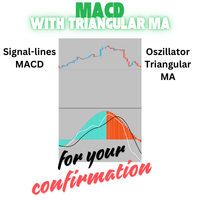
This indicator uses the signal lines of the MACD and uses Triangular MA as Oscillator. It is a good addition to trading decisions and part of the OH strategy.
Optimal trade confirmation occurs when the signal lines of the MACD coincide with the trend color of the Triangular Oscillator.
Of course everything important can be changed.
This indicator is part of the OH-Strategy, you can view other indicators of this strategy if you click on my name as a seller.

Spread & Candle Close Timer Indicator for MT4 Optimize your trading with this lightweight and efficient indicator, designed to display the real-time spread and candle close countdown directly on your MT4 chart. Features: Live Spread Monitoring – Instantly see market conditions. Candle Close Timer – Stay prepared for the next price movement. Simple & Non-Intrusive Design – No unnecessary settings, just clear and accurate data. Ideal for scalpers, day traders, and those who need real-time exec

Principle of Operation 1. Data Retrieval:
The indicator gathers real-time data on the trading instrument, including: Minimum and maximum lot sizes Tick value Spread Number of digits Account data (balance, currency) 2. Connection Check:
If there is no connection to the broker, a message is displayed on the chart, and no further calculations are performed. 3. Optimal Lot Size Calculation: Risk Determination: The indicator considers the specified risk value (e.g., 2% of the account balance) and

Levels price is a mt4 indicator that shows various levels to enter the market based on indicator calculations. The indicator consists of the following buffers; Red buffer Blue buffer Purple buffer The blue buffer is the resistance level where price is expected to bounce back. The red buffer is the support level based on the current market price. There is also a purple buffer below red buffer that can indicate the current support and resistance levels have been breached when price crosses this p

Mt support and resistance is an indicator that shows various levels to buy or sell based on prevailing market conditions. The main basis of the indicator is support levels and resistance levels. It consists of; Red buffer Blue buffer Purple buffer The blue buffer is resistance level where price is supposed to return back. The red buffer is the support level where price should bounce back.

Previous day levels is a mt4 indicator that shows various levels to buy or sell in the market based on prevailing market conditions. The main theory behind this indicator is support and resistance levels. The indicator uses previous day values in calculations to get the support and resistance levels for the next day period. This indicator consists of two purple buffers. The top buffer is the resistance level and the bottom buffer is the support level.
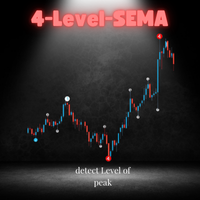
Well known to most, this indicator identifies the chart peaks and assigns the level of the peak. By classifying the peaks into levels, not only is a possible consolidation indicated but also the possible strength up to the highest level that indicates that a trend reversal is likely.
While most SEMA indicators work with 3 levels, this indicator has 4 levels.
This indicator is part of the OH-Strategy. You can view other indicators of this strategy if you click on my name as a seller.

Inside Candle Indicator for MT4 The Inside Candle Indicator is a simple yet effective tool for identifying inside bar formations on the chart. Inside candles signal market consolidation , often leading to breakout opportunities. Features: Automatically detects inside bars and marks them with a small dot below the candle.
Helps traders spot potential breakout zones and areas of market compression.
Works on all timeframes and asset classes , making it versatile for different trading strategi
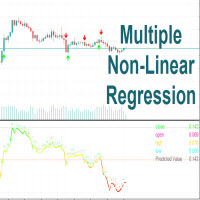
Multiple Non-Linear Regression MT4 This indicator is designed to perform multiple non-linear regression analysis using four independent variables: close, open, high, and low prices. Here's a components and functionalities: Inputs: Normalization Data Length: Length of data used for normalization. Learning Rate: Rate at which the algorithm learns from errors. Show data points: Show plotting of normalized input data(close, open, high, low) Smooth?: Option to smooth the output. Smooth Length: Lengt
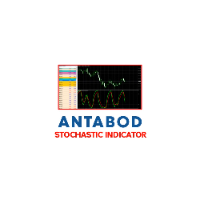
How Antabod Stochastic Works Antabod Stochastic is a cutting-edge technical indicator designed to analyze market momentum and identify overbought and oversold conditions with unparalleled precision. Here's a breakdown of how it works and what makes it a game-changer for traders: ________________________________________ 1. Core Concept At its heart, Antabod Stochastic is based on the stochastic oscillator principle, which measures the position of a current price relative to its range over a spec

Just Trade Indicator – Kesin ve stresiz işlem için en iyi yardımcınız!
Just Trade Indicator'ı keşfedin! MetaTrader 5 için geliştirilen bu güçlü gösterge, piyasada net giriş ve çıkış noktalarını belirlemenize yardımcı olur. Gelişmiş algoritmaları sayesinde, işlem sürecinizi kolaylaştıran sezgisel görsel sinyaller sunar. Neden Just Trade Indicator?
Net ve doğru sinyaller – Alım ve satım sinyalleri doğrudan grafikte oklarla gösterilir, yorumlama hatalarını ortadan kaldırır.
Çoklu zaman dil

This indicator overlays higher timeframe candles on the lower timeframe chart. You have option to make the candles Hollow (outline) or Solid (fill) for better visibility and analysis of your charts. You can easily change your chart timeframes ( to any lower timeframe than the indicator input) while using this indicator for true multi-timeframe analysis.
Features: Timeframes from 1 Min to 1 Month Minimal Inputs Customize candle body, color etc.
Inputs: Candles Period - Choose the timeframe f
In trading, it is important to trade at the right time, which is why it is advantageous to use this indicator to display the opening of the foreign exchange markets. Define your personal trading times by setting these times with an adjustable background color. You can switch this indicator on and off using a button on the chart. This indicator is part of the OH strategy; you can view other indicators of this strategy by clicking on my name as a seller.
MetaTrader mağazası - yatırımcılar için alım-satım robotları ve teknik göstergeler doğrudan işlem terminalinde mevcuttur.
MQL5.community ödeme sistemi, MetaTrader hizmetlerindeki işlemler için MQL5.com sitesinin tüm kayıtlı kullanıcıları tarafından kullanılabilir. WebMoney, PayPal veya banka kartı kullanarak para yatırabilir ve çekebilirsiniz.
Alım-satım fırsatlarını kaçırıyorsunuz:
- Ücretsiz alım-satım uygulamaları
- İşlem kopyalama için 8.000'den fazla sinyal
- Finansal piyasaları keşfetmek için ekonomik haberler
Kayıt
Giriş yap
Gizlilik ve Veri Koruma Politikasını ve MQL5.com Kullanım Şartlarını kabul edersiniz
Hesabınız yoksa, lütfen kaydolun
MQL5.com web sitesine giriş yapmak için çerezlerin kullanımına izin vermelisiniz.
Lütfen tarayıcınızda gerekli ayarı etkinleştirin, aksi takdirde giriş yapamazsınız.