YouTube'dan Mağaza ile ilgili eğitici videoları izleyin
Bir alım-satım robotu veya gösterge nasıl satın alınır?
Uzman Danışmanınızı
sanal sunucuda çalıştırın
sanal sunucuda çalıştırın
Satın almadan önce göstergeyi/alım-satım robotunu test edin
Mağazada kazanç sağlamak ister misiniz?
Satış için bir ürün nasıl sunulur?
MetaTrader 4 için ücretli teknik göstergeler - 108

L'indicatore QuantumBlocks è uno strumento avanzato progettato per i trader che desiderano identificare con precisione zone di accumulazione o distribuzione nel mercato, comunemente note come "Order Blocks". Questi livelli rappresentano aree chiave dove istituzioni finanziarie o trader di grande volume piazzano i loro ordini, influenzando pesantemente il movimento dei prezzi. Funzionalità principali: Identificazione automatica dei blocchi di ordini rialzisti e ribassisti : L'indicatore scansion

Alpha Trend sign has been a very popular trading tool in our company for a long time. It can verify our trading system and clearly indicate trading signals, and the signals will not drift.
Main functions:
Based on the market display of active areas, indicators can be used to intuitively determine whether the current market trend belongs to a trend market or a volatile market.
And enter the market according to the indicator arrows, with green arrows indicating buy and red arrows indicating se

Unveil Market Secrets with Sneaky Busters on MetaTrader 4! Delve deeper into the intricate world of trading with the Sneaky Busters indicator, specifically crafted to spotlight the sophisticated maneuvers of smart money and uncover hidden market trends. Comprehensive Features: 1. Smart Money Accumulation & Distribution Detection: Accurate Analysis: Identify key zones where smart money collects and disperses assets. These insights help you understand market sentiment and potential turning points.

The indicator is designed to display key price ranges on the graph and analysis of market dynamics within the established limits. It uses the parameter Period = 1200 , which means the calculation of data based on 1200 candles or bars to form and display the range. This period is suitable for long -term trends and allows you to identify important levels of support and resistance.
The Alert = True function activates a sound or visual notice when reached the price of the boundaries of the range o
This indicator is based on the strategy shared by TheMas7er on his youtube channel.
The IDR/DR range will help you identify the high and low of the day once a candle closes above or below the the DR levels.
The IDR/DR range is determined 1 hour after session open, 09:30 am est.
I have incorporated the fibonacci tool to help you mark the retracement for a good entry in the premium or discount zone.
Important
This indicator is designed for the indices and M5 timeframe, but you are welcome to

The indicator is based on the calculation of liquidity on the market and thus shows where the market can most likely turn.. It shows the places of liquidity where the price will reach sooner or later... The indicator can be set to several types of liquidity and therefore can display several levels on the graph.. It is a unique tool that can help you very well in your trading The indicator is suitable for currency pairs with the most liquidity (Forex,Crypto...)
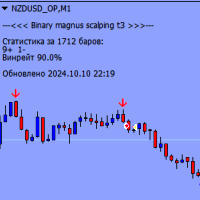
Binary Magnus Scalping T3, herhangi bir zaman diliminde ve herhangi bir döviz çiftiyle çalışan bir ikili opsiyon göstergesidir. Giriş noktalarını belirlemek için küme analizini kullanır ve mevcut mum kapanmadan önce kırmızı veya mavi grafikte bir açılır pencere ve tampon ok şeklinde bir uyarı verir.
Göstergenin ana özellikleri:
Herhangi bir zaman diliminde çalışır (M1, M5, M15, M30, H1, H4, D1) Herhangi bir döviz çiftini destekler 1 ila 3 mum arası son kullanma tarihi (varsayılan 1 mum) Giriş

Crypto_Forex Göstergesi HTF Ichimoku MT4 için.
- Ichimoku göstergesi en güçlü trend göstergelerinden biridir. HTF - Daha Yüksek Zaman Çerçevesi anlamına gelir. - Bu gösterge Trend Yatırımcıları için mükemmeldir ve Fiyat Hareketi girişleriyle birleştirilebilir. - HTF Ichimoku Göstergesi, daha yüksek zaman çerçevesinden Ichimoku'yu mevcut grafiğinize eklemenizi sağlar. - Yukarı trend - mavi olanın üzerindeki kırmızı çizgi (ve her iki çizgi de bulutun üzerindedir) / Aşağı trend - mavi olanın altı

Ultimate Index Advisor, piyasa hareketlerini hassas bir şekilde analiz etmek ve dinamik olarak ticaret fırsatlarını belirlemek için tasarlanmış gelişmiş bir araçtır. Gösterge, trendlere, düzeltmelere ve geri dönüşlere göre optimize edilmiş strateji kombinasyonlarına dayalı sinyaller sunarak, farklı ticaret stilleri için çok yönlü bir araçtır.
Kullanıcı dostu arayüzü ile Ultimate Index Advisor, grafik üzerinde görülebilir oklarla net giriş ve çıkış noktalarını vurgular, ticaret kararlarındaki be
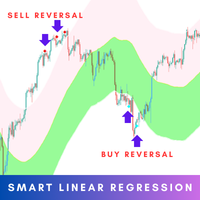
The Smart Linear Regression indicator is a powerful, non-repainting tool designed for traders looking for enhanced accuracy in market analysis. Unlike the typical linear regression channels that often repaint, this indicator provides reliable insights without changing past values, making it more trustworthy for forecasting future price movements. MT5 Version - https://www.mql5.com/en/market/product/124894/ Overview: The Smart Linear Regression Indicator goes beyond the basic linear regression c
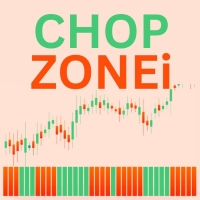
ChopZonei is a custom technical analysis indicator built to help traders identify trend strength and market conditions by calculating the angle of a chosen moving average (MA) over a specified period. The resulting angles are used to classify price action into various "chop zones," which are color-coded based on the direction and magnitude of the angle.
Key Features:
Multi-Timeframe Support: ChopZonei allows the user to calculate the indicator based on a higher timeframe (HTF) while avoiding
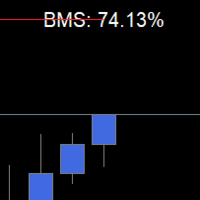
Special offer! https://www.mql5.com/ru/users/bossik2810 SMC Probability - is an indicator designed to track the actions of institutional investors, commonly known as “smart money”. This tool calculates the probability that smart money will actively participate in buying or selling in the market, which is referred to as smart money order flow.
The indicator measures the probability of three key events: Change of Character ( CHoCH ), Shift in Market Structure ( SMS ), and Break of Structure
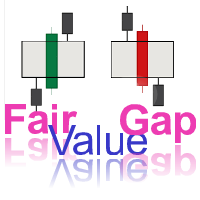
**Added to the Original Text:**
This indicator (Fair Value Gap - FVG) also **has the capability** to display **multiple timeframes** of your choice **simultaneously on a single chart**. This feature allows you to identify **stronger and more accurate signals**, as you can analyze price discrepancies (Gaps) across higher or lower timeframes, helping you make smarter trading decisions.
For example, if you spot a bullish FVG on the **1-hour timeframe** and it is also confirmed on the **4-hour

Order blocks are essential structures in trading that indicate areas where large institutional traders, like banks and hedge funds, have placed their orders. These blocks represent significant price levels where substantial buying or selling activity has occurred, providing clues about potential market movements. So, why should you, as a trader, care about order blocks? Well, knowing where these big orders are placed can give you a huge advantage. It’s like having a map showing where the treasur

Pattern Searching: Smart, Precise, & Customizable for MT4! Are you looking for a powerful tool to quickly and accurately identify trading patterns in Forex? This advanced indicator for MetaTrader 4 (MT4) is exactly what you need! Key Features That Will Amaze You: Automatic Classic Pattern Detection: This indicator automatically finds the closest classic Forex patterns for you. Whether you're looking for Smart Money Concepts (SMC) or NDS strategies, this tool covers it all! * Popular patt

江恩理论 江恩理论是金融市场分析中的一种重要工具,它基于市场周期性和自然法则的假设,通过特定的技术分析工具来预测市场走势。江恩理论的主要内容包括: 市场周期 :江恩认为市场存在周期性波动,这些周期可以通过特定的时间周期和价格周期来识别。 价格和时间 :江恩理论强调价格和时间之间的相互作用,认为两者是市场分析的关键要素。 江恩角度线 :这是江恩理论中的一种重要技术分析工具,用于识别市场的支撑和阻力水平。 江恩轮中轮 :又称“江恩圆形图”,是江恩发明的另一种重要技术分析工具,用于预测市场的未来走势。 量化分析 :T3指标可能通过特定的数学模型或算法来量化市场的行为或特征。 趋势识别 :T3指标可能用于识别市场的趋势方向,包括上升趋势、下降趋势或横向整理。 交易信号 :基于T3指标的分析,投资者可能能够获得买入或卖出的交易信号。
WayAlarmPoint is an indicator for the MetaTrader 4 platform, which provides various ways to notify about price movement in any direction. Its simple functionality allows you to select the desired sound for a given direction and set an individual distance in points for each side of the price movement. In addition, the indicator will accurately indicate the time when the goal is reached.
This indicator is ideal for those who want to go about their business without losing control of the market sit

WayAlarmPrice is an indicator for the MetaTrader 4\platform. It offers a variety of ways to notify you of price movements in any direction.
This easy-to-use indicator allows you to select the appropriate sound for each direction and set an individual distance to a specific price for each side of the road. In addition, it accurately determines the time to reach the goal.
To get started with the indicator, simply place it in the indicators folder of your MetaTrader 4 terminal, then move it to the

Harmonic Price Patterns Indicator This indicator has the capability to manually display the closest harmonic pattern to you. It allows you to easily adjust its parameters and create your own custom harmonic pattern, while also displaying the price distance between each point. Key Features of the Manual Harmonic Pattern Indicator Harmonic Pattern Identification Detects popular harmonic patterns such as ABCD, Gartley, Bat, Butterfly, Crab, and Shark. Displays patterns automatically or semi-automat
"Easy Indicator" forex is a pointer indicator based on non-standard calculation principles. The optimal exit is marked with a yellow cross, it signals the optimal exit point in the current trend. An emergency exit is marked with a red dot, signaling a possible change in trend. The “Risk” section displays the current risk for a given transaction, which is calculated taking into account the features of the current chart.

The Trend Reversal Indicator with alerts and push notifications is designed to detect reversal points on the price chart using a combination of indicators such as the Moving Average (MA), Stochastic Oscillator, and Average True Range (ATR). The indicator plots arrows on the chart that indicate potential buy or sell moments and can send real-time notifications in the form of alerts, push notifications, and emails when a signal occurs on the current bar. Key Features: Use of Moving Average (MA): T
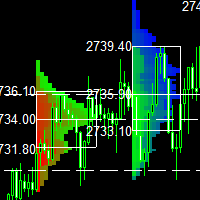
This indicator is a classic implementation of the Market Profile (Volume Profile Visible Range), allowing for the display of price density over time while highlighting the most significant price levels, the value area, and the control price within a specific trading session. MT5-version: https://www.mql5.com/en/market/product/125308 The indicator can be applied across timeframes from M1 to D1, enabling the analysis of market profiles for daily, weekly, monthly, or intraday trading. Utilizing l

MIGHTY FALCON PIPS Tanıtımı Mighty Falcon Pips, TRIX, Hareketli Ortalamalar ve Momentum’a dayalı, kolay bir alım ve satım göstergesidir. Gösterge, çıkış sinyallerini de ek olarak sunarak, potansiyel olarak yararlı ters sinyaller vermeye odaklanır. Güçlü çıkış sinyalleri, tersine dönen bir trendden zamanında çıkmanızı sağlar ve işlemlerinizi kolaylaştırır. Çıkış sinyalleri dahil tüm sinyaller ayarlanabilir; ancak yine de bunu iyi bir filtre ile (yapı temelli göstergeler gibi) kullanmanızı öneriri
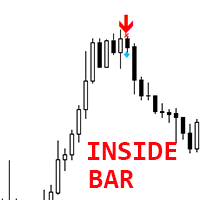
Crypto_Forex Göstergesi MT4 için INSIDE Bar Deseni.
- "INSIDE Bar" göstergesi Fiyat Hareketi ticareti için çok güçlü bir göstergedir. - Gösterge grafikte INSIDE Bar desenlerini algılar: - Boğa INSIDE Bar - Grafikte mavi ok sinyali (resimlere bakın). - Ayı INSIDE Bar - Grafikte kırmızı ok sinyali (resimlere bakın). - Yeniden boyama yok, gecikme yok, Yüksek R/R oranı (ödül/risk). - PC, Mobil ve E-posta uyarılarıyla. - "INSIDE Bar Deseni" göstergesi Destek/Direnç Seviyeleriyle birleştirmek için m
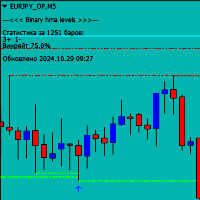
MT4 için Binary HMA Levels göstergesi özellikle ikili opsiyonlar için tasarlanmış olup, Forex ticareti için de mükemmel bir şekilde uygundur. Gösterge, önemli bir seviyeden fiyatın geri dönüşünü onaylayarak, mevcut mum kapanmadan önce ok şeklinde sinyaller verir. Göstergenin düzgün çalışabilmesi için "MQL5" klasörünü terminal dizininize indirip kurmanız gerekmektedir. Klasörü bu bağlantıdan indirebilirsiniz: https://disk.yandex.ru/d/DPyo0ntaevi_2A Gösterge evrenseldir ve herhangi bir zaman dili

The Zero-Lag MA Trend Levels indicator combines a Zero-Lag Moving Average (ZLMA) with a standard Exponential Moving Average (EMA) to provide a dynamic view of the market trend. This indicator automatically plots the EMA and ZLMA lines on the chart. The colors of the lines represent the market trend.
With EMA: ++ green (uptrend) when EMA > zlma ++ red (downtrend) when EMA < zlma With ZLMA: ++ green (uptrend) when the line is trending up ++ red (downtrend) when the line is trending down
When th
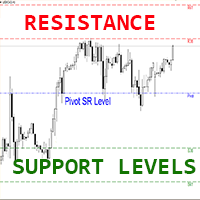
MT4 için Forex Göstergesi "Pivot Destek Direnç Seviyeleri Gün Hafta Ay".
- "Pivot SR Seviyeleri D_W_M" Göstergesi Fiyat Hareketi ticareti için çok güçlü bir yardımcı göstergedir. - Bu özel gösterge hesaplamada Fibonacci sayılarını kullanır. - Pivot Seviyeleri, bir piyasanın önceki işlem dönemindeki performansından önemli fiyatların ortalaması olarak hesaplanır. - Pivot Seviyeleri, genel piyasa koşullarına bağlı olarak en yüksek direnç veya destek seviyelerini temsil eder. - "Pivot SR Seviyeler
Signal Indicator
when price is crossing Trend Lines Horizontal Lines Rectangles Works on all timeframes and with all instruments. Multiple notification types Arrows on Chart Alert box Journal Log File Log Specific Sound Email Notification (must be configured in Terminal - please review MT4 docs) Push Notification (must be configured in Terminal - please review MT4 docs) Draw your trend lines, horizontal lines or rectangles onto your chart. Select an object and bring up its properties and type

The Zone1 is a tool to help professional or novice traders to assist in making decisions to buy or sell. This indicator is also not repainted so it is also suitable for scalping strategies, day trading and even swing strategies. i hope you can profitable like me....
if you have quotion abot this product you can contact me via email ichwan.dreamweaver@gmail.com

Scalping Worm is an essential tool for every trader aiming to improve the accuracy of their market entries and exits. With its advanced weighted moving average formula and adaptive smoothing logic, this indicator not only captures the current trend direction but also helps determine its strength and stability. The blue line signals an uptrend, while the red line indicates a downtrend, making analysis highly intuitive and visually straightforward. The main advantage of this indicator is its abili
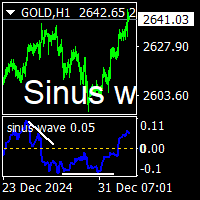
Sinus wave indicator is a extra ordinary oscillator.to find divergency. it works all pairs and all timeframes. suitable for experienced and beginner traders.. indicator works on toward of the prices... while sinus wave go up side that means prices will up. and while sinus wave go down that means prices is going down. it gives divegency when trend reversals. It also gives sell divergency on bear markets there is wave to set default 500. It can be increase depends to charts bars numbers on pictur
The MarketPrice Indicator is designed to provide a quick, one-glance visualization of the trend direction for a currency pair across all time frames (Time Frames), streamlining decision-making. MarketPrice Indicator is based on daily levels and trading signals derived from moving average crossovers and market strength according to various technical indicators. It comes fully configured, though you can, of course, modify any parameters as desired. Indicator Logic The indicator uses a combination

Hey there! If you are using Moving Average indicator into RSI indicator's window and always wondering if there could be a way to get alerts on your smartphone when those two indicators get a crossover that would be great, right!? Then you have found the right tool for that. This indicator is nothing but a mix of MA indicator and RSI indicator into one indicator window as well as it will give you alerts for crossovers on your smartphone app, email and also on your trading terminal's (desktop) cha

Real Spread Monitor is a powerful indicator that is designed to accurately measure and analyze real spreads, giving traders the ability to compare trading conditions of different brokers. This product is also available for MetaTrader 5 => https://www.mql5.com/en/market/product/125768 Key Features of Real Spread Monitor:
1. Two modes of operation: Write mode : In this mode the indicator collects data on real spreads of the selected trading instrument and records them in a file. The spread is r
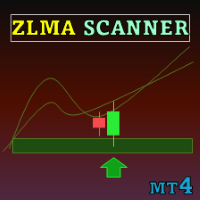
Special offer : ALL TOOLS , just $35 each! New tools will be $30 for the first week or the first 3 purchases ! Trading Tools Channel on MQL5 : Join my MQL5 channel to update the latest news from me Zero Lag MA Trend Levels with Scanner indikatörü, Zero-Lag Hareketli Ortalama (ZLMA) ile standart Üstel Hareketli Ortalama (EMA) birleşimini kullanarak yatırımcılara piyasa momentumu ve kilit fiyat seviyeleri hakkında kapsamlı bir görünüm sunar. Ayrıca, tarayıcı ve uyarı işlevleri sayesi
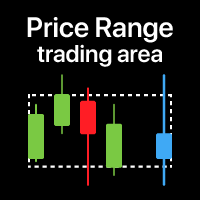
Fiyat bölgesi: seçilen zaman dilimi için işlem aralığının görselleştirilmesi Özellikle düşük zaman dilimlerinde işlem yaparken kullanışlıdır , böylece daha yüksek bir ZD'den aralığı görebilirsiniz . Benim #1 Aracım : Bu gösterge dahil 66+ özellik | Sorularınız için iletişime geçin | MT5 versiyonu Ne zaman kullanışlı olabilir: Çoklu zaman dilimleri kullanırken Farklı bir dönemin genel görünümünü görmek için Seçilen dönemin tüm aralığını görmek için Ayarlar: Bölge rengi Bölge dolgusu:
GENERAL OVERVIEW
Introducing our new KDE Optimized RSI Indicator! This indicator adds a new aspect to the well-known RSI indicator, with the help of the KDE (Kernel Density Estimation) algorithm, estimates the probability of a candlestick will be a pivot or not. For more information about the process, please check the "HOW DOES IT WORK ?" section. Features of the new KDE Optimized RSI Indicator :
A New Approach To Pivot Detection
Customizable KDE Algorithm
Realtime RSI & KDE Dashboard
Alert

Trend Osilatörü: Pürüzsüz ve Güvenilir Piyasa Trend Tanımlaması Trend Osilatörü, yatırımcıların trend yönünü ve potansiyel dönüş noktalarını doğru bir şekilde belirlemelerine yardımcı olmak için tasarlanmış, MT4 için gelişmiş bir göstergedir. Sezgisel bir görsel gösterim ile bu gösterge, piyasanın yukarı veya aşağı trendde olduğunu net bir şekilde gösterir, analizi basitleştirir ve grafiğin okunabilirliğini artırır. Çeşitli piyasalarda ve zaman dilimlerinde kullanılabilir, bu da farklı işlem iht
Indicator detects long bars. How to use:
base = base value in points of our long bar if this value is larger than bar we have our signal. useSplit = when we want to divide our trading into two before and after preset time. Both before and after work the same as our base . splitTimeHour = split time hour 14:00 would be 14. splitTimeMinute = split time minute 14:30 would be 30. before = same as base long bar value in points. after = same as base long bar value in points. useATR = instead o

To meet the need for quick and accurate decision-making in the market, we have launched this exceptional trend indicator. It is designed to provide clear trend analysis for your trading, reducing unnecessary noise and making trading simpler and more effective. Key Highlights and Advantages : No Redrawing : Once signals are generated, this indicator does not change with market fluctuations, ensuring the stability of your trading decisions. This avoids the confusion caused by redrawing and gives
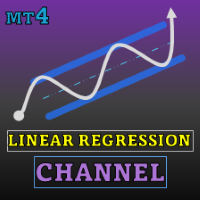
Special offer : ALL TOOLS , just $35 each! New tools will be $30 for the first week or the first 3 purchases ! Trading Tools Channel on MQL5 : Join my MQL5 channel to update the latest news from me Doğrusal Regresyon Kanal Göstergesi , yatırımcılara fiyat trendlerini ve potansiyel dönüş noktalarını yakalamada yardımcı olan güçlü bir teknik analiz aracıdır. Doğrusal regresyon kanalları, bantlar ve gelecek projeksiyonlarını hesaplayıp göstererek, bu gösterge piyasa dinamikleri hakkın

AI Trading Consultant , piyasaları analiz etmek ve anlamak için güvenilir bir teknoloji tabanlı araç arayan yatırımcılar için geliştirilmiş gelişmiş bir göstergedir. Uzun kısa süreli hafıza içeren bir tekrarlayan sinir ağı ( RNN LSTM ) tarafından desteklenen AI Trading Consultant, alım ve satım sinyallerini net bir şekilde sunarak, potansiyel piyasa hareketlerini belirlemeye yardımcı olur ve işlem kararlarını destekler. Temel Özellikler: Gelişmiş Yapay Zeka (RNN LSTM)
Bu gösterge, uzun süreli h

The real market buy/Sell signals, you can trust.
This indicator tracks the trend strength, the market strength, the real current volume, and the price direction to give traders and investors the optimum point for entry in the form of signals. The time frames range from 5 minutes to one (1) hour chart.
Trading on higher time frames produce the best outcomes, but also do produce less frequent trades, compared to trading on lower time frames.
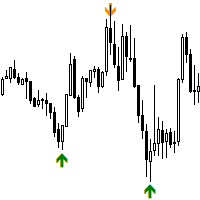
Swing Points Indicator for MetaTrader 4
The **Swing Points Indicator** is a custom-built technical tool designed for MetaTrader 5 (MT5), primarily used for identifying crucial reversal points in price action. By plotting swing highs and swing lows, it highlights potential trend reversals, making it a valuable tool for traders relying on price action analysis. This indicator helps traders anticipate changes in market direction by visually marking significant turning points on the chart.
Main F

The Wolf Wave Finder Indicator is a popular indicator, that is useful in identifying potential trading opportunities. The indicator works by recognizing the Wolf Wave pattern, which is a well-known pattern used by professional traders to identify potential areas of support and resistance. The indicator is easy to use and provides traders with an easy way to identify potential trades. The Wolf Wave Finder Indicator is a great tool for traders who are looking for a reliable and accurate way

This indicator is a fusion of the Parabolic SAR and Fibonacci indicators. Fibo is drawn on the last wave, at the peaks the indicator displays prices for convenience. Parabolic SAR helps to define the market trend and generates trends following trade signals. On the other hand, Fibonacci plots the price retracement levels so that traders can determine a better and safer place to enter the market. Scalping with Parabolic SAR and Fibonacci Overview. For this strategy, in addition to our indica
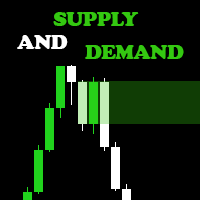
Are you ready to elevate your Forex trading game? Introducing the Supply and Demand Indicator , a powerful tool designed to help traders identify key market zones and make informed decisions with confidence! Key Features: Accurate Zone Identification : Our indicator pinpoints critical supply and demand zones, allowing you to spot potential reversal points and areas of price consolidation. User-Friendly Interface : With an intuitive design, you'll easily navigate through the settings and custom
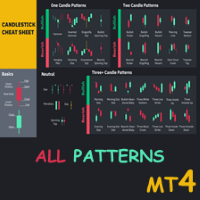
Special offer : ALL TOOLS , just $35 each! New tools will be $30 for the first week or the first 3 purchases ! Trading Tools Channel on MQL5 : Join my MQL5 channel to update the latest news from me Mum çubuğu formasyonlarını öğrenmek, piyasada bilinçli kararlar almak isteyen her tüccar için önemlidir. İşte All Candlestick Patterns – teknik analizlerinizi geliştirmek ve piyasa eğilimleri ve olası ters dönüşler hakkında güçlü bilgiler sağlamak için tasarlanmış kapsamlı bir araç. Bu h
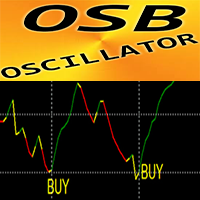
OSB Osilatörü - gelişmiş özel gösterge, etkili Fiyat Hareketi yardımcı aracıdır.
- Gelişmiş yeni hesaplama yöntemi kullanılır. - Yeni nesil Osilatörler - nasıl kullanılacağını kontrol etmek için resimlere bakın. - OSB Osilatörü, Fiyat Hareketi, Sapma ve Aşırı Satış/Aşırı Satın Alma sinyalleri için tam giriş noktalarını bulmak için yardımcı araçtır. - Aşırı Satış değerleri: 30'un altında. - Aşırı Satın Alma değerleri: 70'in üzerinde. - Bu gösterge ile standart stratejileri bile yükseltmek için
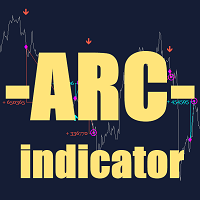
ARC Indicator — üç algoritmaya dayanan bir göstergedir: analitik bir algoritma, optimal giriş noktalarını belirleyen bir algoritma ve işlemlerden çıkış için bir algoritma. Göstergesi hem alım hem de satım için uygundur, bu da onu Forex piyasasında kullanışlı kılar. İşlemden çıkış, özel bir algoritma sayesinde en iyi anda gerçekleşir. Stop Loss seviyeleri otomatik olarak hesaplanır ve iki mod mevcuttur: "Minimal" Modu — scalping için uygundur. "Normal" Modu — riski artırır, ancak aynı zaman
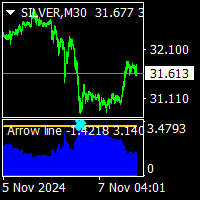
Arrow line indicator is no repaint trend indicator. it works on all time frame and all pairs. it is a pi number ( π) trigger based trend indicator. suitable for experienced traders and beginners. easy to understand. there is a trigger line and 2 histograms. red histogram is ower trigger that is top signal.. blue histogram is over trigger that is bottom signal. minimum bar number is 500. processed value must be setled between 500-3000. max value is depend to chart you are using.
Binary SF göstergesi, ikili opsiyonlar için MetaTrader 4 platformu için tasarlanmıştır ve yeniden çizilmeden sinyal sağlar, bu da onu tüccarlar için güvenilir bir araç haline getirir. Herhangi bir zaman dilimine (M1'den günlüğe kadar) uygun olup, trend ticareti için ağırlıklı olarak kullanılır ve kısa ve orta vadeli işlemler için uygun giriş noktalarını belirlemede tüccarlara yardımcı olur. Çalışma Prensibi ve Sinyaller Göstergesi, piyasayı analiz eder ve mevcut mum tamamlandığında grafikte görü

Last 50 Pips göstergesi, son fiyat hareketlerine dayalı olarak alım ve satım fırsatlarını hızlı bir şekilde belirlemek için tasarlanmıştır. Son mumlardaki fiyat değişimini ölçer ve fiyatın yön değiştirebileceği anları sarı renkle vurgular.
Alım sinyali: Gösterge KIRMIZI dan SARI ya değiştiğinde ALIM pozisyonu açmalısınız, bu da düşüş trendinden yükseliş trendine geçişi önerir. Ne kadar kolay olduğunu görmek için lütfen resimlere bakın.
Satış sinyali: Gösterge YEŞİL den SARI ya değiştiğinde SAT
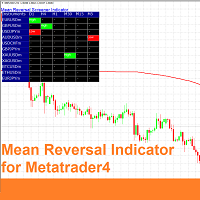
The Mean Reversal Indicator for MetaTrader 4 is a custom technical tool that identifies when the market reaches an n-period high or low, signaling potential mean reversion opportunities. Acting as a versatile screener, this indicator enables traders to detect n-period highs/lows across any selected timeframe and market offered by the broker, making it highly adaptable for multi-market or multi-timeframe analysis. Additionally, the Mean Reversal Indicator offers optional signal filters, including
Binary Boom Göstergesi, ikili opsiyon ticareti için tasarlanmıştır ve her zaman diliminde ve döviz çiftinde kullanılabilir. Önerilen sona erme süresi 1 mumdur. Gösterge, mevcut mum kapanmadan önce kırmızı veya mavi bir tampon ok şeklinde bir sinyal verir, bu da hızlı tepki vermenizi sağlar. Kolaylık olması için sinyallerin etkinliğini değerlendirmeye yardımcı olan sinyal geçiş istatistikleri grafikte görüntülenir. Dikkat: Göstergenin düzgün çalışması için "MQL5" klasörünü terminal dizinine kopya
TW Volume Signal Pro MT4 , gelişmiş yapay zeka teknolojileri ve özel akıllı algoritmalar kullanarak altın piyasasında daha güvenli işlem yapmanıza olanak tanır ve size benzersiz ve eşi benzeri olmayan bir işlem deneyimi sunar.
Altın piyasasında yüksek doğrulukta ve olağanüstü işlem sinyalleri mi arıyorsunuz? TW Volume Signal Pro MT4 ile profesyonel bir yatırımcı olabilir ve altın piyasasında büyük başarı elde edebilirsiniz. Öyleyse, ücretsiz deneyin!
TW Volume Signal Pro MT4'in Temel Özelli

Arbitrage Indicators is a professional and easy-to-use Forex trading indicator that uses the best trading principles of the latest AI arbitrage models. This indicator provides accurate buy and sell signals. Applies to currency pairs only. It has six different metrics options, MACD, KDJ, RSI, CCI, RVI, DEMARK. It can be freely switched by users, and intuitively shows the direction and reversal signal of the currency pair. When the two lines cross colors, the currency has a high probability of rev
AI Fibonacci Indicators (Non-Redraw) is a professional and easy-to-use AI fully automated Fibonacci generator Forex trading indicator that uses the latest AI technology to automatically identify accurate Fibonacci positions on charts and automatically plot them on charts. This indicator provides accurate Fibonacci important price positions. Applicable to any currency pair and other products. It has seven function switches, There are five different Fibonacci types (" Fibonacci retracement line "
VSA - P (Volume Spread Analysis) Period-Based Histogram is a tool that visually represents market volume dynamics using Volume Spread Analysis principles, with a focus on highlighting key volume changes over specific time periods. The histogram captures changes in volume and price spread relationships in real-time, enabling traders to detect early signals of accumulation, distribution, and shifts in buying or selling pressure.
Indicator is non repainting and working with real-time on tick data.

The SYMBOL MANAGER symbol change indicator is an effective tool designed to enhance trading convenience and significantly simplify the trader's experience.
This indicator allows users to switch seamlessly between currency pairs and timeframes within a single open window of the trading terminal. Importantly, when switching, the associated template, including indicators and current chart settings, is automatically duplicated, ensuring a consistent trading environment.

AI Scalper, algoritmalar ve yapay zeka teknolojileri kullanarak Forex piyasasında ticareti optimize eden bir göstergedir. Bu gösterge, ticaret stratejilerinizi mevcut piyasa koşullarına uyarlamanıza ve kârınızı maksimize etmenize olanak tanıyan iki TakeProfit seviyesi sunar. AI Scalper'ın Ana Özellikleri: Two levels of TakeProfit: Piyasa durumuna bağlı olarak ticaret esnekliği sağlamak için farklı kâr hedefleri belirleyin. Automatic StopLoss calculation: Gösterge, mevcut volatiliteye day
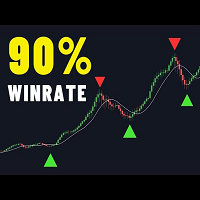
There are many linear regression indicators out there, most of them draw lines or channels, but this one actually draws a chart. This indicator also alow user show MA line on chart. So buy signal is when red candle and crossdown with MA line and vice versal. Following MA type is supported: SMA EMA RMA WMA This simple mineset but powerfull KISS - Keep it simple, stupid :D
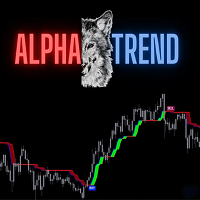
AlphaTrend is a brand new indicator which inspired by Trend Magic. In Magic Trend we had some problems, Alpha Trend tries to solve those problems such as:
1-To minimize stop losses and overcome sideways market conditions.
2-To have more accurate BUY/SELL signals during trending market conditions.
3- To have significant support and resistance levels.
4- To bring together indicators from different categories that are compatible with each other and make a meaningful combination regarding momen
ROC (Rate of Change) indicator tracks the price movement dynamics by measuring the percentage change between the current price and a previous value over a specified time frame (based on Demark logic). This histogram identifies the speed of trend changes, enabling early recognition of overbought or oversold conditions, reversals in the market. The ROC is a useful tool for traders focused on trend-following as well as short-term strategies.
Indicator is non repainting and working with real-time o

Morning Star PRT göstergesi sabah düz kırılma ilkesini kullanır. Gösterge sabah düz seviyelerini görüntüler ve olası hedefleri gösterir. Göstergeye ek bir Fibonacci seviyesi eklenmiştir ve ayrıca ayarlarda belirtilen her iki hedef seviyesinin ve gece düz seviyesinin kesişimi hakkında sesli uyarılar vardır.
Morning Star PRT göstergesi gecenin sonunda bir gece düz kanalı ve yukarı ve aşağı iki Fibonacci fiyat seviyesi oluşturur. Bu seviyeler hem hedef hem de geri dönüş seviyeleri olarak düşünüle
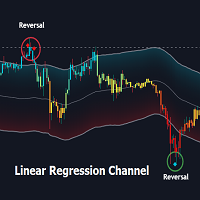
Overview:
The Linear Regression Channel Indicator is a versatile tool designed for Metatrader to help traders visualize price trends and potential reversal points. By calculating and plotting linear regression channels, bands, and future projections, this indicator provides comprehensive insights into market dynamics. It can highlight overbought and oversold conditions, identify trend direction, and offer visual cues for future price movements.
Key Features:
Linear Regression Bands: ( fig
MT4 için "Binary Pin-Bar" göstergesi, M1 ve M5 zaman dilimlerinde ikili opsiyon ticareti için tasarlanmıştır ve herhangi bir döviz çifti ile çalışır. Pin-bar mum çubuğu yeni bir zirve (yükseliş trendi için) veya dip (düşüş trendi için) oluşturduğunda giriş sinyalleri oluşturur. Özellikler: Sinyaller, grafikte tampon oklar olarak görünür: Mavi bir ok Alış sinyalini (Buy) gösterir ve kırmızı bir ok Satış sinyalini (Sell) gösterir. Her döviz çifti için performans istatistikleri grafikte gösterilir

Gösterge Arz ve Talep bölgeleri PRT– grafiğin arz ve talep bölgelerini işaretlemek için kullanılan özel bir araçtır. Gösterge, direnç/destek seviyelerini ve arz/talep bölgelerini vurgulayan grafikte çizgiler ve dikdörtgenler çizer. Kolaylık olması açısından, hem çizgiler hem de şekiller farklı renklerle boyanmıştır, böylece sinyaller birbirinden kolayca ayırt edilebilir. Gösterge yalnızca yeni seviyeleri, yani henüz kullanılmamış ve fiyatın henüz bunları aşmamış seviyeleri çizer. Hem yeni başla

Bu gösterge, grafik desenlerini belirlemek isteyen yatırımcılar için güçlü bir araçtır ve bunu işlem stratejilerine dahil etmenin sayısız faydası vardır. Bu araç, finansal piyasalardaki potansiyel eğilimleri ve geri dönüşleri etkili bir şekilde belirler ve işaret eder, böylece işlem karlılığını artırır. Gelişmiş algoritması sayesinde gösterge, piyasa verilerini doğru bir şekilde analiz edebilir ve yatırımcılara bilinçli kararlar almalarına yardımcı olabilecek değerli bilgiler sağlar. Bu gösterg

AF Global Investment ++ MOD by CriptoForex Nome do robô: AFSID PRO GLOBAL INVESTMENT++
Plataforma: MetaTrade 4
Ano de lançamento / Update: 2025
____ Requerimento de Capital ____ Forex: XAU/USD Conta cent: U$ 150 ~ U$ 200 Conta Standard: U$ 15,000 ~ U$ 20,000 Lucro projetado: 8% ~ 13% ao mês. Forex: EUR/USD, GBP/JPY, Conta cent: U$ 150 ~ U$ 200 Conta Standard: U$ 15,000 ~ U$ 20,000 Lucro projetado: 5% ~ 10% ao mês.
Cripto: BTC/USD Conta Standard: 15,000 ~ 25,000 Lucro projetado: 10% ~ 20% ao
MetaTrader mağazası, alım-satım robotları ve teknik göstergelerin benzersiz bir deposudur.
Yatırımcılara sunduğumuz benzersiz hizmetler hakkında daha fazla bilgi edinmek için MQL5.community - Kullanıcı notunu okuyun: alım-satım sinyallerini kopyalama, freelancerlar tarafından geliştirilen özel uygulamalar, ödeme sistemi aracılığıyla otomatik ödemeler ve MQL5 Bulut Ağı.
Alım-satım fırsatlarını kaçırıyorsunuz:
- Ücretsiz alım-satım uygulamaları
- İşlem kopyalama için 8.000'den fazla sinyal
- Finansal piyasaları keşfetmek için ekonomik haberler
Kayıt
Giriş yap
Gizlilik ve Veri Koruma Politikasını ve MQL5.com Kullanım Şartlarını kabul edersiniz
Hesabınız yoksa, lütfen kaydolun
MQL5.com web sitesine giriş yapmak için çerezlerin kullanımına izin vermelisiniz.
Lütfen tarayıcınızda gerekli ayarı etkinleştirin, aksi takdirde giriş yapamazsınız.