Extreme Breakout Signal
- Göstergeler
-
Yonggang Shang
 **********************************************************************
Join Channel: http://t.me/algo_forex_trading
********************************************************************** - Sürüm: 1.50
- Güncellendi: 3 Mart 2025
- Etkinleştirmeler: 10
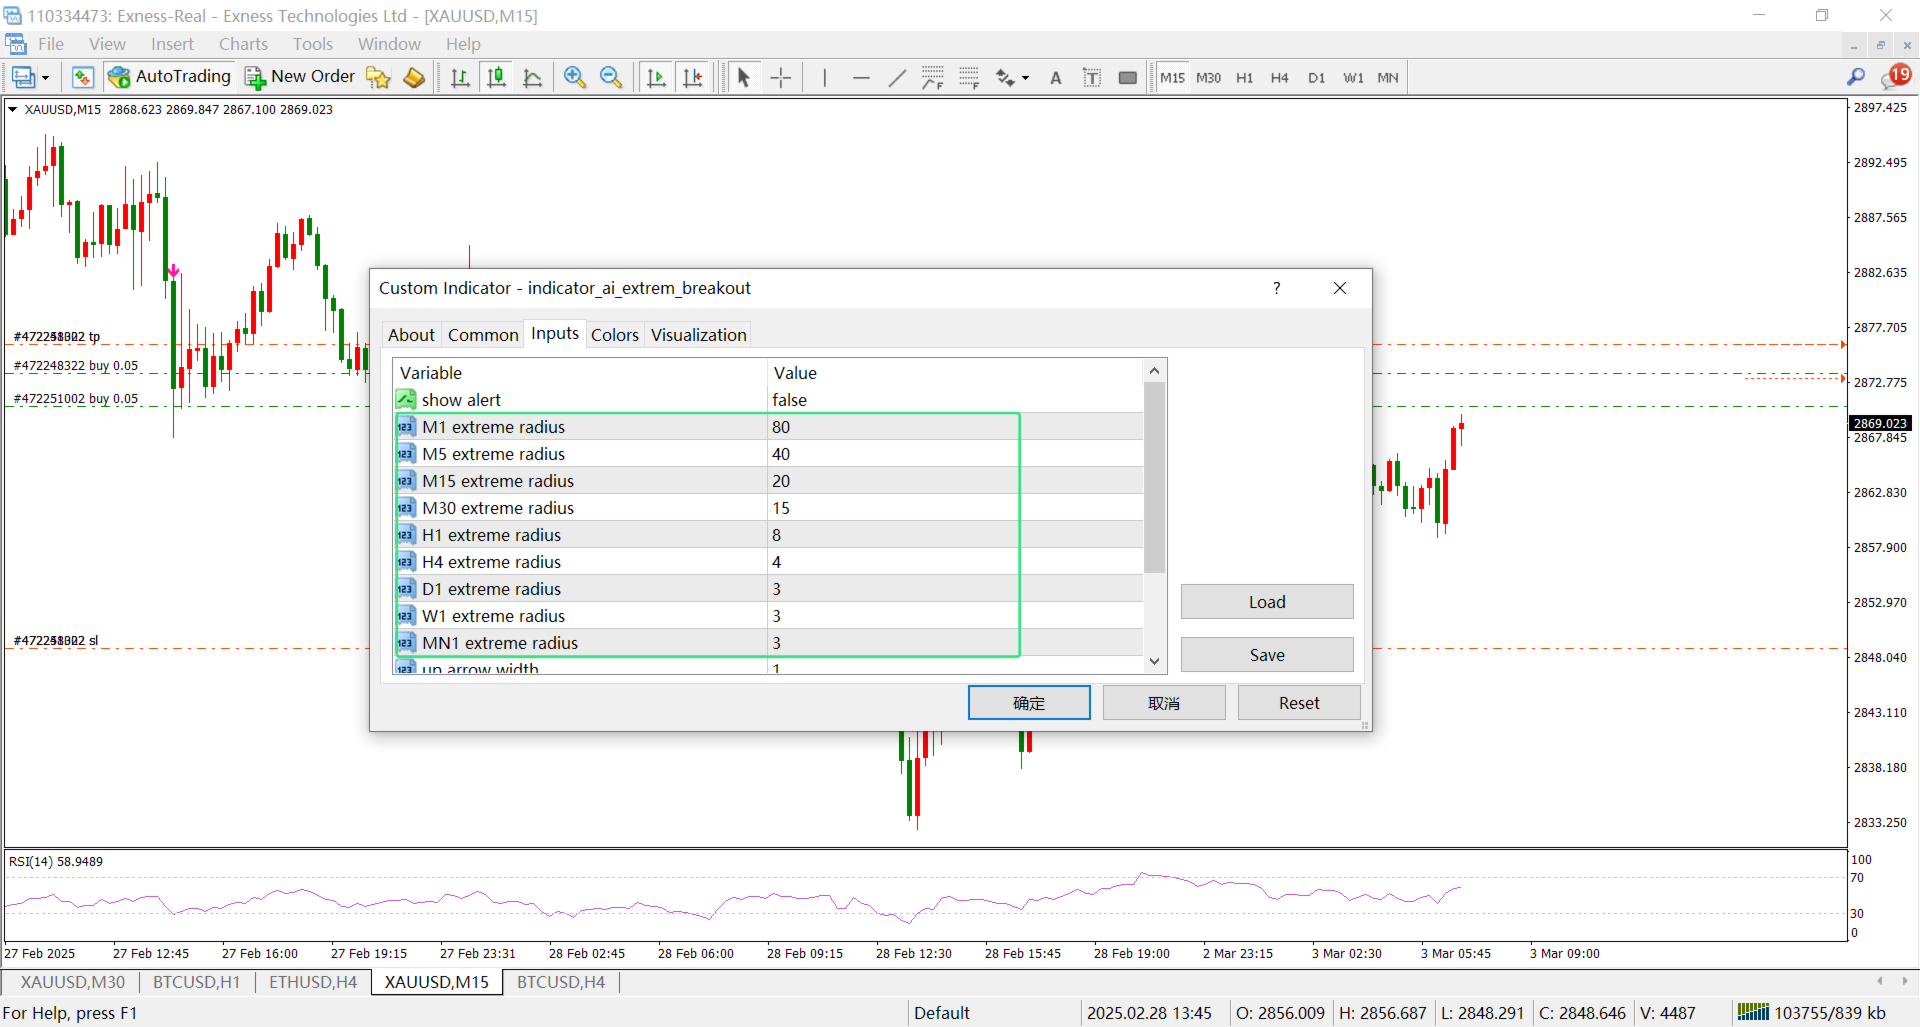
Extreme Breakout Signal is a trading strategy based on price breaking through key support or resistance levels. It indicates potential trend shifts, allowing traders to capture new upward or downward movements.
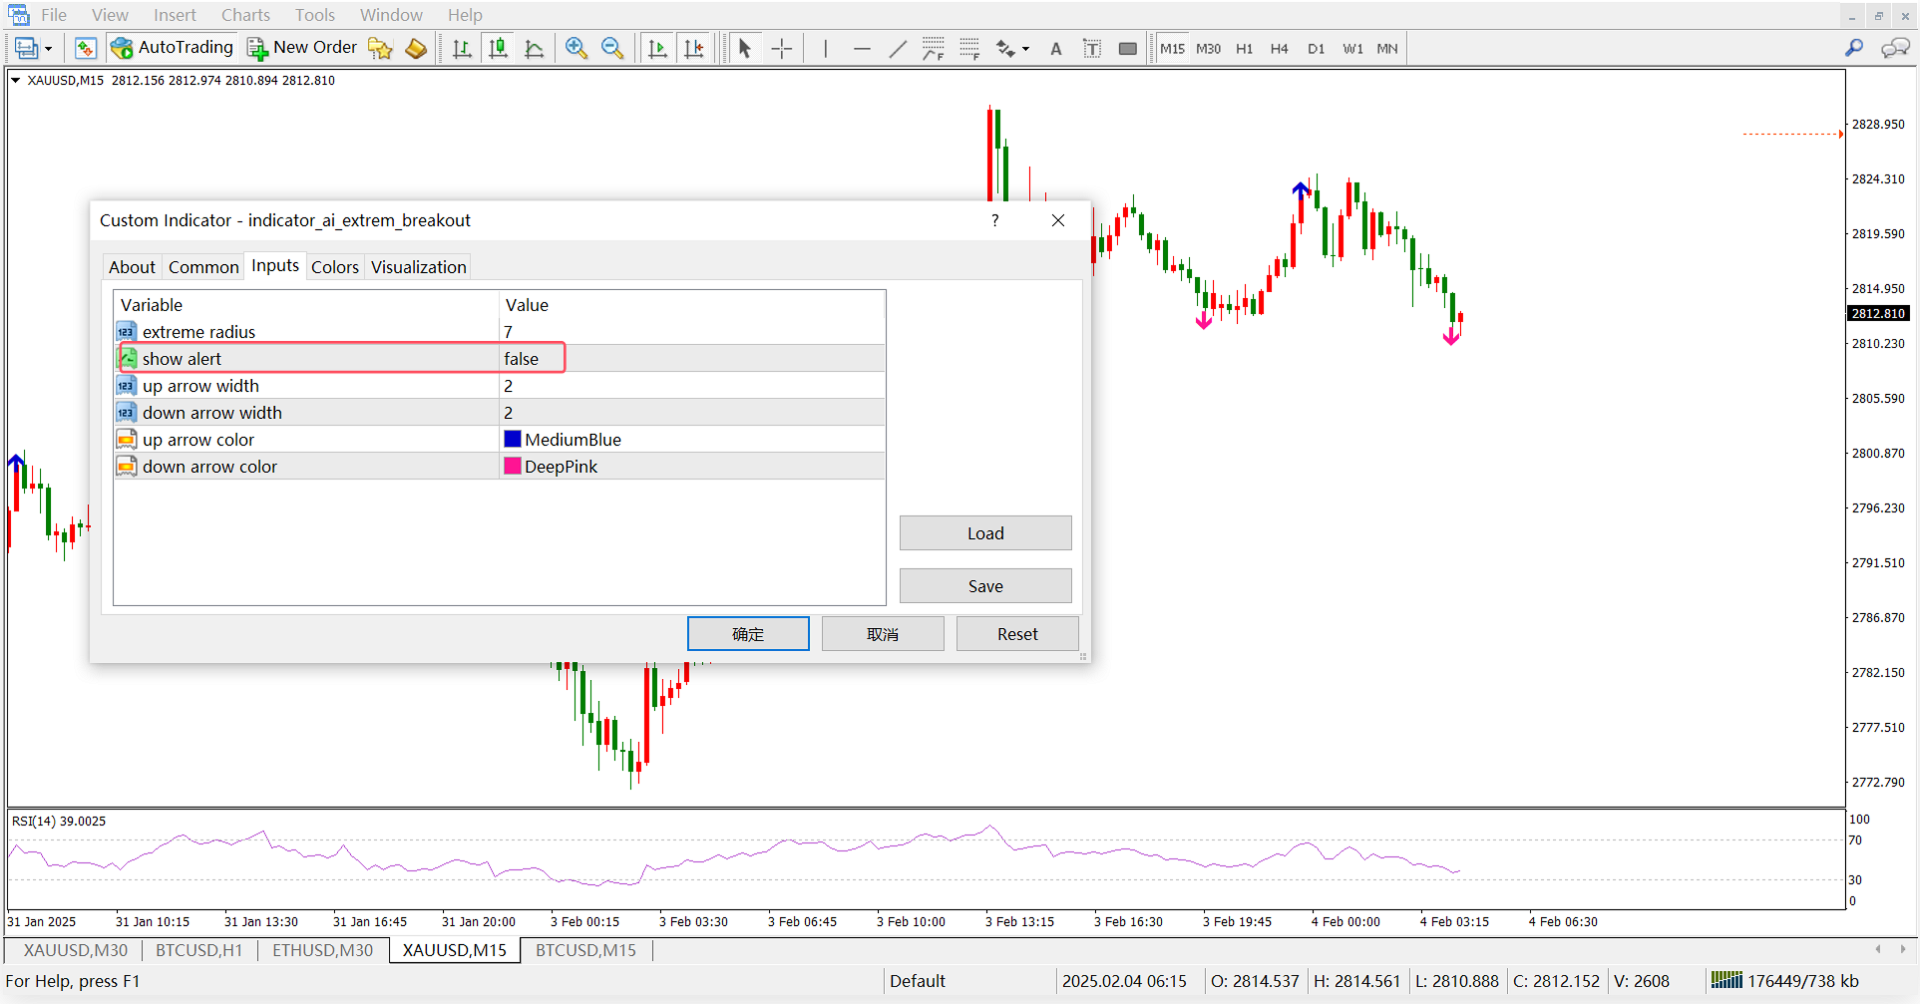
Parameter - extreme radius: extreme radius(Different parameters can be set for different periods)
Key Principles
- Support & Resistance: Prices often reverse near these levels; breaking them may signal a new trend.
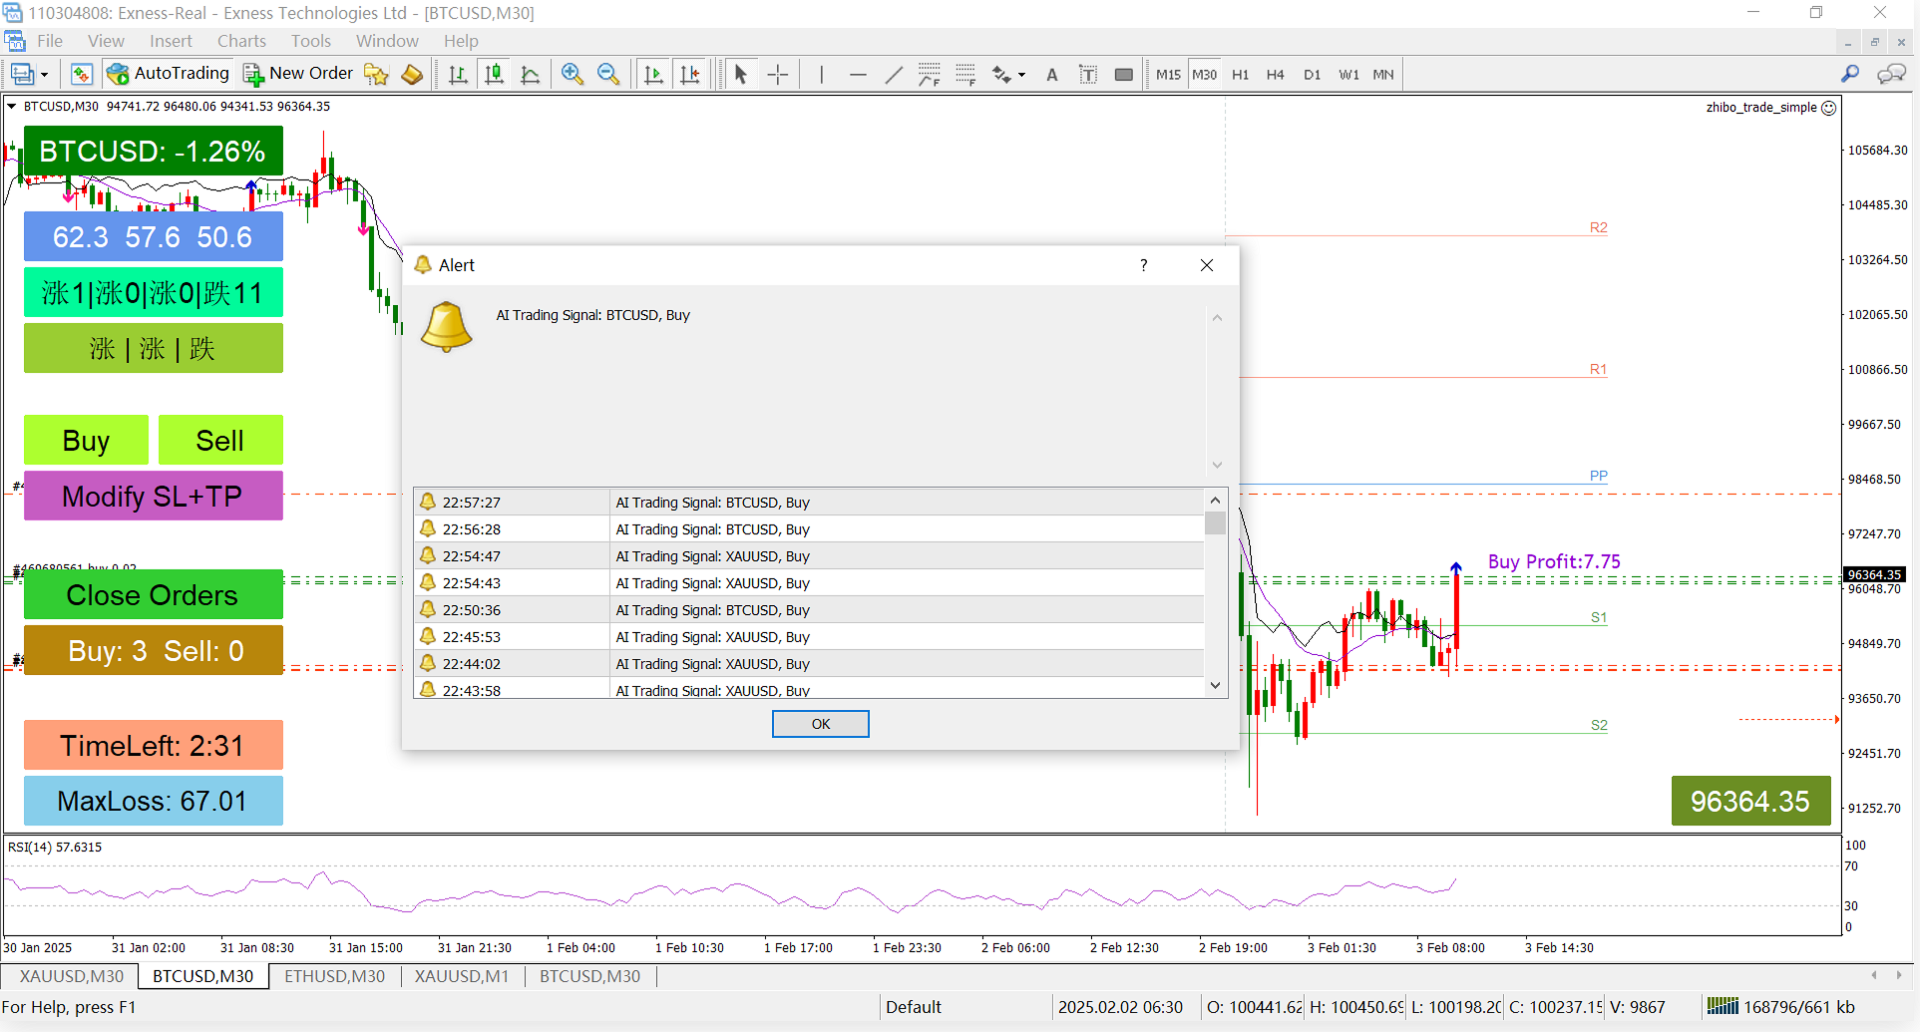
- Confirmation: Use volume or other indicators to verify the breakout's validity.
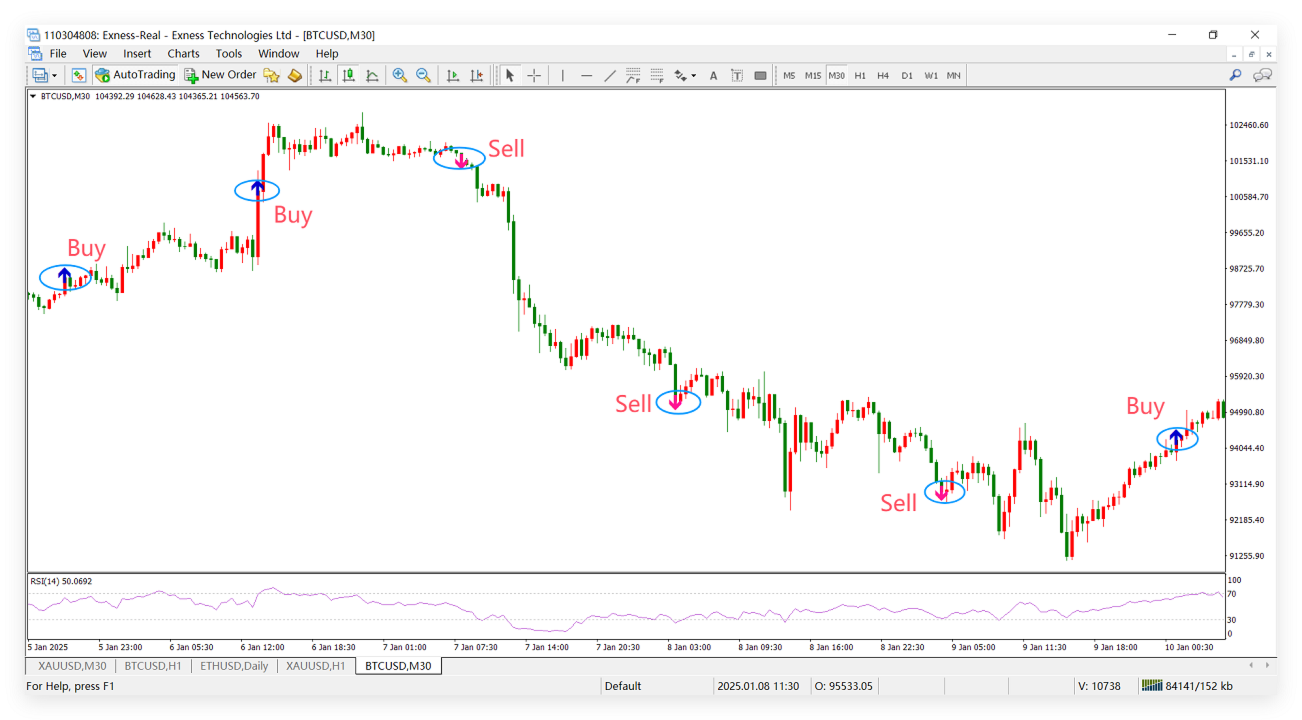
Signal Types
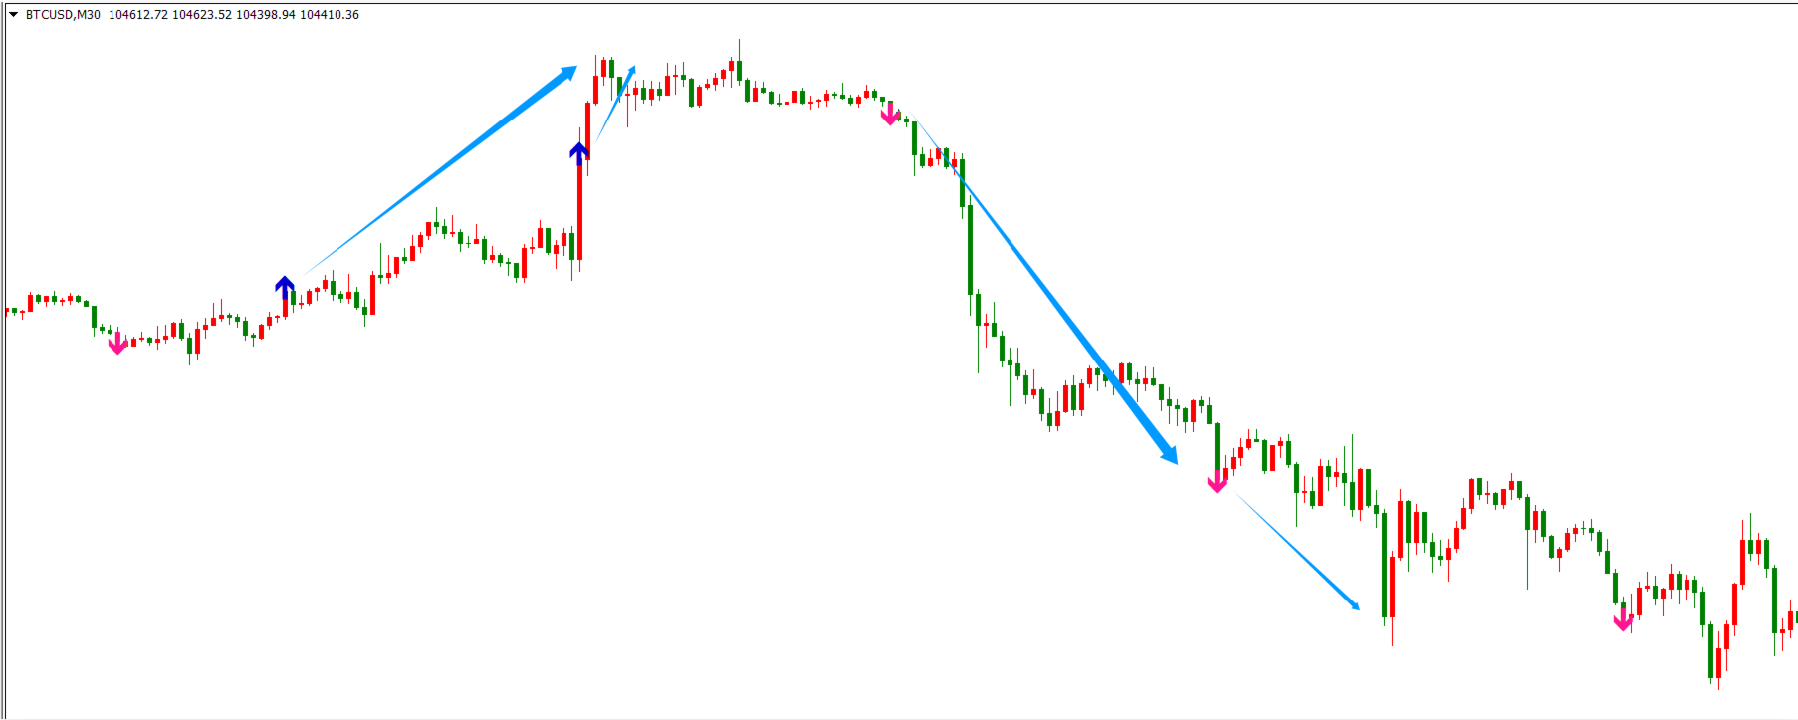
- Buy Signal: Price breaks above resistance, suggesting an uptrend.
- Sell Signal: Price breaks below support, suggesting a downtrend.
Application
- Breakout Confirmation: Combine with indicators like volume, RSI, or MACD.
- Stop Loss & Take Profit: Place stop loss near the previous level and adjust take profit based on market conditions.
Pros and Cons
- Pros: Helps capture early trends and works across various markets.
- Cons: High risk of false breakouts, less effective in ranging markets.
Conclusion: Breakout signals are powerful tools for identifying new trends but should be used with confirmation to avoid false signals.