YouTube'dan Mağaza ile ilgili eğitici videoları izleyin
Bir ticaret robotu veya gösterge nasıl satın alınır?
Uzman Danışmanınızı
sanal sunucuda çalıştırın
sanal sunucuda çalıştırın
Satın almadan önce göstergeyi/ticaret robotunu test edin
Mağazada kazanç sağlamak ister misiniz?
Satış için bir ürün nasıl sunulur?
MetaTrader 4 için ücretli teknik göstergeler - 107

Download the free version here. Divergence Divergence refers to when the price of a currency pair moves in one direction while the trend indicator is moving in the opposite direction. With divergence, there can be positive and negative signals. Divergences in Forex trading are quite common signals of technical analysis. These are basic early Forex signals indicating the trend reversal and filter false signals. Application of this indicator It is usually not easy to detect divergences by the t

The indicator analyzes the chart as a mathematical function with X-time and Y-price axes. Time is presented in bars, price in pips. The purpose of the analysis is to give the user a signal to action at the moment when the function forms a recoilless movement in one direction over a certain period of time. The indicator parameters must be selected for each currency pair, since the price function is formed differently for each currency pair.
Shows favorable moments for entering the market with

Forex Indicator " Evening Star pattern" for MT4 Indicator "Evening Star pattern" is very powerful indicator for Price Action trading: No repaint, No delays; Indicator detects bearish Evening Star patterns on chart: Red arrow signal on chart (see pictures) P C, Mobile & Email alerts are included Also its brother - bullish " Morning Star pattern" indicator is available (follow the links below) Indicator " Evening Star pattern" is excellent to combine with Support/Resistan

Extreme Value Sniper is a detrended price indicator Indicator finds the potential reversal levels by checking value ranges and price cycles. ***Indicator does NOT repaint so it provides accurate NO REPAINT REVERSAL SIGNALS***
MT5 Version of the product : https://www.mql5.com/en/market/product/114550
It shows the overbought and oversold levels using the average range. Overbought Levels are between 4 and 10 Oversold levels are bewtween -4 and -10
Those levels can be used as a reversal l

DESCRIPTION
The Indicator Target5X Plus provides a robust framework for identifying opportune moments to enter trades, with the potential to achieve significant returns ranging from 2x to 5x. Employing sophisticated analysis, Target5X Plus meticulously delineates buy and sell zones, empowering traders to capitalize on lucrative market opportunities with precision.
TRADING with Indicator Target5X Plus
Utilizing Target5X Plus is intuitive and streamlined. The indicator signals a buy zone wh
Download the free USDJPY version here.
MACD Indicator The Moving Average Convergence and Divergence (MACD) is a trend following momentum indicator which shows the relationship between two moving averages that we chose and configure them on the indicator. The MACD is calculated by subtracting the 26-period exponential moving average and the 12 period D.A.M. These are the default parameters when you put the MACD indicator on the charts, and the period is usually 9 which means the last 9 candle

This indicator is, without a doubt, the best variation of the Gann Angles among others. It allows traders using Gann methods to automatically calculate the Gann angles for the traded instrument. The scale is automatically calculated when the indicator is attached to the chart. When switching timeframes, the indicator recalculates the scale for the current timeframe. Additionally, you can enter your own scales for the Gann angles. You can enter your own scales either for both vectors or for each

The ZigZag Wave Entry Alert (ZWEA) is a sophisticated technical indicator designed by Azad Gorgis, aiming to assist traders in identifying optimal entry points within the volatile forex market. This indicator specifically targets the EUR currency pairs, leveraging ZigZag patterns to predict future price movements. The ZWEA operates by analyzing historical price data to detect significant price changes that deviate beyond a predefined threshold, effectively filtering out minor price fluctuations
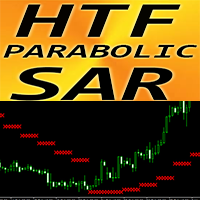
Forex Indicator Parabolic SAR Higher Time Frame for MT4 Upgrade your trading methods with great auxiliary HTF PSAR indicator for MT4. H TF means - H igher Time Frame PSAR is used to determine trend direction and potential reversals in price movement. This indicator is great to use for Trailing Stop purpose If PSAR is located above the price - it is downward trend If PSAR is located below the price - it is upward trend This indicator is excellent to combine with price action entrie
Space signals sinyal göstergesi, Forex ve İkili opsiyon piyasalarında işlem yapmak için yeni gelişmemdir. Göstergenin algoritması, trendi takip etmesi ve fiyatın düzeltici hareketinin sonu için sinyaller vermesi için yazılmıştır.
Ayarlarda, sinyallerin periyodunu kendiniz ayarlayabilirsiniz. "Dönem" değişkenindeki değer ne kadar fazlaysa, sinyaller o kadar az olur. Ancak doğal olarak daha kaliteli olacaklar.
Grafikteki okların kodlarını, çubuklardan olan mesafeyi, renklerini ve kalınlıklar
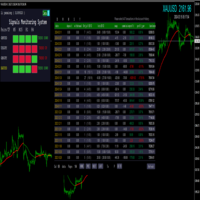
MT4 multi-variety multi-period signal monitoring system
Load to the indicators folder
Recommended loading chart: GBPUSD/XAUUSD/GBPJPY/USDJPY
Recommended loading period: M5/M15/H1/H4
Select all history by account history
- Statistics: Date, deposit, withdrawal, total number of transactions, number of transactions - long, number of transactions - short, total number of transactions, number of transactions - long, number of transactions - short, interest, commission, profit and loss, pro

Smooth Heikin Ashi provides a more smoothed signal of bull or bearish trends than regular Japanese candlesticks, or even the standard Heikin Ashi candles. Heikin Ashi as an alternative candlestick pattern that has been in use since its invention in Japan back in the 1700s. On normal Japanese candlesticks, there is a lot noise with mixed bearish and bullish candles side by side, even during trends. Heikin Ashi reduces this noise leaving an easier visual representation of trends. This indicator is

The Avia indicator analyzes the chart as a mathematical function with X-time and Y-price axes. Time is represented in bars and price in pips. The purpose of this indicator is to give the trader a signal to act at the moment when the function forms a recoilless movement in one direction over a certain period of time. Here are the main characteristics and settings of this indicator:
Peculiarities: Non-rebound movement : The Avia indicator looks for moments when the price moves in one direction

The " Vertical Levels " indicator for the Forex market is a tool for displaying vertical levels on a price chart. These levels can be useful for a trader, as they help identify significant points in price movement and potential reversal or trend continuation zones.
Peculiarities:
Vertical Levels: The "Vertical Levels" indicator allows you to display vertical lines on the chart, indicating certain levels. These levels can be adjusted using input parameters. Setting options: Length : Length o

Retracement Reversal and Support and Resistance Pro (for non pro version Click here ) is based on a formula used by Proprietary trading firms and other big institutions on WallStreet including on my Company and used by my traders here in the capital of the world. This indicator will create Red and Green arrows on a possible mayor Retracement level, Reversal Level and future Support and Resistance levels and Yellow arrows on a possible m i nor Retracement level, Reversal Level and future Suppo
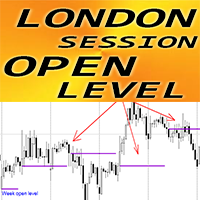
Forex Indicator "London Session Open Level" for MT4 Indicator "London Session Open Level" is very useful auxiliary indicator for intraday trading Session open price level is so important because very often price returns back to that area during the day. Indicator shows you London session open price level daily for each day Also indicator shows week open level on Mondays It is useful for intraday traders to set up targets or use as support/resistance area. // More great Expert Advisors and
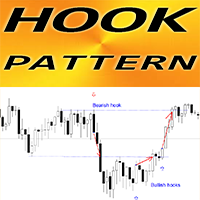
Forex Indicator " Hook pattern" for MT4 Indicator " Hook pattern " is very powerful indicator for Price Action trading : No repaint, No delays; Indicator detects bullish and bearish Hook patterns on chart: Bullish Hook - Blue arrow signal on chart (see pictures) Bearish Hook - Red arrow signal on chart (see pictures) P C, Mobile & Email alerts are included Indicator " Hook pattern" is good to combine with Support/Resistance Levels: https://www.mql5.com/en/market/prod
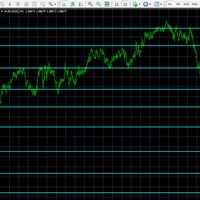
A powerful chart indicator which intelligently analyses Index, FX & Commodity prices to identify the strongest support and resistance price boundaries. Each line shows where prices consistently close, while the frequency of these matching prices is quoted to reflect each boundary strength. Use these predictive boundaries to identify pivot points, resistance and support levels for crossover, trending, reversal and channel strategies. For FX pairs, set volatility filter = 1 For Indices & Commodi
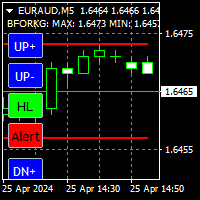
Very useful indicator, you won't be able to be without it. Essential for scalping. It shows rebound levels, top and bottom, forming a fork that surrounds the price. Each level has two blue controls associated to change it, one green control for rebound mode: High/Low or Open/Close, and a red breakage alert control. The values of each level, and the distance between levels in pips, are shown at the top left. Features: -T wo independent modes of operation: High/Low, Open/Close. -When one level
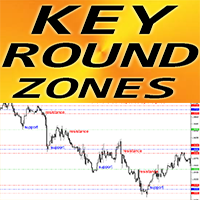
Forex Indicator "Key Round Zones" for MT4 Indicator "Key Round Zones" is must have auxiliary indicator for traders who take support/resistance into consideration 1000 and 500 round levels are respected by the price - price rebounds from them very often Major 1000 levels also have strong Support/Resistance zones (100 points in each side) around it Also 1 000 and 500 round levels are good to place Take Profits (in front of round level) and SL (behind the round level) These levels are part
Forex ve İkili opsiyon ticareti için gösterge, Basit Hareketli Ortalamanın standart Mt4 göstergesine dayanarak yazılmıştır. Ancak standart göstergeden fark, trendin durumuna bağlı olarak çizgilerinin farklı renklerde yeniden boyanmasıdır. Renk yeşilse, satın alma eğilimi vardır. Eğer kırmızıysa, o zaman satılık. Trend aşamasındaki bir değişiklik sırasında, çizgilerin ortasındaki grafikte bir arabellekle birlikte sesli bir uyarı belirir. Böylece, seçilen enstrümanda ve zaman diliminde trendin dur

UPDATED VERSION INCORPERATES FIBONACCI FOR BETTER LEVELS AI Powered Price Clustering" is a custom indicator that integrates k means and Fibonacci. This powerful tool provides traders with valuable insights into price clustering patterns, facilitating more informed trading decisions. How it works: With "AI Powered Price Clustering," traders gain access to: A K means algorithm for precise analysis of price clustering patterns. Identification of key Fibonacci levels and centroids for enhanced tech
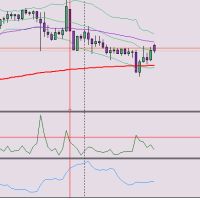
How many time is Candle's Range bigger than Atr indicator? HERE IS THE ANSWER YOU WERE LOOKING FOR!! This awesome indicator is meant to better read market and keep Valuable informations for a good trading payload. let me know if you like it in comments, if it's usefull and if you have hints to make it better i would appreciate it.
this indicator measures proportion between range and atr
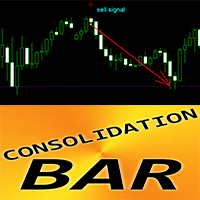
Forex Indicator Consolidation Bar Pattern for MT4 Indicator "Consolidation Bar " is very powerful breakout-focused indicator for Price Action trading Indicator detects price consolidation in narrow area during 1 bar and shows: Breakout direction, Pending order and SL locations Bullish Consolidation Bar - Blue arrow signal on chart (see pictures) Bearish Consolidation Bar - Red arrow signal on chart (see pictures) No repaint; No delays; High R/R ratio (reward/risk); PC, Mobile & Em
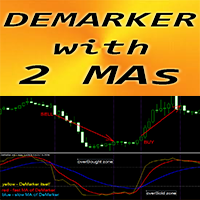
Forex Indicator " DeMarker and 2 Moving Averages" for MT4 DeMarker oscillator curve indicates the current price position relative to previous highs and lows during the indicator calculation period "DeMarker and 2 Moving Averages" Indicator allows you to see Fast and Slow Moving Averages of DeMarker oscillator I t is great to take Sell entries from OverBought zone (above 0.7) and Buy entries from OverSold zone (below 0.3) I ndicator is very easy to set up via parameters, i
Indicator Name: TrendMaster Description: TrendMaster is a powerful trading indicator designed to identify and capitalize on market trends with high accuracy. By analyzing a combination of technical indicators including Relative Strength Index (RSI), Stochastic Oscillator, and Average Directional Index (ADX), TrendMaster provides clear buy and sell signals, helping traders navigate both bullish and bearish market conditions. The indicator's advanced algorithm filters out noise and false signals,

The EntryHub system by MQ4.org is designed for Forex trading and is available as an indicator for the popular MetaTrader 4 (MT4) platform. Let’s delve into its details: Forex Entry Point System : The Forex Entry Point System is an MT4 indicator that assists traders in identifying potential entry points for their trades. It provides signals based on specific market conditions, helping traders make informed decisions. While it’s essential to note that no indicator is fo

The RSI Advanced tool will help traders capture trends and optimal entry points by:
- Enter a Buy order when the green line crosses the yellow line. Provided that the yellow line is near line 32 or 20 - Enter a Sell order when the green line crosses the yellow line. Provided that the yellow line is near line 68 or 80
Additionally, you can combine it with the convergence divergence that occurs at the green line. **When you purchase the Mastering the RSI MT4 or Mastering the RSI MT5 indicator

SmartSignal Sniper: En İyi Ticaret Ortağınız SmartSignal Sniper ile kesin alım satım sinyallerinin gücünü keşfedin. Hassas alım satım sinyalleri sağlamak üzere tasarlanan bu ileri düzey araç, tüm seviyelerdeki tüccarların finansal piyasalarda güvenle ve netlikle gezinmesini sağlar. Ana Özellikler: Mikrometrik Hassasiyet: SmartSignal Sniper, tüccarların piyasada kârlı fırsatları tespit etmelerine yardımcı olmak için gelişmiş algoritmaları kullanarak kesin alım satım sinyalleri sağlar. Anlık Yürüt
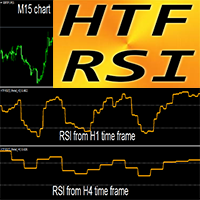
Forex Indicator HTF RSI Oscillator for MT4 RSI itself is one of the best and most popular oscillators. H TF means - H igher Time Frame. Overbought zone is when the RSI is above 70 and Oversold one - when it is below 30 RSI provides information regarding bullish and bearish price momentum
This indicator is excellent for Multi-Time Frame trading systems with Price Action entries or in combination with other indicators. HTF RSI Indicator allows you to attach RSI from Hi
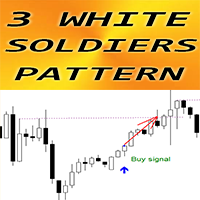
Forex Indicator " 3 White Soldiers pattern" for MT4 Indicator "3 White Soldiers pattern" is very powerful for Price Action trading: No repaint, No delays; Indicator detects bullish 3 White Soldiers patterns on chart: Blue arrow signal on chart (see pictures) P C, Mobile & Email alerts are included Also its brother - bearish "3 Black Crows pattern" indicator is available (follow the links below)
Indicator "3 White Soldiers pattern" is excellent to combine with Support/Resistanc
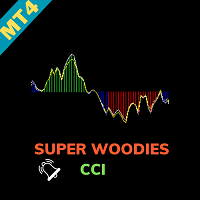
Super Woodies CCI Indicator - Enhance Your Trading Precision Step into the realm of precision trading with the "Super Woodies CCI Indicator" for MetaTrader 4. This advanced tool, inspired by Woodie's CCI, is designed to provide you with clear insights into market trends, enabling you to make well-informed trading decisions. Basic Details : Indicator Type : Super Woodies CCI Indicator Key Metrics : Real-time CCI (Commodity Channel Index) analysis for price trends. Customization : Fully customizab
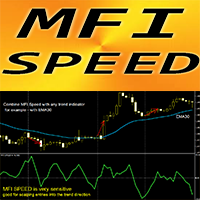
Forex Indicator "MFI Speed" for MT4 The calculation of this indicator is based on equations from physics . MFI Speed is the 1st derivative of MFI itself Money Flow Index (MFI) is a technical oscillator which uses price and volume data for identifying oversold and overbought zones
MFI Speed is good for scalping momentum entries into the direction of main trend Use it in combination with suitable trend indicator , for example standard EMA (as on pictures) MFI Speed indicator
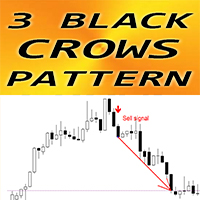
Forex Indicator " 3 Black Crows pattern" for MT4 Indicator "3 Black Crows pattern" is very powerful for Price Action trading: No repaint, No delays; Indicator detects bearish 3 Black Crows patterns on chart: Red arrow signal on chart (see pictures) P C, Mobile & Email alerts are included Also its brother - bullish "3 White Soldiers pattern" indicator is available (follow the links below)
Indicator "3 Black Crows pattern" is excellent to combine with Support/Resistanc

Adaptive Market Dynamics Indicator (AMDI) is an innovative tool for traders across all financial markets. This indicator is designed to provide traders with a deep understanding of market dynamics and adaptive trading signals based on current market conditions. Key Features and Benefits: Adaptive Analytics : AMDI can automatically adapt to changing market conditions, allowing traders to effectively adjust their strategies in real-time. Multifactor Analysis : The indicator offers a comprehensiv

Forex Indicator "HTF Bollinger Bands" for MT4 Upgrade your trading methods with the professional indicator " HTF Bollinger Bands" for MT4. H TF means - H igher Time Frame Bollinger Bands is one of the best indicators on the market - perfect tool for trading Approximately 90% of price action occurs between the two bands HTF Bollinger Bands indicator is excellent for Multi-Time Frame trading systems with Price Action entries or in combination with other indicators.. This
'Zoro LITE' is a reversal strategy based MT4 indicator with advance pre-alert system. Its an 100% non repaint indicator with an average accuracy of about 70-95% in a ranging market. --------------------------------------------------------- Features: Neural Network based Advance price action algorithms Pre-alert (get ready) signals Non-delay indications 24/7 signals OTC markets supported Auto-trading supported 100% Non repaint 100% No lag No recalculating Lifetime license -----------------------
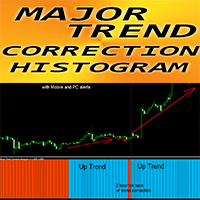
Forex Indicator "Major Trend Correction Histogram" for MT4 Major Trend Correction Histogram indicator was designed to detect big trends Indicator can be in 2 colors: Red for bearish trend and Blue for bullish one (colors can be changed) At least 10 consecutive histogram columns of the same color means beginning of new trend Indicator has built-in Mobile and PC alerts
Parameter "Period", responsible for indicator's sensitivity
HOW TO USE indicator:
1) Check for at least 10 conse
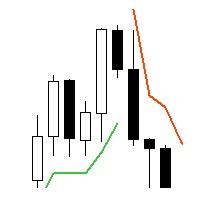
Supertrend - невероятно мощный и универсальный индикатор, предназначенный для помощи трейдерам в определении текущего тренда на конкретном торговом инструменте. С помощью двух встроенных индикаторов, Average True Range и Standard Deviation, трейдеры могут выбрать наиболее подходящий индикатор для своей стратегии торговли. Пользователи также могут настроить период этих индикаторов и выбрать цену (Close, High, Low, Open, Weighted), к которой он должен быть применен, с Typical price в качестве опци

Trend Filter Pro
Trend filter indicator.
Very good filter for your trading system, I recommend to use it together with - System Trend Pro and Professional Trade Arrow
The indicator no repaint!!!
Settings:
Change the Period parameter for better filtering ( default is 90)
Any questions? Need help?, I am always happy to help, write me in private messages or
In Telegram: https://t.me/Trader35_Admin

Trop is a trend indicator that has several important advantages. It helps to pinpoint both new and existing trends in the market. One of its key advantages is its quick adjustment and responsiveness to changes in schedule. The effectiveness of the indicator depends on the set CalcBars period. The longer this period, the smoother the indicator displays the trend line. On the other hand, as the period decreases, the indicator takes into account more market noise, which can be useful in generating

In the world of trading, one of the main concerns is finding a reliable trading system. Meet the TrendEdge Channel indicator - your reliable companion in this search. Developed based on complex mathematical calculations, this indicator predicts the most likely short-term price movements.
TrendEdge Channel is designed specifically to identify trends in price movements. Thanks to it, you can quickly determine not only the direction of the trend, but also the levels of interaction between buyers
The TrendScope Pro indicator views the chart as a function with the X-axis representing time and the Y-axis representing price, expressed in bars and pips respectively. The main objective of the indicator is to provide users with signals for actions when the function forms continuous movement in one direction over a specific period of time. The indicator parameters need to be adjusted individually for each currency pair, as the price function varies for different pairs.
The indicator provides

Spread Pulse göstergesi yatırımcılara grafikteki mevcut spread hakkında bilgi sağlayan etkili bir araçtır. Spread, bir enstrümanın alış fiyatı ile satış fiyatı arasındaki farktır.
Gösterge, grafikte görüntülenen metin biçiminde sunulur. Bu, yatırımcının mevcut spreadi kolayca takip etmesini sağlar.
Spread Pulse göstergesinin ana avantajlarından biri renk görselleştirmesidir. Forma boyutuna bağlı olarak metin rengi değişir. Varsayılan olarak, spread küçük olduğunda metin yeşil olacaktır; b
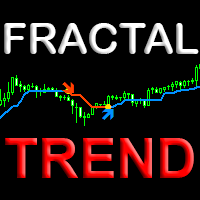
The Fractal Trend indicator visually displays trend changes in price fractals based on the Price Action (PA) principle. The unique algorithm uses the fractal principle of determining a trend change and a new proprietary method of filtering fractals, which gives an advantage in relation to other similar indicators based on MA moving averages. This new approach to trend determination helps to determine with high confidence the trend change points on any financial instrument and on any time frame

The SignalSailor indicator is your reliable assistant in Forex for quick market analysis. It not only reflects the current market condition but also provides valuable signals about the best times to open trades. Market conditions are constantly changing, and to stay ahead, a trader needs to quickly adapt their strategies. This is precisely why the Klaus indicator was created - it will help you accurately determine the direction of the trend on the price chart.
SignalSailor is an indispensable

The TrendTide indicator provides accurate signals about potential market reversals. Its primary purpose is to generate signals for entering and exiting trades. Determining the current market trend is a critically important aspect for traders. The intelligent algorithm of TrendTide efficiently identifies trends, filters market noise, and creates precise entry and exit signals.
This indicator represents an advanced algorithm for visualizing the market trend. It is designed to identify both long

Introducing the Reversal and Breakout Signals
This innovative tool is crafted to enhance your chart analysis by identifying potential reversal and breakout opportunities directly on your charts. It's designed with both novice and experienced traders in mind, providing intuitive visual cues for better decision-making. Let's dive into the key features and how it operates:
### Key Features:
Dynamic Period Settings: Customize the sensitivity of the indicator with use

The Market Sentiment Meter indicator calculates the saturation levels of the price chart. A signal to exit the oversold zone indicates a buying opportunity, and a signal to exit the overbought zone indicates a selling opportunity. Typically, for this indicator you need to set relative values for the overbought (Top) and oversold (Bottom) levels.
Often a good trend can be seen visually on the price chart. However, an experienced trader must clearly understand the current distribution of forces

USDLFX is a currency index of US dollar formulated by LiteForex broker. It is an attempt to create an indicator for USD currency power. The idea has been further extended to other major Forex currencies. These indices are not available on other brokers. There are other currencies AUD CAD EUR CHF GBP NZD JPY Thanks to this indicator, you have an objective view of the selected currency

Introducing High Probability SARs, a classic Forex indicator designed to enhance your trading strategy with its advanced analysis capabilities. High Probability SARs utilizes sophisticated algorithms to identify potential trend reversals with precision. By incorporating the Parabolic SAR indicator, it offers traders valuable insights into market dynamics, allowing for informed decision-making. This innovative tool provides traders with signals based on the Modified parabolic SARs, helping to ide

TrendTrack indicator: Stay on trend easily!
The TrendTrack indicator is designed to analyze price behavior in the Forex market, helping the trader to quickly spot temporary weaknesses or obvious changes in trend direction. Entering the market is only the first step, but maintaining a position is more difficult. With TrendTrack, staying on trend becomes easy!
Peculiarities:
Trend Analysis: The indicator analyzes historical data, providing signals to the trader. The arrow format of the indi

The Trendline Trader indicator is designed to reliably track market trends, ignoring sharp fluctuations and noise in the market. This indicator is suitable for trading on both short and long time intervals due to its ability to filter out sudden price spikes and corrections. It is based on the iLow, iHigh, iMA and iATR indicators, which makes it particularly reliable.
Parameters for setting up the indicator: Length: period for channel calculation and noise filtering. Star: period for determin

History VT Информационный индикатор. Показывает на графике, сразу после открытия сделки, стрелку именно на той японской свече, где позиция открыта.
То есть там, где появилась штрихпунктирная линия открытой сделки, в терминале.
Далее, после открытия сделки, как обычно, трейдер ставит SL и TP и ждёт итога своего выбора направления движения.
После того как сделка закрылась, по « sl » или « tp » или «вручную», индикатор отображает на графике уровни и текстовые сноски параметров сделки.
С

Introduction
One of the patterns in "RTM" is the "QM" pattern, also known as "Quasimodo". Its name is derived from the appearance of "Hunchback of Notre-Dame" from Victor Hugo's novel. It is a type of "Head and Shoulders" pattern.
Formation Method
Upward Trend
In an upward trend, the left shoulder is formed, and the price creates a new peak higher than the left shoulder peak . After a decline, it manages to break the previous low and move upward again. We expect the pric
Indicator Name: Signal Generator Non Repaint MT4 The arrow is non-repaint. Its a non-repaint arrow or money back guarantee. Arrow appeared after candle closed. Very accurate. Time Frame: Any Assets: Any This is MT5 version I use this to trade Gold, US30, Nasdaq and Dax at New York and London Opening. TF m5/m15 Parameters: Push Notifications = True ( You can set the alert send to your mobile phone)
To Setup Sending Alert to your mobile phone 1. At Metatrader Options > Options > Notifications >
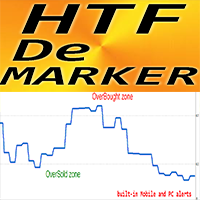
Forex Indicator HTF DeMarker for MT4 This indicator is a useful tool used by technical traders to find entry and exit points. H TF means - H igher Time Frame. DeMarker oscillator line indicates the current price position relative to previous highs and lows
DeMarker provides the most efficient regular divergence signals among other oscillators
OverBought zone is when the D eMarker is above 0.7 and OverSold one - when it is below 0.3
Indicator has built-in Mobile and PC alert
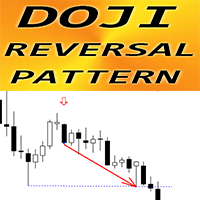
Forex Indicator " Doji Reversal pattern" for MT4 Indicator "Doji Reversal pattern" is pure Price Action trading: No repaint, No delays; Indicator detects Doji Reversal pattern on chart where Doji candle is in the middle of the pattern and the last candle is breakout one: Bullish Doji Reversal pattern - Blue arrow signal on chart (see pictures) Bearish Doji Reversal pattern - Red arrow signal on chart (see pictures) P C, Mobile & Email alerts are included Indicator " Doji Revers
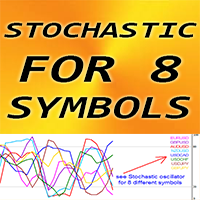
Forex Indicator " Stochastic for 8 Symbols" for MT4. Stochastic oscillator is one of the best indicators on the market - perfect tool for many traders. OverBought zone - above 80; OverSold one - below 20 It is great to take Sell entries from above 80 zone and Buy entries from below 20 "S tochastic for 8 Symbols" gives opportunity to control S tochastic values of up to 8 different symbols just on 1 chart
This indicator is excellent to combine with Price Action entries a
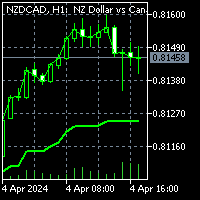
To get access to MT5 version please click here . This is the exact conversion from TradingView: "G-Channel Trend Detection" by "jaggedsoft". This is a light-load processing and non-repaint indicator. You can message in private chat for further changes you need. All input options are available. Buffers are available for processing within EAs. Highlight option is omitted as does not show good in Metatrader.
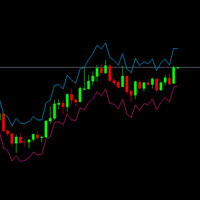
For all temporalities and all charts. Based on the ATR indicator. Calculates and draws on the chart the appropriate points to place Stop Loss or Take Profit according to the current market volatility. The following inputs can be adjusted for a more customized use of the indicator: ATR_Period: number of previous candles to be taken into account for the calculation. ATR_Multiplier: Number by which the ATR will be multiplied to draw the points on the chart. A low multiplier will mean a high risk a

Forex Gump Advanced is a ready-made trading strategy based on one indicator. Forex Gump Advanced is an indicator that shows the trader when to open trades, in which direction to open and when to close. Forex Gump Advanced shows all the necessary information in a clear form on the chart. The indicator works on all currency pairs and all timeframes.
Advantages of the indicator: completely ready trading system does not redraw in 95% of cases the price goes in the direction of the signal. 5% of s

APP System Signals, finansal piyasalarda aktif olarak işlem yapan traderlar için tasarlanmış sofistike bir göstergedir. Gelişmiş teknik analize dayalı olarak kesin alım satım sinyalleri sağlayarak traderların bilinçli kararlar almasını sağlar. Gösterge, güvenilir sinyaller üretmek için üssel hareketli ortalamalar (EMA), basit hareketli ortalamalar (SMA) ve temel eğilimleri birleştiren bir kombinasyon kullanır. Parametreler tamamen özelleştirilebilir olup traderların göstergeleri kendi işlem stra
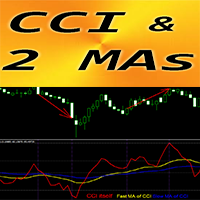
Forex Indicator "CCI and 2 Moving Averages" for MT4 Commodity Channel Index (CCI) is excellent for Momentum trading into the trend direction. " CCI and 2 Moving Averages" Indicator allows you to see Fast and Slow Moving Averages of CCI indicator Up trend - Fast MA is above Slow one; Down trend - Fast MA is below Slow one CCI is one of the most popular oscillators for trading - it measures the difference between the current price and the historical average price
Option#1 - Ope
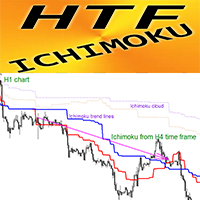
Forex Indicator HTF Ichimoku for MT4 Ichimoku indicator is one of the most powerful trend indicators . H TF means - H igher Time Frame This indicator is excellent for Trend Traders as well as combination with Price Action entries. HTF Ichimoku Indicator allows you to attach Ichimoku from Higher time frame to your current chart. Up trend - red line above blue one (and both lines are above cloud) / Down trend - red line below blue one (and both lines are below cloud) Open BUY orders

See what's happening across the entire market in different time frames with just a glance! This fully-responsive dashboard enables you to understand the current situation of the market without needing to check different charts. It visualizes the current value of three standard-scaled indicators (RSI, Stochastic and ADX) for your preferred symbol and time frames. You can even design some new trading strategies based on the insights it provides.
Key features: Clicking on each dashboard cell ope

Forex Indicator INSIDE Bar Pattern for MT4 Indicator " INSIDE Bar " is very powerful indicator for Price Action trading Indicator detects INSIDE Bar patterns on chart: Bullish INSIDE Bar - Blue arrow signal on chart (see pictures) Bearish INSIDE Bar - Red arrow signal on chart (see pictures) No repaint; No delays; High R/R ratio (reward/risk); PC, Mobile & Email alerts are included Indicator " INSIDE Bar Pattern" is excellent to combine with Support/Resistance Levels: htt
Based on unique formulas and calculations, this indicator analyses every price move on the chart and highlight then apply its unique formulas on them to indicate the currently dominant direction. This indicator works on all instruments but best with GOLD (XAUUSD). It can also work as an entry confirmation tool and can also serves highlighting the worthy and noticeable moves on the chart. The Oppo Signals Indicator can work alongside any other strategy and can also help traders devise their own

Heiken Ashi Histo Filter - is great & efficient auxiliary trading tool! Advanced new calculation method is used - 10 options for parameter "Price for calculation" Excellent to combine with Price Action patterns Green color histogram - Look for Bullish entries Magenta color histogram - Look for Bearish entries There are plenty of opportunities to upgrade even standard strategies with this indicator Indicator has built-in Mobile, PC and Email alerts
// More great Expert Advi

The indicator is based on the calculation of liquidity on the market and thus shows where the market can most likely turn.. It shows the places of liquidity where the price will reach sooner or later... The indicator can be set to several types of liquidity and therefore can display several levels on the graph.. It is a unique tool that can help you very well in your trading The indicator is suitable for currency pairs with the most liquidity (EURUSD/GBPUSD...)
MetaTrader Mağaza, ticaret robotları ve teknik göstergeler satmak için en iyi yerdir.
MetaTrader platformu için ilgi çekici bir tasarıma ve iyi bir açıklamaya sahip bir uygulama geliştirmeniz yeterlidir. Milyonlarca MetaTrader kullanıcısına sunmak için size ürününüzü Mağazada nasıl yayınlayacağınızı açıklayacağız.
Ticaret fırsatlarını kaçırıyorsunuz:
- Ücretsiz ticaret uygulamaları
- İşlem kopyalama için 8.000'den fazla sinyal
- Finansal piyasaları keşfetmek için ekonomik haberler
Kayıt
Giriş yap
Gizlilik ve Veri Koruma Politikasını ve MQL5.com Kullanım Şartlarını kabul edersiniz
Hesabınız yoksa, lütfen kaydolun
MQL5.com web sitesine giriş yapmak için çerezlerin kullanımına izin vermelisiniz.
Lütfen tarayıcınızda gerekli ayarı etkinleştirin, aksi takdirde giriş yapamazsınız.