YouTube'dan Mağaza ile ilgili eğitici videoları izleyin
Bir alım-satım robotu veya gösterge nasıl satın alınır?
Uzman Danışmanınızı
sanal sunucuda çalıştırın
sanal sunucuda çalıştırın
Satın almadan önce göstergeyi/alım-satım robotunu test edin
Mağazada kazanç sağlamak ister misiniz?
Satış için bir ürün nasıl sunulur?
MetaTrader 4 için ücretli teknik göstergeler - 110
SimSim Arrow RSI standart bir "Göreceli Güç Endeksi" indikatörüdür, ancak ok versiyonudur.
MetaTrader 5 için sürüm
Gösterge parametreleri standart olanlara benzerdir, artı bir ek parametre Delta'dır.
Delta = 0 - 100 50 değerinden itibaren sapmalar. 50 göstergesinin seviyesini değiştirmek, artı ve eksi yapmak mümkündür. Gösterge, fiyat seviye çizgisini = 50 +- Delta'yı geçtiğinde sinyal üretir.
İşlem için "KONTROL İŞLEMİ" aktif edildiğinde, indikatör sinyaline dayalı işlemler otomatik olarak
SimSim Arrow BEAR standart bir "Bears Power" göstergesidir, ancak ok versiyonudur.
MetaTrader 5 için sürüm
Gösterge parametreleri standart olanlara benzerdir, artı bir ek parametre Delta'dır.
Delta = 0 - 100 Sıfır değerinden itibaren sapmalar. Göstergenin sıfır seviyesini değiştirmek, artı ve eksi yapmak mümkündür. Gösterge, fiyat sıfır çizgisini +- Delta'yı geçtiğinde sinyal üretir.
İşlem için "KONTROL İŞLEMİ" aktif edildiğinde, indikatör sinyaline dayalı işlemler otomatik olarak açılacakt
SimSim Arrow BULLS standart bir "Bulls Power" indikatörüdür, ancak ok versiyonundadır.
MetaTrader 5 için sürüm
Gösterge parametreleri standart olanlara benzerdir, artı bir ek parametre Delta'dır.
Delta = 0 - 100 Sıfır değerinden itibaren sapmalar. Göstergenin sıfır seviyesini değiştirmek, artı ve eksi yapmak mümkündür. Gösterge, fiyat sıfır çizgisini +- Delta'yı geçtiğinde sinyal üretir.
İşlem için "KONTROL İŞLEMİ" aktif edildiğinde, indikatör sinyaline dayalı işlemler otomatik olarak açılac
SimSim Arrow MACD, standart bir "Hareketli Ortalamalar Yakınsama/Uzaklaşma" indikatörüdür, ancak ok versiyonundadır.
MetaTrader 5 için sürüm
Gösterge parametreleri standart olanlara benzerdir, artı bir ek parametre Delta'dır.
Delta = 0 - 100 Sıfır değerinden itibaren sapmalar. Göstergenin sıfır seviyesini değiştirmek, artı ve eksi yapmak mümkündür. Gösterge 1 veya 2 ok sinyali üretir: Ana_hat sıfır seviyesini geçer +- Delta Signal_line sıfır seviyesini +- Delta'yı geçiyor İşlem için "KONTRO
SimSim Arrow Momentum standart bir "Momentum" indikatörüdür, ancak ok versiyonundadır.
MetaTrader 5 için sürüm
Gösterge parametreleri standart olanlara benzerdir, artı bir ek parametre Delta'dır.
Delta = 0 - 100 100 değerinden itibaren sapmalar. 100 göstergesinin seviyesini değiştirmek, artı ve eksi yapmak mümkündür. Gösterge, fiyat seviye çizgisini = 100 +- Delta'yı geçtiğinde sinyal üretir.
İşlem için "KONTROL İŞLEMİ" aktif edildiğinde, indikatör sinyaline dayalı işlemler otomatik olarak a
SimSim Arrow KijunSen Plus MA tescilli bir ok göstergesidir.
Orijinal indikatörün KijuSen ve MA çizgileri içeren versiyonu.
MetaTrader 5 için sürüm
Kijun-sen çizgisi MA çizgisini geçtiğinde gösterge sinyal üretir.
İşlem için "KONTROL İŞLEMİ" aktif edildiğinde, indikatör sinyaline dayalı işlemler otomatik olarak açılacaktır.
Göstergeyi güvenilir bir sinyal cihazı olarak amacına uygun olarak kullanabilirsiniz.
Ancak ikincil amacı " CONTROL DEA L" yardımcı programına sinyal sağlayıcı olarak
SimSim Arrow 2MA 2 standart MA indikatörüdür. Okun kesiştiği nokta işlem sinyalidir.
MetaTrader 5 için sürüm
Göstergelerin parametreleri standart MA göstergelerine benzemektedir, biri yavaş MA, diğeri hızlı MA.
Kesişim noktasında işlem sinyali oluşur.
Hızlı MA çizgisi yavaş MA çizgisini geçtiğinde indikatörler sinyal üretir.
İşlem için "KONTROL İŞLEMİ" aktif edildiğinde, indikatör sinyaline dayalı işlemler otomatik olarak açılacaktır.. Göstergeyi güvenilir bir sinyal cihazı olarak amacına u
SimSim Arrow ADX standart bir "Ortalama Yön Hareket Endeksi" indikatörüdür, ancak ok versiyonundadır.
MetaTrader 5 için sürüm
Gösterge parametreleri standart olanlara benzerdir.
İşlem için "KONTROL İŞLEMİ" aktif edildiğinde, indikatör sinyaline dayalı işlemler otomatik olarak açılacaktır.
Göstergeyi güvenilir bir sinyal cihazı olarak amacına uygun olarak kullanabilirsiniz.
Ancak ikincil amacı " CONTROL DEAL " yardımcı programına sinyal sağlayıcı olarak hizmet etmektir.
Gösterge ile bu yar
SimSim Arrow Simple Signal tescilli bir ok göstergesidir.
MetaTrader 5 için sürüm Bu çok basit bir göstergedir, sadece bir parametresi vardır, göstergenin hesaplanması için gereken süre.
İşlem için "KONTROL İŞLEMİ" aktif edildiğinde, indikatör sinyaline dayalı işlemler otomatik olarak açılacaktır. Göstergeyi güvenilir bir sinyal cihazı olarak amacına uygun olarak kullanabilirsiniz.
Ancak ikincil amacı " CONTROL DEAL " yardımcı programına sinyal sağlayıcı olarak hizmet etmektir.
Gösterge ile bu
SimSim Arrow Stochastic, standart bir "Stokastik Osilatör" indikatörüdür, ancak ok versiyonundadır.
MetaTrader 5 için sürüm
Gösterge parametreleri standart olanlara benzerdir, artı bir ek parametre Delta'dır.
Delta = 0 - 100 50 değerinden itibaren sapmalar. 50 göstergesinin seviyesini değiştirmek, artı ve eksi yapmak mümkündür. Gösterge, fiyat seviye çizgisini = 50 +- Delta'yı geçtiğinde sinyal üretir.
İşlem için "KONTROL İŞLEMİ" aktif edildiğinde, indikatör sinyaline dayalı işlemler otomatik

This product enables you to trade in opportunities that are detected by the indicator. Using advanced Calculations and formulae this product enables you to profit from trend opportunities. Trend master has Channels that show areas the trend is strong and you are likely to profit. Once this zone Is breached the price is on in uncertain territory and there is no guarantee the trend will continue This means there might be reversal and it is advisable to exit a trade here.

Do you want to beat the market? This indicator uses advanced mathematical formulae That include regression analysis to predict market trends. So what happens is That when the price is above the indicator line as depicted in the screenshot The trend is rising and when the price is below the indicator line the Trend is falling. This opportunities appear multiple times each day enabling You to profit. This indicator makes the trend your friend.
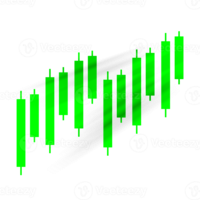
Bollinger trading is an indicator for mt4 that uses Bollinger bands and other trend following strategies To detect the direction of the market. Just as attached in the screenshot the light blue line shows areas The market is rising. This means opening positions here is in the direction of the trend. The dark blue lines cane be used for sell trades when the market moves in the opposing direction. Using this tactics you can have a clear sense of where the market is headed.

This product works by detecting trend opportunities. So as shown in the screenshot when The indicator shows an upward arrow it shows the market is on an uptrend and when the indicator Shows a downward arrow it shows the market is on a downward direction. What makes this indicator Special is that it has additional signals just below the arrow signals. It is up to the trader to be Creative and combine these signals with the arrow signal to get accurate forecasts.
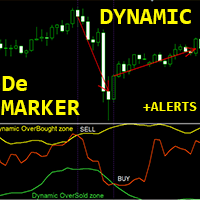
Crypto_Forex Göstergesi "Dinamik Aşırı Satış/Aşırı Satın Alma bölgeli DeMarker" MT4 için. Yeniden boyama yok.
- DeMarker osilatör eğrisi, gösterge hesaplama dönemi boyunca önceki yüksek ve düşük seviyelere göre mevcut fiyat pozisyonunu gösterir. - Dinamik Aşırı Satın Alma bölgesinden Satış girişleri ve dinamik Aşırı Satış bölgesinden Satın Alma girişleri yapmak harikadır. - Bu gösterge, Fiyat Hareketi girişleriyle birleştirmek için de mükemmeldir. - Dinamik Aşırı Satın Alma bölgesi - sarı çizg

Best Divergence Indicator for advanced traders without distraction of lines or arrows. It is not a magic blackbox for novice traders rather a great tool for experienced traders to decide their entry and exit. Can be used for most of the Forex pairs, Gold, Oil, Crypto. Flexibility to play with input to customize ur unique research too. Therefore, I will suggest turning off arrows and divergence line to reduce clutter and instead use the following advice: For sell on divergence indicator start tu
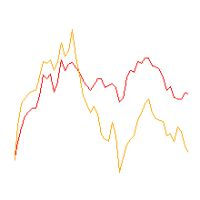
Line1: simple calculation of change in closing price for the chosen input period - named Velocity. Line2: simple calculation of change in velocity for the chosen input period - named Acceleration. Feel free to play with the input periods to find a profitable combination. For faster results it is best to do it in MT Optimizer. Can assist in either manual or automatic trading.
Two line MACD index composition MACD line (express line) : Usually calculated by subtracting the 12-cycle EMA from the 26-cycle EMA, it is more sensitive to price changes, can quickly reflect the change of the recent price trend, its fluctuation is relatively frequent, used to capture the dynamics of short-term market trends. Signal line (slow line) : Generally a 9-cycle EMA of the MACD line, its role is to smooth the MACD line, filter out some short-term noise and false signals, make the indic

Invisible Ghost is a great arrow indicator for trading in financial markets.
Designed to work with popular technical analysis tools.
The indicator is based on the use of moving averages and Bollinger bands.
These tools help filter out market noise and focus on key moments.
This indicator also analyzes historical market data to improve the accuracy of signals.
Key features: - Simple signals: the indicator displays red arrows for sell signals and blue arrows for buy signals, making the decis

AI Supertrend timely alerts
MT4 Super Trend timely reminder indicator introduction I. Overview of indicators The MT4 Super Trend Alert Indicator is a technical analysis tool specifically designed for the MetaTrader 4 platform to help traders accurately capture changes in market trends and send timely signals to alert traders to potential trading opportunities. It is based on a unique AI-based algorithm that takes into account factors such as price volatility, trend strength, and market volatil

1.Indicator gives key trade levels with red and green arrows. 2. You need to manually mark these trade levels on higher time frame with horizontal line or area and take the trades based on price action on lower timeframe at these trade levels. For example, see rejection or violation of these trade levels to go along or reverse the trade. (See attached screenshot) 3. You need to manually turn off signals for lower timeframes you comfortable working with. 4. Please note that you need to manually

SimpleProb: Finansal Piyasadaki Yeni Müttefikiniz! Açıklama Karmaşık ve kafa karıştırıcı göstergelerden sıkıldınız mı? SimpleProb , MetaTrader 4 üzerindeki işlemlerinizi daha basit ve verimli hale getirmek için tasarlanmış bir teknik analiz göstergesidir! SimpleProb, son 14 fiyat dönemini analiz ederek yükseliş ( CALL ) ve düşüş ( PUT ) olasılıklarını hesaplar. Grafik üzerinde net görsel sinyaller sağlayarak alım ve satım kararlarını daha sezgisel hale getirir. Nasıl Çalışır? Basit Olasılık Hesa
CrossPoint4 is an indicator that helps novice traders.
In addition to the standard "Crosshair" function (Ctrl + F), CrossPoint4 will show you how to set the StopLoss and TakeProfit levels correctly, taking into account the minimum allowable level, calculate the number of points between two points and convert this into the currency of the account, taking into account the expected lot of the transaction.
Sometimes, when opening a deal, a novice trader completely forgets about the spread. After

Divergentor — это продвинутый индикатор предназначенный для выявления дивергенции - точек расхождения цены у двух различных пар с известной корреляцией. Например EURUSD и индекса доллара DXY, USDCHF и EURUSD, ETHUSD и BTCUSD, Nasdaq100 и SP500 и тп. Индикатор использует фундаментальную закономерность движения цены за основным активом и дает преимущество в более раннем определении разворота на текущей паре. Индикатор может быть использован как готовая стратегия входа. Идеально подходит как для

The Pure Price Action ICT Tools indicator is designed for pure price action analysis, automatically identifying real-time market structures, liquidity levels, order & breaker blocks, and liquidity voids. Its unique feature lies in its exclusive reliance on price patterns, without being constrained by any user-defined inputs, ensuring a robust and objective analysis of market dynamics. Key Features Market Structures A Market Structure Shift, also known as a Change of Character (CHoCH), is a pivot

MT4 platform AI T3 MA Super Fill indicator use introduction I. Overview of indicators
The AI T3 MA Super Fill indicator is a powerful analytical tool that combines advanced algorithms and T3 moving average technology to provide traders on the MT4 platform with accurate market trend judgments and trading signals. It uses intelligent algorithms to deeply process the price data, and displays the changes of the T3 moving average in a unique way to help traders more effectively grasp the market dyn
MT4CandleTime index introduction
MT4CandleTime is an indicator for the MT4 platform, which can display the remaining time of the current K line in the form of an intuitive digital countdown, which is convenient for traders to grasp the trading rhythm.
Precise time control: The MT4CandleTime indicator provides traders with extremely accurate K-line remaining time data, enabling them to fine manage the time rhythm in the trading process, avoiding the hasty or delayed trading decisions caused by
Introduction to the use of MT4 platform AI Color Gradient Volume indicators I. Overview of indicators
AI Color Gradient Volume is an innovative volume analysis indicator based on artificial intelligence technology for the MT4 platform. By converting the volume data into an intuitive color gradient graph, it helps traders to have a more acute insight into the inflow and outflow of funds in the market and the strength of the buying and selling forces, so as to provide strong support for trading

The indicator displays support and resistance zones defined logically using the MACD. The entire concept is explained in the video, with specific examples shown. The indicator works on any instruments and timeframes. It does not repaint.
After placing it on the chart, please go through all the timeframes sequentially, from monthly to 1-minute, so that all lines load correctly. After that, you can start using it.
The concept is unique and has not been seen in other systems or indicators.
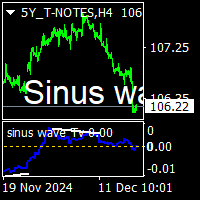
Sinus wave Tv indicator is a extra ordinary oscillator.to find divergency. For mt4 and Tradingview pine script purchased people, after installed on terminal ,contact me on mql5 to get BONUS TradingView pinescript.
it works all pairs and all timeframes. suitable for experienced and beginner traders.. indicator works on toward of the prices... while sinus wave go up side that means prices will up. and while sinus wave go down that means prices is going down. it gives divegency when trend rever

AI Pearson Trend!!
My name is Murat Yazici. I am a PhD candidate in Statistics.
I have several papers, writing books, book chapter studies, and several conference presentations and experiments about analytical modeling. About me: https://tinyurl.com/pjejextx The AI Pearson Trend indicator is a novel trend-based indicator including Fuzzy statistical modeling.
You can use it on all currencies and timeframes, not including M1 timeframes.
For best performance, check a trend to see if it is the sam
This custom trading indicator utilizes the Average True Range (ATR) to identify buy and sell opportunities based on price movement. It can optionally employ Heikin Ashi candles to reduce noise and produce smoother signals. The indicator is optimized for use on a 1-hour timeframe and is designed for long-term trading strategies. Works best with symbols: AUDUSD, EURUSD, USDJPY, GBPUSD, US500, US30, XAUUSD, BNBUSD Configure Settings : Configure Settings : Set KeyValue to 9.0 . Set ATRPeriod to 11 .
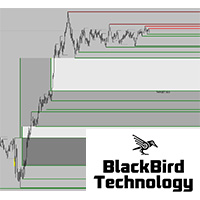
New market liquidity indicator, more accurate with two levels, will really unhide the "hidden agenda" of the price action in any timeframe. Forget all other indicator and use what professional traders are using ! For more information about market liquidity, a manual on how to use this indicator please send me a message.
A lot of information can be found on the net. (search liquidity trading/ inner circle trader)
https://www.youtube.com/watch?v=yUpDZCbNBRI
https://www.youtube.com/watch?v=2LIad2

Reversals is a trading tool designed to help traders identify potential trend reversals. Suitable for all experience levels, it provides instant alerts across multiple channels, with customizable settings . Whether you’re a scalper or swing trader, Reversal Pro can be integrated into your existing strategy.
Key Features of Reversals
Real-Time Alerts: Receive buy and sell signals directly via email, mobile, or desktop notifications. Non-Repaint Design: Once a signal is generated, it remains

Wave Trend Pro: Market Trend Analysis Tool Key Features Smart Signal Analysis Provides structured BUY/SELL signal insights Helps detect potential trend reversals Assists in exit point identification Offers real-time market condition tracking Advanced Visual Analytics Color-coded trend strength representation Dynamic trend momentum evaluation Market volatility tracking system Noise reduction filtering for clarity Performance Benefits Designed for efficient signal processing Developed to improve

Ticaret Seviyeleri Göstergesi, giriş noktalarını, tutma pozisyonlarını ve trend yönünü belirlemek için tasarlanmış bir ticaret sistemidir.
Tek bir komplekste çalışan çeşitli mekanizmaları içerir, trend yönünün dalga analizini, sinyalleri oluştururken seviye analizini içerir, olası TP ve SL hedeflerini gösterir.
Gösterge yetenekleri
Mevcut mumun üzerinde sinyal okları görünür ve yeniden renklendirilmez. Fiyatın sıçradığı seviyeleri aramak için özel algoritmalar kullanır. Trendlere göre çalışır.
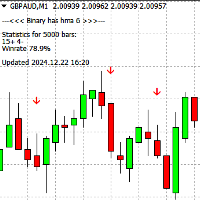
Binary HH 6 göstergesi, ikili opsiyon ticareti için tasarlanmıştır ve M1 ile M5 zaman dilimlerinde herhangi bir döviz çiftiyle çalışır. Ayrıca Forex piyasasında da kullanılabilir. Temel Özellikler: Vade: Varsayılan olarak 1 mum ile ayarlanmıştır, ancak ayarlarda 1 ila 3 mum arasında değiştirilebilir. Trend Analizi: Gösterge, trende uygun şekilde çalışır ve grafikte oklar şeklinde sinyaller verir: Mavi ok – Alış sinyali. Kırmızı ok – Satış sinyali. Uyarılar: Sinyaller, mevcut mum kapanmadan önce
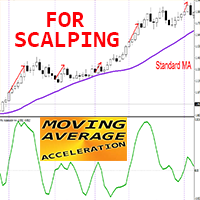
Crypto_Forex Göstergesi MT4 için Hareketli Ortalama Hızlanması, Yeniden Boyanma Yok.
MA Hızlanması - "MA Hızı" göstergesi için yardımcı araç olarak tasarlanmış bir scalping göstergesidir.
- Bu göstergenin hesaplanması fizik denklemlerine dayanmaktadır. Size hareketli ortalama çizgisinin ivmesini gösterecektir.
- MA Hızlanması ile standart stratejileri bile yükseltmek için birçok fırsat vardır. SMA, EMA ve LWMA için kullanmak mümkündür. - MA Hızlanması, karşılık gelen Hareketli Ortalamanın 2.

Zone to Zone Indicator for MT4 Introducing the "Zone to Zone" indicator for MetaTrader 4, designed to enhance your trading strategy with precision and versatility. Key Features: Accurate Historical Resistance/Support Zones : Effortlessly identify key resistance and support zones on your chart, drawn with pinpoint accuracy. Highly Configurable : Tailor the indicator to your specific needs with a wide range of input parameters. Customizable Parameters : Specify the length, width, and number of hig

The correlation indicator is an analytical tool used to measure the relationship between two or more currency pairs or financial assets in the market. This indicator helps traders understand how the price movement of one asset affects or relates to the movement of another asset. Correlation is typically expressed in values ranging from -1 to +1: Positive correlation (+1) : Indicates that two assets move in the same direction. Negative correlation (-1) : Indicates that two assets move in opposite

The Dead Fish Pattern Indicator is a fresh take on the classic Quasimodo (QM) pattern, originally taught by Cikgu Mansor Sapari. But unlike traditional QM tools, this one’s laser-focused on bullish setups only—and for good reason.
Why no bearish patterns? Simple: they tend to be noisy and unreliable, often throwing false signals that can mess with your trade decisions. This indicator is built to filter that out and keep things clean, especially in uptrending markets.
Here’s how it works: it st

Binary SS , ikili opsiyon ticareti için kullanılan bir araçtır ve: Herhangi bir zaman diliminde çalışır. Tüm döviz çiftleriyle uyumludur. Trende dayalı yüksek doğrulukta sinyaller üretir. Nasıl çalışır? Bir sonraki mum için sinyal , mevcut mum kapanmadan önce grafikte bir ok olarak görünür: Mavi ok — alım sinyali. Kırmızı ok — satış sinyali. Varsayılan vade süresi 1 mum dur, ayarlardan 1 ile 4 mum arasında değiştirilebilir. Kurulum: "MQL5" klasörünü indirin :
Buradan indirin . Terminal
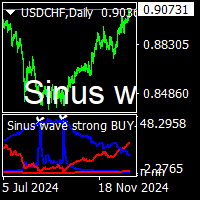
sinus wave strong buy sell indicator is nonrepaint top bottom point indicator.it work all pairs and all timeframe.suitable for beginners and experienced traders. it depend to sinus wave and vertex base .gives signal sinus wave over zero or below zero on approppirate vertex positions. cnt number has been set to 500 bars for demo mode. it can be increase to 2000 depend to charts has bar numbers. minimum value is 500. white points on red vertex spikes means sell. white points on blue vertex spikes

FIFTY göstergesi artık manuel seviye çizme ihtiyacını ortadan kaldıran otomatik bir versiyonla sunulmaktadır. Bu versiyon, günlük, haftalık, aylık ve yıllık seviyeleri otomatik olarak grafiğe çizer, böylece doğruluk sağlanır ve zaman tasarrufu yapılır. Ayrıca, bu seviyelerin görünürlüğünü açıp kapatmak için düğmeler mevcuttur, bu da tamamen özelleştirilebilir bir kullanım sunar. Manuel kullanımı tercih edenler için, göstergeyi ücretsiz versiyonu hâlâ mevcut olup tam işlevselliğe sahiptir. Böylec
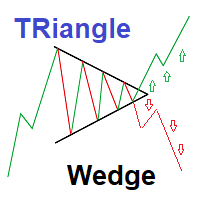
Strategy set to trade Triangle wedge break
This is a simple very effective strategy based on detecting and showing triangle wedges formation Strategy set to trade Triangle wedge break Red Arrows appears on crossing triangle down Green Arrows appears on crossing triangle Up You can also trade lower and upper triangle limit :(new version may be released to allow arrows for side ways trading) ---Sell on price declines from High triangle Level - Buy on increasing from Lower triangle level 2 inp
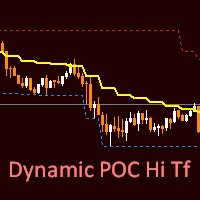
The new Dynamic PACK Hi Tf indicator is based on tick volumes. The middle line shows the average price for the selected period of the selected senior timeframe. The upper and lower lines show the maximum/minimum of the same selected period of the same timeframe. In the settings, the user can optionally choose which timeframe and bar calculation period he needs. You can also change the style, thickness, and color of each of the lines.
In the "StsrtBars" parameter, you can select the start peri
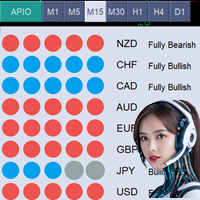
Ürünün mevcut fiyatı 49$'dır ve sınırlı bir süre için geçerlidir. Bir sonraki fiyat 99$ olacaktır. All Power In One (APIO) Göstergesi All Power In One (APIO) göstergesi, USD, EUR, GBP ve diğer ana para birimlerinin gücünü değerlendirmek için tasarlanmış güçlü bir araçtır. Seçilen zaman dilimlerinde farklı döviz çiftlerinin hareketlerini ve yönlerini analiz ederek, APIO, traderlara para birimlerinin gücü ve potansiyel ticaret fırsatları hakkında net bir anlayış sunar. APIO'nun MT5 versiyonu mevc

Spot Turning Points with Ease The Catalyst Indicator is a tool designed to assist traders in analyzing potential turning points in price movements. By combining a smoothing technique with an advanced algorithm, this indicator offers signals that can support your trading analysis and decision-making.
Parameters: Variable (Defaults) Cycle 14
Period 21 Drag 0.2 Computer Alerts True Play_Sound True Send_Email false Send_Notification True Signal_Bar 0
How It Works Signal Detection : Gree

An indicator that calculates a volume value adjusted based on where did the candle close, so it gives a directional kind of volume. Buffers : It has two buffers, net long ,and net short. The buffers' empty value is mapped to the EMPTY_VALUE constant in MQL4 to make it easier to use the indicator in another EA or Indicator. Uses : Didn't find a specific use, but maybe combine it with VSA? not sure.

ZLMA Trend Candles indicator uses an enhanced Zero-Lag Moving Average to highlight key trend shifts, repainting candles in real time. It reacts faster than traditional moving averages, helping you spot potential market turns earlier. Gain clear entry and exit signals and filter out market noise with ease! This product is also available for MetaTrader 5 => https://www.mql5.com/en/market/product/129278 1. What Is ZLMA Trend Candles?
ZLMA Trend Candles is a MetaTrader 4/5 indicator based on the Z
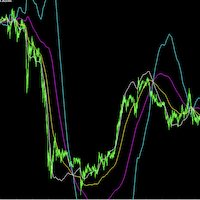
SourcePoint是一个很好的中长线交易指示器,他能独立使用,也可以去其他趋势型指标独立使用,可以很明确的给出趋势走向,很好的指出最佳的buy和sell位置,指标不含有未来函数,不会重新绘制,不仅能够应用到自己的手动交易过程中,还能完全可以写入到自己的EA中,如果你需要 MT5版本 可以去( https://www.mql5.com/zh/market/product/101744?source=Site +Market+My+Products+Page#description) 。 (如果你感觉到这个指标能够帮助你进行更准确的交易,请帮忙给个好评,希望我的作品能够帮助更多有需要的人) ===================参数列表===================== fastP: 96 slowP:208 avgP:72 =================参考使用方法=================== 此指标可以适用于任何交易品种,能够用在任何周期。 个人建议:短线交易选择M5,中长线交易选择M15 每次形成一个交点,就是一个交易机会,同时也是一个持仓平仓点位。建议配合
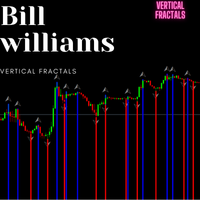
The indicator I’m referring to is a leading indicator, similar to the Bill Williams Fractals indicator, but with an added feature: it draws vertical lines on the chart to mark significant points in time. This functionality makes it particularly useful for traders as it provides clear visual cues for potential trading opportunities.
What sets this indicator apart is its versatility; it can be applied across all timeframes and any currency pair, making it suitable for a wide range of trading stra
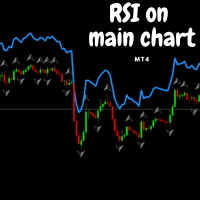
This indicator functions similarly to the Relative Strength Index (RSI), but with a key difference: instead of being displayed in a separate window, it overlays directly on the main price chart. This allows for more convenient visualization and interpretation of market momentum alongside price movements. I believe this indicator will enhance your trading experience by providing clearer insights into market conditions. Wishing you successful trading!

Lion’s Roar - Trend Strength Indicator Are you ready to take control of your trading journey? The Lion’s Roar - Trend Strength Indicator is here to help you identify and harness powerful market trends with precision and confidence. Designed with traders in mind, this advanced tool is built on a robust strategy that combines trend direction with momentum validation using the Average True Range (ATR). This indicator is not pre-optimized, giving YOU the freedom to tailor it to your unique trading

Unleash Market Volatility with the Titan Force Indicator! Are you ready to dominate the market by capitalizing on volatility? The Titan Force Indicator is your ultimate trading tool, designed for traders who thrive during periods of heightened market activity. Not Optimized for You – Yet! This indicator is a canvas for your creativity. It's been crafted to let you optimize it according to your unique trading strategies and preferences. Your skills, your edge! How Does the Titan Force Indicator

Introducing the Falcon Turn Indicator Designed for customization and optimization, this indicator empowers traders to adapt it to their unique strategies. Why Choose the Falcon Turn Indicator? The Falcon Turn Indicator leverages the power of the Parabolic SAR strategy to highlight potential buy and sell opportunities with precision and clarity. It is perfect for trend-following enthusiasts and those who value flexibility in fine-tuning their trading tools. Key Features: Parabolic SAR-Based Sign

Detailed blog post explaining everything with screenshots and has free scanner link: https://www.mql5.com/en/blogs/post/760476/
Scanner only works with the purchased Trendlines indicator. And it needs to be in same directory.
Features
Triangle Types: Detects ascending, descending, and symmetrical triangles. Channel Types: Horizontal, rising, and falling channels. Scanner: Shows symbols for above trendline patterns Threshold: Adjustable sensitivity for slopes Breakouts: Alerts when price breaks
MT4 Sürümü https://www.mql5.com/en/market/product/129411 MT5 Sürümü https://www.mql5.com/en/market/product/129412
Pano Tarayıcısı Kalman – Çoklu Çift, Çoklu Zaman Dilimi Tarayıcısı
Kalman Filtre Teknolojisini Kullanarak Akıllı Trend Algılama İçin Hepsi Bir Arada Tarayıcı
Pano Tarayıcısı Kalman, trend yönünü, sinyal seviyelerini ve trend gücünü birden fazla zaman dilimi ve birden fazla sembolde aynı anda izlemek için tasarlanmış, değiştirilmiş Kalman Filtre Trend Seviyeleri algoritmasına daya
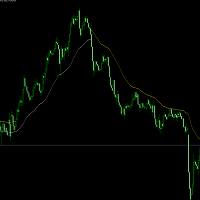
超级趋势指标
开发于2024年12月,测试效果不错。 适用于,黄金1小时,可配合 5分钟和15分钟趋势线。 白线上只做多,黄线下只做空。 其它品种可根据自己的经验使用。 如果使用中有什么问题可提供宝贵意见。谢谢。 超级趋势指标 开发于2024年12月,测试效果不错。 适用于,黄金1小时,可配合 5分钟和15分钟趋势线。 白线上只做多,黄线下只做空。 其它品种可根据自己的经验使用。 如果使用中有什么问题可提供宝贵意见。谢谢。 超级趋势指标 开发于2024年12月,测试效果不错。 适用于,黄金1小时,可配合 5分钟和15分钟趋势线。 白线上只做多,黄线下只做空。 其它品种可根据自己的经验使用。 如果使用中有什么问题可提供宝贵意见。谢谢。

The Mountain Guard Indicator is a highly customizable tool designed for traders who want full control over their optimization. It has not been pre-optimized, giving you the freedom to adapt it to your specific trading strategies and preferences. Key Features: Buy and sell signals displayed with lime (buy) and red (sell) arrows on the chart. SAR line represented as a dotted Dodger Blue line to visualize the Stop-and-Reverse (SAR) trend-following indicator. Adjustable parameters to control SAR st

Ocean State Indicator Unleash the Power of Precision Trading! Introducing the Ocean State Indicator, an innovative tool designed to elevate your trading experience. This indicator is a versatile, dynamic solution that equips you with the tools needed to analyze market trends and identify profitable entry and exit points. Priced at just $65, it’s an incredible value for traders seeking to optimize their strategies. Important Note: The Ocean State Indicator is not pre-optimized. It’s been created

Wolf Signal Indicator Note: This indicator is not optimized and is designed for traders who prefer to tailor it to their unique strategies. It provides a robust framework, giving you the freedom to adjust parameters and refine its behavior to suit your trading style. Why Choose the Wolf Signal Indicator?
The Wolf Signal Indicator is a powerful and versatile tool for identifying trading opportunities across multiple market conditions. Designed with precision, this indicator harnesses advanced al

Discover the untapped potential of market range trading with the Forest Shadow Indicator! Designed for traders who want to optimize their strategies, this tool provides raw, powerful insights into market trends and turning points. Note: The indicator is unoptimized, offering you full flexibility to tailor it to your unique trading needs. Core Logic: The Forest Shadow Indicator uses a combination of stochastic momentum and visual signals to highlight potential buy and sell zones within range-bou
Mountain Echo Indicator
Your key to uncovering trade opportunities, designed for custom optimization.
Price: $65 Key Features: Visual Buy and Sell Signals
The indicator places visually appealing arrows directly on your chart: Lime Green Arrows indicate potential buy opportunities. Red Arrows signal potential sell opportunities. Customizable Stochastic Parameters
Includes key inputs like: %K Period (default: 14) %D Period (default: 3) Slowing (default: 3) Bars to Wait Between Signals (default: 1

Welcome to the Ocean's Gate Stochastic Indicator! Note: This indicator is not optimized by default—it has been crafted for you to tweak and optimize based on your unique trading style! Dive into precise decision-making with this advanced trading tool that harnesses the power of the stochastic oscillator. The Ocean's Gate Stochastic Indicator not only visualizes overbought and oversold conditions but also identifies critical crossovers, allowing you to anticipate market movements with confidence

Introducing the River Flow Divergence Indicator Are you ready to unlock your trading potential? Meet the River Flow Divergence Indicator, a powerful tool designed to help you navigate market trends and reversals with precision. This indicator is tailored for traders who are eager to fine-tune their strategies and take control of their success. Note: This indicator is not optimized out of the box. It’s crafted for you to customize and optimize according to your unique trading style and goals. Ho

Introducing the Star Path Stochastic Cross Indicator Ready to explore your trading potential? The Star Path Stochastic Cross Indicator is here to guide your path. Designed for traders who love flexibility, this indicator is not optimized, giving YOU the freedom to tailor it to your strategies. Whether you're a beginner or an experienced trader, this tool is the perfect addition to your toolkit. The Logic Behind the Indicator
This indicator leverages the powerful stochastic oscillator to identif

Wind Dancer Indicator Ready to take control of your trading journey? The Wind Dancer Indicator is here to empower your strategies with a unique, visually intuitive approach. Designed with flexibility in mind, this indicator is not optimized, giving you the creative freedom to fine-tune and adapt it to your specific trading needs. How Does the Wind Dancer Indicator Work? The logic behind the Wind Dancer Indicator is a blend of sophisticated signals and a seamless visualization algorithm: Signal

Aurora Cross: Your Customizable Path to Trading Success! Price: $65
Explore More Tools and Strategies Here About This Indicator
The Aurora Cross Indicator is designed to empower traders to refine and optimize their strategies. It’s a versatile tool created specifically for you to customize and tailor to your unique trading approach. It is not pre-optimized, giving you complete freedom to experiment and find the perfect settings for your trading style. How It Works
At its core, the Aurora Cross

Cosmos Dance Indicator The Cosmos Dance Indicator is your next powerful tool in financial trading, designed for traders who value precision and flexibility. This indicator is not pre-optimized, giving you the freedom to fine-tune and adapt it to your specific trading strategy. With Cosmos Dance, you hold the reins to enhance your trading edge. Key Features and Logic: Clear Buy and Sell Signals: Visual arrows for "Buy" (green) and "Sell" (red) opportunities, helping you identify potential market
MetaTrader mağazası, MetaTrader platformu için uygulama satın almak adına rahat ve güvenli bir ortam sunar. Strateji Sınayıcıda test etmek için Uzman Danışmanların ve göstergelerin ücretsiz demo sürümlerini doğrudan terminalinizden indirin.
Performanslarını izlemek için uygulamaları farklı modlarda test edin ve MQL5.community ödeme sistemini kullanarak istediğiniz ürün için ödeme yapın.
Alım-satım fırsatlarını kaçırıyorsunuz:
- Ücretsiz alım-satım uygulamaları
- İşlem kopyalama için 8.000'den fazla sinyal
- Finansal piyasaları keşfetmek için ekonomik haberler
Kayıt
Giriş yap
Gizlilik ve Veri Koruma Politikasını ve MQL5.com Kullanım Şartlarını kabul edersiniz
Hesabınız yoksa, lütfen kaydolun
MQL5.com web sitesine giriş yapmak için çerezlerin kullanımına izin vermelisiniz.
Lütfen tarayıcınızda gerekli ayarı etkinleştirin, aksi takdirde giriş yapamazsınız.