KT Half Trend MT5
- Индикаторы
-
KEENBASE SOFTWARE SOLUTIONS
 Keenbase Trading разрабатывает профессиональные индикаторы и советники (Expert Advisors) для MetaTrader 4 и MetaTrader 5, помогая трейдерам принимать более взвешенные торговые решения.
 - Версия: 1.0
- Активации: 5
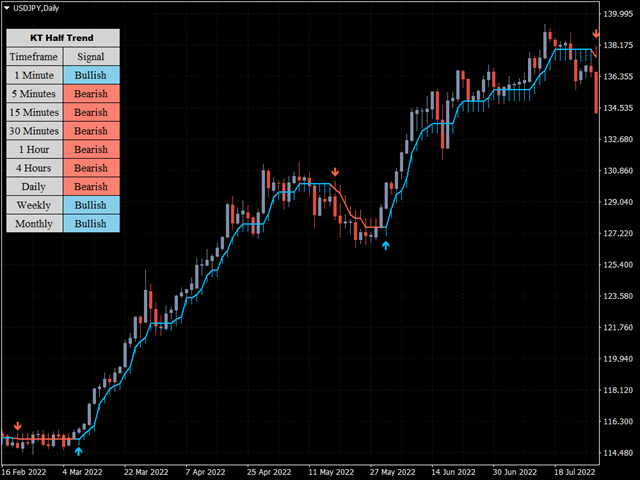
KT HalfTrend — это индикатор тренда на основе скользящих средних, который отображает зоны. Он сигнализирует о смене тренда путём отображения зон отмены бычьего и медвежьего направлений на графике.
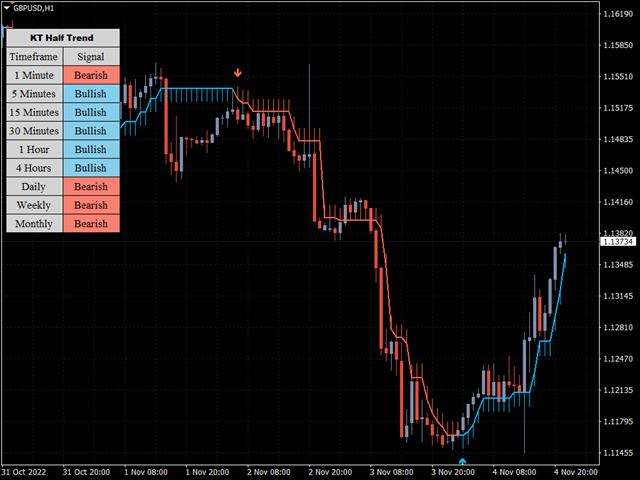
Он также показывает силу сигналов на покупку и продажу с помощью стрелок на основном графике. Если тренда нет, индикатор будет плоским — это может означать зону накопления, временной консолидации или распределения цены. Если тренд присутствует, индикатор будет иметь наклон в соответствующем направлении.
Сигналы считаются сильными, если наклон крутой — как вверх, так и вниз. Индикатор может отмечать сильный восходящий тренд синим цветом. Сильный нисходящий тренд может быть выделен красным цветом.
Особенности
- Очень простой и удобный в использовании индикатор с уникальным подходом.
- Подходит для любых валютных пар и таймфреймов.
- Предоставляет сигналы как для агрессивных, так и для более осторожных входов.
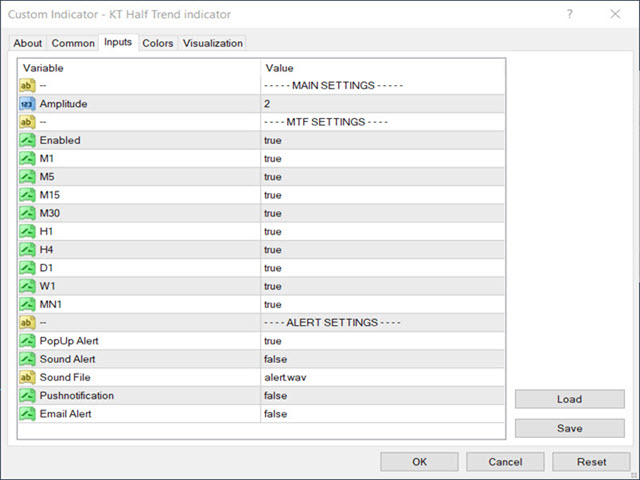
- Можно настраивать параметры скользящей средней, Parabolic SaR и цветовое оформление.
Применение
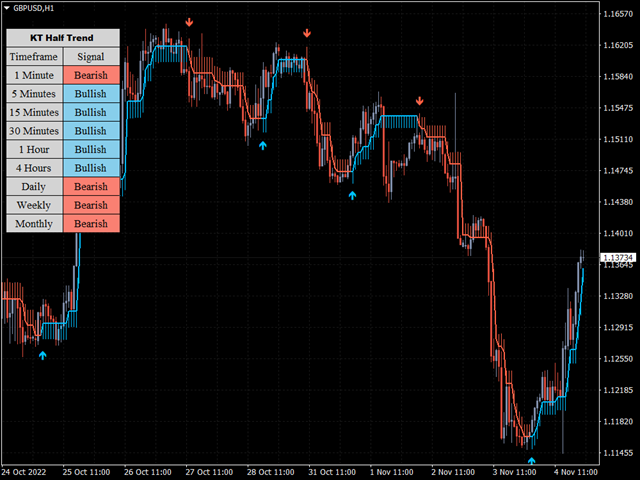
Как правило, условия для покупки возникают, когда цена актива поднимается выше наклона индикатора, и HalfTrend окрашивается в синий цвет.
Под ценовой свечой будет синяя стрелка вверх, сигнализирующая о бычьем импульсе. Это указывает на необходимость размещения стоп-лосса ниже индикатора.
Когда появляется красная стрелка вниз, указывающая на медвежий импульс, рекомендуется выйти из длинной позиции или установить тейк-профит.
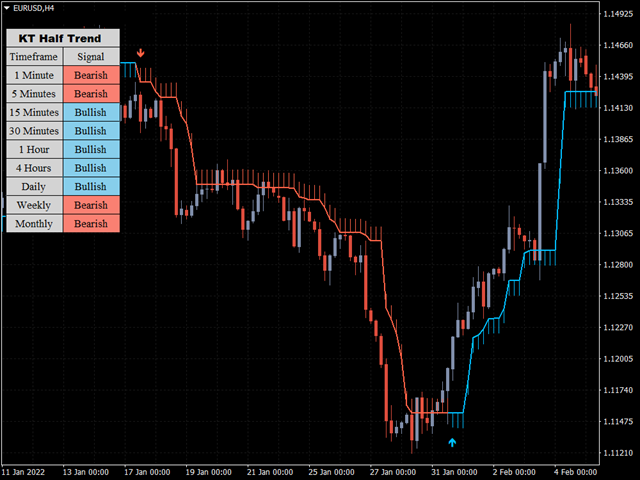
Условия для продажи, как правило, возникают, когда цена опускается ниже наклона индикатора, а HalfTrend окрашивается в красный цвет.
Над ценовой свечой появится красная стрелка вниз. Это сигнал к размещению стоп-лосса выше индикатора.
Когда появляется синяя стрелка вверх, можно закрыть короткую позицию или установить тейк-профит.