KT Half Trend MT5
- インディケータ
- バージョン: 1.0
- アクティベーション: 5

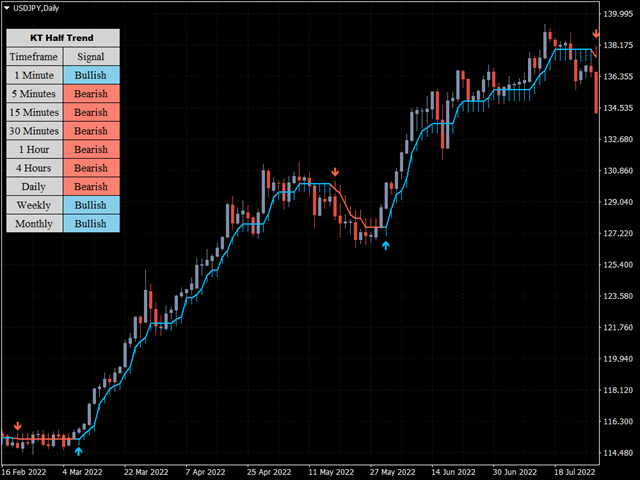
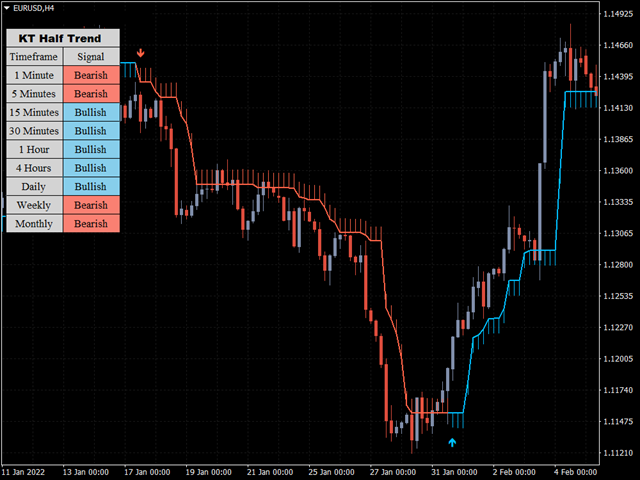
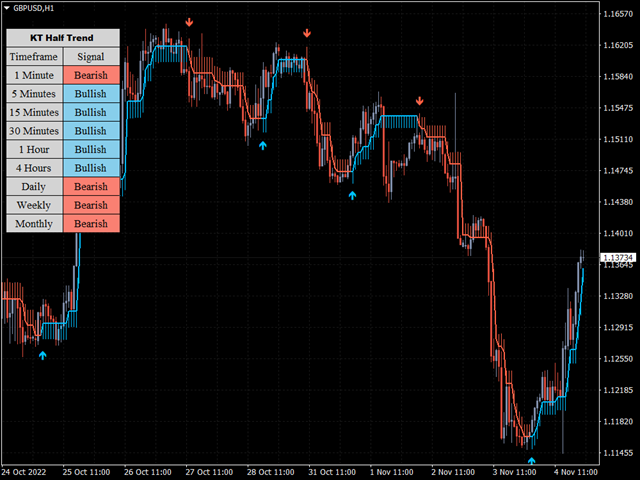
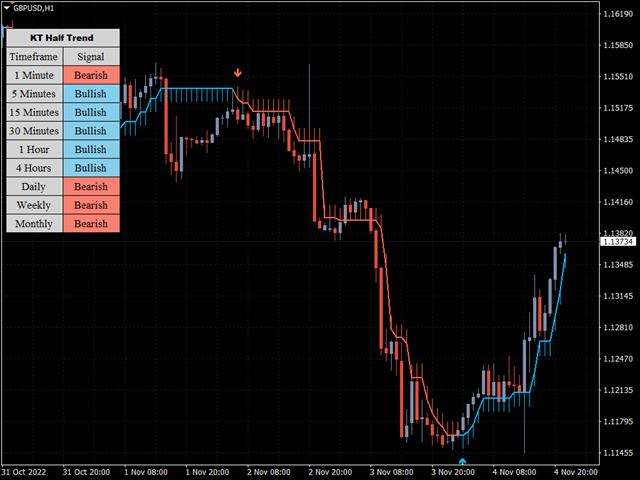
KT HalfTrend は、移動平均線に基づくトレンド指標であり、チャート上にゾーンを描画します。トレンドの変化を示すために、強気および弱気の無効化ゾーンを視覚的に表示します。
また、メインチャート上に矢印を用いて売買の強さを示します。トレンドがない場合、インジケーターはフラットになります。これは蓄積、価格の一時停滞、または分配ゾーンであることを示唆します。トレンドがある場合、傾きがその方向に現れます。
傾きが急であるほど、トレンドシグナルはより強力です。強い上昇トレンドは青色で、強い下降トレンドは赤色で示されることがあります。
機能
- 非常に使いやすく、視覚的にも優れたインジケーターです。
- すべての通貨ペアと時間枠で効果的に使用できます。
- 積極的なエントリーと慎重なエントリーの両方に対応しています。
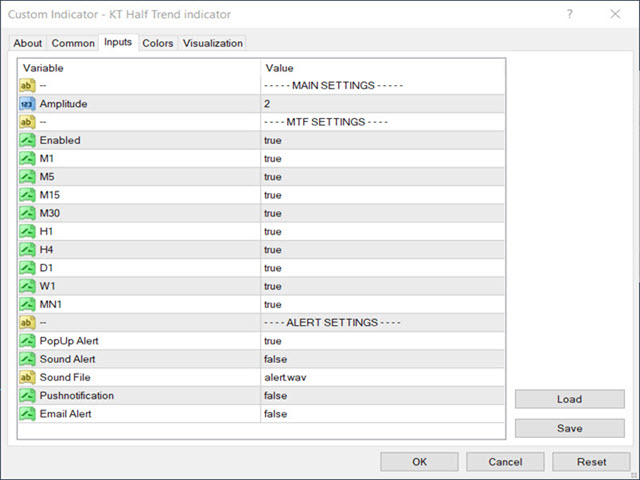
- 移動平均、パラボリックSAR、色設定などをカスタマイズ可能です。
活用方法
一般的に、価格がインジケーターの傾きを上回り、HalfTrendが青に変わると買いの条件が整います。
価格ローソク足の下に青い上向き矢印が表示され、強気のシグナルを示します。ストップロスはインジケーターの下に設定します。
赤い下向き矢印が表示された場合、買いポジションを終了するか、利確注文を設定してください。
価格がインジケーターの傾きを下回り、HalfTrendが赤に変化した場合、売りの条件となります。
その際は価格ローソク足の上に赤い矢印が表示され、ストップロスはインジケーターの上に置きます。
その後青い矢印が表示されたら、売りポジションの利確やクローズを検討してください。