• Обзор
  • Отзывы
  • Обсуждение

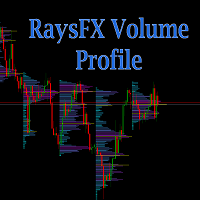
RaysFX Volume Profile

Calculation method

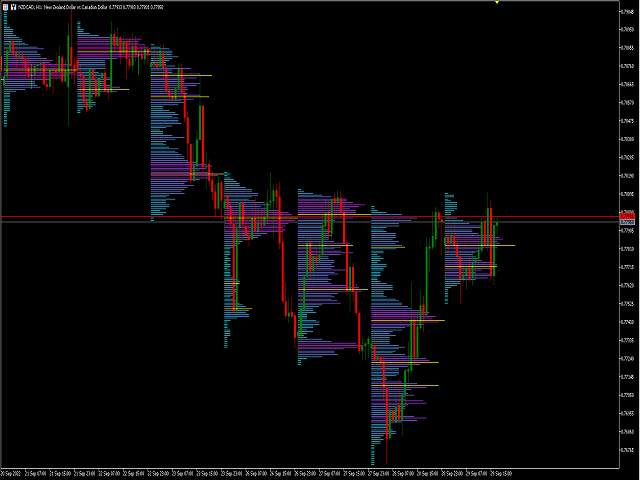
The calculation method is summing the number of deals performed at a certain price. Alternatively, the volumes at a certain price can be summed if the real volume type is set in the parameters.

The trade data is interpolated based on the most accurate terminal data available (М1 timeframe data). Each bar is divided into several trades based on the estimated price movement inside the bar. This is a distinguishing feature of the product setting it apart from other ones that have no interpolation and use the timeframe the indicator is launched at.

A further accuracy improvement without the use of additional sources could have been reached due to more reliable interpolation of M1 data to ticks. But almost every broker using MetaTrader 4 has its own quote flow making such improvements practically useless. Tests show that distributions look almost similar at all brokers. Used methods provide results comparable to distributions received using the most accurate data.

Distributions maximums (modes) are usually used as support/resistance levels. There is no point in searching for a maximum mode when determining a good level due to a "shading problem" - the next price cluster greatly affects the previous one sometimes hiding it completely, and vice versa. Study the chart carefully and specify the levels by constructing distributions on the most interesting segments with the help of VP-Range. Distributions at a bigger range may have greater weight.

parameters

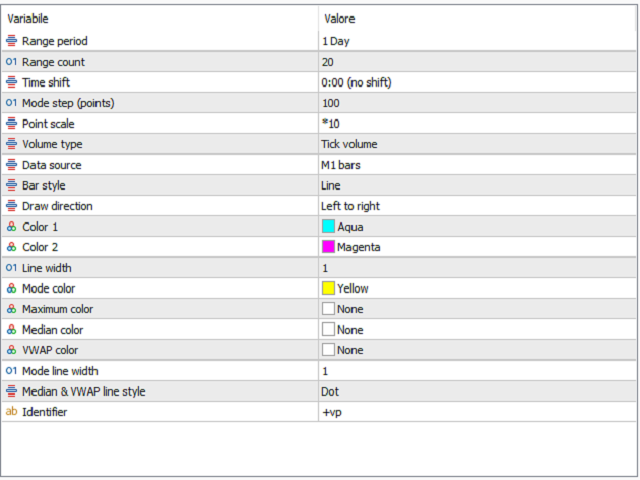
Parameter Description
Range period Timeframe, only standard values from M1 to MN1 (1, 5, 15, 30, 60, 240, 1440, 10080, 43200). MT5 also allows using intermediate timeframes.
Range count Number of ranges.
Time shift Time shift from -12 to +12 hours with a one hour step.

Mode step (points) The minimum step between the modes (selected subjectively for each symbol).
Point scale Point scale when drawing the histogram. The greater the value, the faster the operation but the more rough the display.
Volume type Volume type (tick or real). If a broker does not provide real volume, the indicator will show nothing.
Data source Data source:
  • Ticks (MT5 only) - ticks from your broker's server (if available)
  • M1, M5, M15 - interpolated ticks based on bars of the specified timeframe
Bar style Histogram bar style:
  • Lines - lines
  • Empty bar - empty rectangles
  • Filled bar- filled rectangles
  • Outline
  • Color
Color 1 Histogram color 1. Set to None to use a chart background color.
Color 2 Histogram color 2. Set to None to use a chart background color.
Line width Line width when drawing a histogram.
Mode color (None=disable) Local maximum color (distribution mode). Set None to disable.
Maximum color (None=disable) Maximum color. Set None to disable.
Median color (None=disable) Median color. Set None to disable.
VWAP color (None=disable) VWAP color (average weighted by price volume). Set None to disable.
Mode line width Mode line width.
Median & VWAP line style Style of median lines and VWAP.
Identifier Indicator ID, use different values for several indicator instances on a single chart.


Рекомендуем также
Description The indicator uses market profile theory to show the most relevant trading zones, on a daily basis. The zones to be shown are LVN (low volume nodes) and POC (point of control). An LVN zone is one which represents price areas with the least time or volume throughout the day. Typically, these areas indicate a supply or demand initiative, and in the future, they can turn into important breakout or retracement zones. A POC zone is one which represents price areas with the most time or vo
FREE
Индикатор вычисляет профиль объёма и выставляет метки, соответствующие уровням VAL, VAH и POC, для каждой свечи индивидуально. Особенности работы индикатора Индикатор работает на периодах от M3 до MN, но для вычислений использует исторические данные меньших периодов: M1 - для периодов от M3 до H1, M5 - для периодов от H2 до H12, M30 - для периода D1, H4 - для периода W1, D1 - для периода MN. Цвет и положение меток VAL, VAH и POC на текущей свече считаются корректными только по времени близкому
FREE
BoxChart MT5
Evgeny Shevtsov
5 (6)
Рынок несправедлив, хотя бы потому, что всего лишь 10% игроков управляют 90% капитала. У рядового трейдера мало шансов, чтобы противостоять этим «хищникам». Но выход есть, необходимо всего лишь перейти на другую сторону, необходимо находиться в числе этих 10% «акул», научиться распознавать их намерения и двигаться вместе с ними. Объем - это единственный опережающий фактор, который безупречно работает на любом периоде и любом торговом инструменте. Сначала зарождается и накапливается объем, и толь
33 USD
PZ Penta O MT5
PZ TRADING SLU
3.8 (5)
The Penta-O is a 6-point retracement harmonacci pattern which usually precedes big market movements. Penta-O patterns can expand and repaint quite a bit. To make things easier this indicator implements a twist: it waits for a donchian breakout in the right direction before signaling the trade. The end result is an otherwise repainting indicator with a very reliable trading signal. The donchian breakout period is entered as an input. [ Installation Guide | Update Guide | Troubleshooting | FAQ | A
FREE
The idea of a Value Chart indicator was presented in the very good book I read back in 2020 , " Dynamic Trading Indicators: Winning with Value Charts and Price Action Profile ", from the authors Mark Helweg and David Stendahl. The idea is simple and the result is pure genius: Present candlestick Price analysis in a detrended way! HOW TO READ THIS INDICATOR Look for Overbought and Oversold levels. Of course, you will need to test the settings a lot to find the "correct" one for your approach.
FREE
Order Book, известный также как Market Book, глубина рынка, стакан цен, Level 2, - это предоставляемая брокером динамически обновляемая таблица с данными по текущим объемам торговых заявок на покупку и продажу для различных уровней цен вблизи Bid и Ask конкретного финансового инструмента. MetaTrader 5 предоставляет возможность трансляции стакана цен , но только в реальном времени. Данный индикатор OrderBook Cumulative Indicator позволяет аккумулировать данные стакана онлайн и визуализировать их
49 USD
Индикатор анализирует шкалу объёмов и разделяет её на две компоненты - объёмы продавцов и объёмы покупателей, а также вычисляет дельту и кумулятивную дельту. Индикатор не мерцает и не перерисовывает, вычисления и отрисовку производит достаточно быстро, используя при этом данные с младших (относительно текущего) периодов. Режимы работы индикатора переключаются с помощью входной переменной Mode : Buy - отображает только объёмы покупателей. Sell - отображает только объёмы продавцов. BuySell - отобр
FREE
Aggression Volume
Flavio Jarabeck
3.79 (19)
Aggression Volume Indicator is the kind of indicator that is rarely found in the MQL5 community because it is not based on the standard Volume data provided by the Metatrader 5 platform. It requires the scrutiny of all traffic Ticks requested on the platform... That said, Aggression Volume indicator requests all Tick Data from your Broker and processes it to build a very special version of a Volume Indicator, where Buyers and Sellers aggressions are plotted in a form of Histogram. Additionally,
FREE
Bear Bull
Ignacio Agustin Mene Franco
Bear Bull! It is an indicator that marks with Heikin Ashi candles but modified, the sales and purchases long and short trend! with 2 colors green marks the purchase, purple marks the sale, works for any type of temporality, works for forex markets and synthetic indices! ideal for any pair, it also works for crypto pairs, Good profit! World Investor - World Inversor - 
30 USD
Volumes Direction MT5
William Oswaldo Mayorga Urduy
НАПРАВЛЕНИЕ ОБЪЕМОВ MT5 Обычно индикатор громкости меняет цвет по умолчанию, когда текущий объем выше предыдущего, это важно, но не очень полезно. По этой причине был создан этот индикатор, который в дополнение к нормальному объему, когда свеча является бычьей или медвежьей, он окрашивает их в другой цвет, по умолчанию синий для бычьего и красный для медвежьего, но эти цвета можно настроить для Вкус трейдера. Не забудьте проверить другие мои индикаторы, которые помогут вам улучшить ва
38 USD
Индикатор строит текущие котировки, которые можно сравнить с историческими и на этом основании сделать прогноз ценового движения. Индикатор имеет текстовое поле для быстрой навигации к нужной дате. Параметры : Symbol - выбор символа, который будет отображать индикатор; SymbolPeriod - выбор периода, с которого индикатор будет брать данные; IndicatorColor - цвет индикатора; Inverse - true переворачивает котировки, false - исходный вид; Далее идут настройки текстового поля, в которое можн
55 USD
You can download the Full version with more features here . Introduction This indicator scans AB=CD retracement patterns in all charts. The ABCD is the basic foundation for all harmonic patterns and highly repetitive with a high success rate . The ABCD Scanner indicator is a scanner reversal ABCD pattern that helps you identify when the price is about to change direction. The idea is that you can buy when prices are low and sell when they are high. This indicator is easy to use with stop loss, e
FREE
Профиль Рынка (Market Profile) определяет ряд типов дней, которые помогают трейдеру распознать поведение рынка. Ключевая особенность - это область значений (Value Area), представляющая диапазон ценового действия, в котором произошло 70% торговли. Понимание области значений может помочь трейдерам вникнуть в направление рынка и установить торговлю с более высокими шансами на успех. Это отличное дополнение к любой системе, которую вы возможно используете. Blahtech Limited представляет сообществу Me
142 USD
支点交易 : 1.pp 支点 2. r1 r2 r3 , s1 s2  s3 交易实用必备工具指标 波浪自动计算指标,通道趋势交易 完美的趋势-波浪自动计算通道计算 , MT4版本 完美的趋势-波浪自动计算通道计算 , MT5版本 本地跟单复制交易 Easy And Fast Copy , MT4版本 Easy And Fast Copy , MT5版本 本地跟单复制交易 模拟试用 Easy And Fast Copy , MT4 模拟账号运行 Easy And Fast Copy , MT5 模拟账号运行 支点( pivot points) 作为一种交易策略已经很长时间了,最初是场内交易员使用这种方法。使用这种方法通过几个简单的计算就可以了解市场在一天中的去向。 支点法中的支点是一天中市场方向的转向点,通过简单地计算前日的高点、低点和收盘价,可以得到一系列点位。这些点位可能形成关键的支撑和阻力线。支点位,支撑和阻力位被统称为支点水位。 你所看到的市场每天都有开盘价、高价、低价及收盘价(有一些市场是 24 小时开盘,比如外汇市场,通常用 5pm EST 作为开盘和收盘时间)。这些信
30 USD
Wapv Price and volume
Eduardo Da Costa Custodio Santos
Индикатор цены и объема WAPV для MT5 является частью набора инструментов (Wyckoff Academy Wave Market) и (Wyckoff Academy Price and Volume). Индикатор цены и объема WAPV для MT5 был создан, чтобы упростить визуализацию движения объема на графике интуитивно понятным способом. С его помощью можно наблюдать моменты пикового объема и моменты, когда рынок не представляет профессионального интереса. Определите моменты, когда рынок движется по инерции, а не по движению «умных денег». Он состоит из 4 цв
40 USD
Accurate
Aleksandr Kostusev
5 (1)
Индикатор автоматически выстраивает патерны следующих типов - "Бичий Флаг", "Медвежий Флаг","Бычий Вымпел", "Медвежий Вымпел", "Бычий Падающий Клин", "Медвежий восходящий клин". Так же индикатор стрелками сигнализирует о возможной точке входа. Индикатор муьтивалютный, торговать можно всем начиная от криптовалют, заканчивая индексами. Чем выще таймфрейм инструмента, на котором стоит индикатор, тем точнее точка входа а ценовое движение будет намного длиннее!
FREE
Market Profile FX
Nguyen Duc Quy
4.91 (23)
Market profile was developed by Peter Steidlmayer in the second half of last century. This is a very effective tool if you understand the nature and usage. It's not like common tools like EMA, RSI, MACD or Bollinger Bands. It operates independently of price, not based on price but its core is volume. The volume is normal, as the instrument is sung everywhere. But the special thing here is that the Market Profile represents the volume at each price level. 1. Price Histogram The Price Histogram
FREE
Индикатор находит уровни максимального и минимального ценового объема (профиль рынка) на рабочей гистограмме для указанного количества баров.  Композитный профиль. Высота гистограммы полностью автоматическая и адаптируется к любому инструменту и таймфрейму. Используется авторский алгоритм и не повторяет известные аналоги. Высота двух гистограмм примерно равна средней высоте свечи. Умное оповещение (smart alert) поможет вам сообщить о цене, касающейся уровня объема. Концепция Smart Money  Low V
35 USD
KT Double Top Bottom MT5
KEENBASE SOFTWARE SOLUTIONS
1 (1)
The double top bottom pattern is arguably one of the technical analysis's most popular chart patterns. These patterns are used to capitalize on recurring patterns and identify trend reversal patterns, thereby creating well-placed entry and exit levels. The KT Double Top Bottom is based on these patterns and fine-tunes the trade signal development process for traders. Features It's based on one of the most reliable trading patterns and brings some fine-tuning and automation to the process. A
30 USD
MW Volume
Martin Bittencourt
4.67 (3)
The Martinware Volume indicator plots a colored moving average over volume bars. The coloring uses three colors and can be done in different ways choosable by the user and is applied both to the average as to the volume bars. Three types of coloring are possible: None: no coloring is done Increasing or decreasing: changes the color depending on the current value being bigger or lesser than the previous one Volume relative to average: colors vary if the current volume is bigger or lesser then
FREE
Система для визуализации популярных шаблонов ценовых формаций. После подключения индикатор автоматически отобразит на графике следующие формации: Пиноккио бар (“пинбар”)   - свеча с небольшим телом и длинным “носом”, очень известный разворотный шаблон; Внутренний бар   - свеча, диапазон которой лежит внутри диапазона предыдущей свечи. Такая формация представляет неопределённость рынка; Внешний бар   - свеча, диапазон которой превышает диапазон предыдущей свечи. Такая формация представляет неопре
30 USD
Do you use volume in your reading of the market? Certainly many traders use it, and do not imagine operating without it. The Color Histogram Volume Set indicator allows the user to choose the value that he considers interesting to monitor. When you pass this you will have visual confirmation and if you want you will also have the audible alert that is given by the indicator. Of course, there are other ways to try to find a high volume, such as assessing whether the volume
30 USD
Segmented Volume MT5
Eduardo Da Costa Custodio Santos
Индикатор сегментированного объема MT5 был создан для облегчения торговли с использованием анализа цен и объема, VSA, VPA, метода Wyckoff и системы Smart Money. Сегментированный объем работает на любом рынке (Crypto, CFD, Forex, Futures, Stocks ...) и работает в любое время графика. Посмотрите, насколько проста ваша интерпретация: # Зеленый: объем намного выше, чем в среднем по рынку. # Темно-розовый: громкость выше среднего. # Синий: положительная нормальная громкость. # Красный: отрицательная
30 USD
Tapeworm
Nikolay Mitrofanov
Индикатор преобразует две скользящие средние в гистограммы и закрашивает их область пресечения. Есть настройка   shift trick  она используется для сглаживания результата расчетов. Можно увидеть изменения, если уменьшить этот параметр до 1(минимальное значение). Доступные средние: MA Simple      MA Exponential MA LinearWeighted MA Smoothed DEMA TEMA и RSI    - как бонус По умолчанию в верхней части гистограммы отображается быстрая MA, внизу - медленная. Можно поменять их местами, если хочется. sh
FREE
The Donchian Channel Channels are among the most popular tools of technical analysis, as they visually convey to the analyst the limits within which most price movement tends to occur. Channel users know that valuable information can be obtained at any time, whether prices are in the central region of a band or close to one of the border lines. One of the best known techniques to explore these concepts is Bollinger Bands. However, John Bollinger was not the only one to research the applicatio
FREE
Индикатор создан для торговой системы  "Masters of Risk" . Объем POC, известный как "Point of Control" , — это цена с наибольшим объемом торгов за выбранный период времени. По этой цене аккумулировались позиции крупных трейдеров и институтов. Он служит ориентиром для всех участников рынка. Цена обычно реагирует на уровни POC. Индикатор может показывать изменение цены накопления максимального объема (POC). Настройки сравнивались с объемами в терминале NinjaTrader 8 с датафидом CQG . Сравнивались
150 USD
Market Profile 3 ForexArby com
Hussien Abdeltwab Hussien Ryad
3.8 (5)
Market Profile 3 MetaTrader 5 indicator  version 4.70— is a classic Market Profile implementation that can show the price density over time, outlining the most important price levels, value area, and control value of a given trading session. This indicator can be attached to timeframes between M1 and D1 and will show the Market Profile for daily, weekly, monthly, or even intraday sessions. Lower timeframes offer higher precision. Higher timeframes are recommended for better visibility. It is als
FREE
Before installing the HeatMap indicator make sure you are using a broker that gives you access to the Depth of market (DOM) !! This indicator creates a heatmap on your chart allowing you to see the buy or sell limit orders easily and in real time. You have the possibility to change the setting and the colors of the HeatMap in order to adapt to all markets and all charts. Here is an example of a setting you can use with the NASDAQ100 on the AMPGlobal broker :  https://www.youtube.com/watch?v=x0
80 USD
Индикатор позволяет анализировать изменения тиковых объемов в виде кумулятивных дельта-баров (свечей). Он вычисляет на каждом баре тиковые объемы для покупок и продаж (раздельно), а также их разницу. Кроме того, он может выводить объемы в разбивке по кластерам (ячейкам) цен внутри указанного бара (обычно это последний бар). Данный индикатор производит вычисления аналогично VolumeDeltaMT5 , но предоставляет иное отображение результатов. Имеется версия для МетаТрейдер 4 - CumulativeDeltaBars . Это
30 USD
Micro  Demo  ******************* Секундные графики в Meta Trader 5 ********************** Более точного инструмента для входа в сделку вы не найдёте. Платная полная версия:  Micro "Second charts" В демоверсии секундные периоды сменяются случайным образом через случайные интервалы времени. Отсутствует автоматическая настройка периодов бесплатных индикаторов.   Входные параметры: Displayed bars - отображаемые бары Step of price levels, pp, 0-off - шаг отрисовки ценовых уровней, пункты Scale
FREE
С этим продуктом покупают
ICT, SMC, SMART MONEY CONCEPTS, SMART MONEY, Smart Money Concept, Support and Resistance, Trend Analysis, Price Action, Market Structure, Order Blocks, BOS/CHoCH,   Momentum Shift, HH/LL/HL/LH,    Fair Value Gap, FVG,  Premium  &   Discount   Zones, Fibonacci Retracement, OTE, Buy Side Liquidity, Sell Side Liquidity, BSL/SSL Taken, Equal Highs & Lows, MTF, Multiple Time Frame, BigBar, HTF OB, HTF Market Structure,  Liquidity Voids, Long Wicks, Candle Timer, Fractals, ZigZag, Time Zone, Market S
63 USD
Топовый индикатор МТ5, дающий сигналы для входа в сделки без перерисовки! Идеальные точки входа в сделки для  валют, крипты, металлов, акций, индексов !  Смотрите  видео  (6:22) с примером отработки всего одного сигнала, окупившего индикатор. Версия индикатора для MT4 Преимущества индикатора Сигналы на вход без перерисовки Если сигнал появился, он никуда НЕ исчезает! В отличие от индикаторов с перерисовкой, которые ведут к потере депозита, потому что могут показать сигнал, а потом убрать его.
125 USD
Gold Stuff mt5
Vasiliy Strukov
4.97 (92)
Gold Stuff mt5 - трендовый индикатор, разработанный специально для золота, также может использоваться на любых финансовых инструментах. Индикатор не перерисовывается и не запаздывает. Рекомендуемый тайм-фрейм H1.  Свяжитесь со мной сразу после покупки для получения настроек и персонального бонуса! ПАРАМЕТРЫ Draw Arrow -   вкл.выкл. отрисовку стрелок на графике. Alerts -   вкл.выкл.звуковые оповещения. E-mail notification -   вкл.выкл. уведомления на почту. Puch-notification -   вкл.выкл. уведо
50 USD
Индикатор тренда, революционное уникальное решение для торговли и фильтрации тренда со всеми важными функциями тренда, встроенными в один инструмент! Это 100% неперерисовывающийся мультитаймфреймный и мультивалютный индикатор, который можно использовать на всех инструментах/инструментах: форекс, товары, криптовалюты, индексы, акции. Trend Screener - это эффективный индикатор, следующий за трендом, который выдает сигналы тренда в виде стрелок с точками на графике. Функции, доступные в индикаторе
50 USD
Индикатор Supply Demand использует предыдущее ценовое действие для выявления потенциального дисбаланса между покупателями и продавцами. Ключевым является определение зон с лучшими возможностями, а не просто вероятностей. Индикатор Blahtech Supply Demand обеспечивает функционал, не доступный ни в одной платформе. Этот индикатор 4 в 1 не только выделяет зоны с более высокой вероятностью на основе механизма оценки силы по множественным критериям, но также комбинирует его с мульти-таймфреймовым ана
142 USD
Этот индикатор является уникальным, качественным и доступным инструментом для торговли, включающим в себя наши собственные разработки и новую формулу. В обновленной версии появилась возможность отображать зоны двух таймфреймов. Это означает, что вам будут доступны зоны не только на старшем ТФ, а сразу с двух таймфреймов - таймфрейма графика и старшего: отображение вложенных зон. Обновление обязательно понравится всем трейдерам, торгующим по зонам спроса и предложения. Важная информация Для мак
199 USD
Сочетание тренда и пробоя уровней в одной системе. Продвинутый алгоритм индикатора фильтрует рыночный шум, определяет тренд, точки входа, а также возможные уровни выхода из позиции. Сигналы индикатора записываются в статистический модуль, который позволяет выбирать наиболее подходящие инструменты, показывая эффективность истории сигналов. Индикатор рассчитывает отметки ТейкПрофитов и стоплосса. Руководство пользователя ->  ЗДЕСЬ  / MT4 версия ->  ЗДЕСЬ Как торговать с индикатором: Торговля с Tr
55 USD
Станьте Breaker Trader и получайте прибыль от изменений структуры рынка по мере изменения цены. Индикатор выключателя блока ордеров определяет, когда тренд или движение цены приближаются к истощению и готовы развернуться. Он предупреждает вас об изменениях в структуре рынка, которые обычно происходят, когда произойдет разворот или серьезный откат. Индикатор использует собственный расчет, который определяет прорывы и ценовой импульс. Каждый раз, когда новый максимум формируется около возможн
49 USD
Индикатор разворота ADR сразу показывает, где в настоящее время торгуется цена относительно своего нормального среднего дневного диапазона. Вы будете получать мгновенные оповещения через всплывающие окна, электронную почту или push-уведомления, когда цена превышает свой средний диапазон и уровни выше него по вашему выбору, чтобы вы могли быстро переходить к откатам и разворотам. Индикатор рисует на графике горизонтальные линии на экстремумах среднего дневного диапазона, а также расширения выше
49 USD
Matrix Arrow Indicator MT5
Juvenille Emperor Limited
5 (11)
Индикатор Matrix Arrow MT5   — это уникальный индикатор тренда 10 в 1, следующий за   100% неперерисовывающимся   индикатором с несколькими таймфреймами, который можно использовать на всех символах/инструментах:   форекс ,  товары ,   криптовалюты ,   индексы ,  акции . Индикатор Matrix Arrow MT5  будет определять текущую тенденцию на ранних этапах, собирая информацию и данные от до 10 стандартных индикаторов, а именно: Индекс среднего направленного движения (ADX) Индекс товарного канала (CCI)
75 USD
Устали от построения линий поддержки и сопротивления? Сопротивление поддержки - это мульти-таймфреймовый индикатор, который автоматически обнаруживает и отображает линии поддержки и сопротивления на графике с очень интересным поворотом: поскольку ценовые уровни тестируются с течением времени и его важность возрастает, линии становятся более толстыми и темными. [ Руководство по установке | Руководство по обновлению | Устранение неполадок | FAQ | Все продукты ] Повысьте технический анализ в одноч
99 USD
Информационная панель ADR Alert показывает вам, где в настоящее время торгуется цена по отношению к ее нормальному среднему дневному диапазону. Вы будете получать мгновенные оповещения через всплывающие окна, электронную почту или push-уведомления, когда цена превышает свой средний диапазон и уровни выше него по вашему выбору, чтобы вы могли быстро переходить к откатам и разворотам. Черта предназначена для размещения на пустом графике и просто находится в фоновом режиме и предупреждает вас о до
49 USD
Royal Scalping Indicator is an advanced price adaptive indicator designed to generate high-quality trading signals. Built-in multi-timeframe and multi-currency capabilities make it even more powerful to have configurations based on different symbols and timeframes. This indicator is perfect for scalp trades as well as swing trades. Royal Scalping is not just an indicator, but a trading strategy itself. Features Price Adaptive Trend Detector Algorithm Multi-Timeframe and Multi-Currency Trend Low
149 USD
Introduction to X3 Chart Pattern Scanner X3 Cherart Pattern Scanner is the non-repainting and non-lagging indicator detecting X3 chart patterns including Harmonic pattern, Elliott Wave pattern, X3 patterns, and Japanese Candlestick patterns. Historical patterns match with signal patterns. Hence, you can readily develop the solid trading strategy in your chart. More importantly, this superb pattern scanner can detect the optimal pattern of its kind. In addition, you can switch on and off individu
250 USD
Offer 249 down from 350 for the next 3 copies. then back to 350 $ Are you tired of using outdated indicators that leave you guessing where to set your profit targets? Look no further than the AK CAP Opening Range Breakout Indicator. This powerful tool is backed by a US patent and has already helped countless traders pass funded challenges like FTMO. We use it daily on our prop traders and internal funds, and now it's available to you as well. The calculation behind the indicator is incredibly
249 USD
Линии тренда являются наиболее важным инструментом технического анализа в торговле на рынке Форекс. К сожалению, большинство трейдеров рисуют их неправильно. Индикатор Automated Trendlines — это профессиональный инструмент для серьезных трейдеров, который поможет вам визуализировать трендовое движение рынков. Есть два типа линий тренда: бычьи линии тренда и медвежьи линии тренда. В восходящем тренде линия тренда Форекс проводится через самые низкие точки колебания ценового движения. Сое
99 USD
Royal Wave Pro M5
Vahidreza Heidar Gholami
5 (2)
Royal Wave is a Trend-Power oscillator which has been programmed to locate and signal low-risk entry and exit zones. Its core algorithm statistically analyzes the market and generates trading signals for overbought, oversold and low volatile areas. By using a well-designed alerting system, this indicator makes it easier to make proper decisions regarding where to enter and where to exit trades. Features Trend-Power Algorithm Low risk Entry Zones and Exit Zones Predictions for Overbought and Over
129 USD
Stargogs Spike Catcher V3 This Indicator is Developed To milk the BOOM and CRASH indices . Send me Message if you need any help with the indicator.  CHECK OUT THE STARGOGS SPIKE CATCHER EA/ROBOT V3: CLICK HERE ALSO CHECK OUT SECOND TO NONEFX SPIKE CATCHER:   CLICK HERE STARGOGS SPIKE CATCHER V3 WHATS NEW! Brand New Strategy. This is the Indicator you need for 2023. The Indicator Gives you an Entry at a time when conditions are met and you should use TP & SL. New Trendline that changes color in
100 USD
Эта информационная панель представляет собой инструмент оповещения для использования с индикатором разворота структуры рынка. Его основная цель - предупредить вас о возможностях разворота на определенных временных рамках, а также о повторных проверках предупреждений (подтверждении), как это делает индикатор. Панель инструментов предназначена для самостоятельного размещения на графике и работы в фоновом режиме, чтобы отправлять вам оповещения о выбранных вами парах и таймфреймах. Он был разработ
49 USD
Инструкция работы с индикатором   |  Стратегия Owl Smart Levels   |  Версия MT4   |   Как установить?   |   FAQ Индикатор Owl Smart Levels – это полноценная торговая система внутри одного индикатора, которая включает в себя такие популярные инструменты анализа рынка как усовершенствованные фракталы Билла Вильямса , Valable ZigZag, который строит правильную волновую структуру рынка, а также  уровни Фибоначчи, которые   отмечают точные уровни входа в рынок и места взятия прибыли. 7 дневная акция
107 USD
Скринер поддержки и сопротивления находится в одном индикаторе уровня для MetaTrader, который предоставляет несколько инструментов внутри одного индикатора. Доступные инструменты: 1. Скринер структуры рынка. 2. Зона бычьего отката. 3. Зона медвежьего отката. 4. Ежедневные опорные точки 5. еженедельные опорные точки 6. ежемесячные опорные точки 7. Сильные поддержка и сопротивление, основанные на гармоническом паттерне и объеме. 8. Зоны уровня берега. ПРЕДЛОЖЕНИЕ ОГРАНИЧЕННОЕ ВРЕМЯ: Индикатор подд
50 USD
Auto Order Block with break of structure Detect Break of Structure , Mark Order Block and draw Entry / Stop and Risk to Reward lines when Order block is touch by price with Alert. Trend is Manually set to filter signals in a direction by a button on the chart. Entry / Stop and Risk to Reward lines can also be switch on / off by button on chart. Futures Auto Mark Break of Structure Auto Mark Order block Auto Mark higher time frame Point Of  Interest ( POI ) Popup Alert when BoS , Order block
55 USD
BUY INDICATOR AND GET EA FOR FREE AS A BONUS + SOME OTHER GIFTS! ITALO VOLUME INDICATOR  is the best volume indicator ever created, and why is that? The Indicator works on all time-frames and assets, indicator built after 6 years of experience on forex and many other markets. You know many volume indicators around the internet are not complete, does not help, and it's difficult to trade, but the Italo Volume Indicator is different , the Italo Volume Indicator shows the wave volume, when market
65 USD
**   All Symbols   x   All Timeframes   scan just by pressing scanner button ** *** Contact me immediately after the purchase to send you instructions and add you in "Market Structure group" for sharing or seeing experiences with other users. CURRENT PRICE $39..... Future Price $200 Introduction: Market structure is important for both new and professional traders since it can influence the liquidity and price action of a market. It’s also one of the most commonly used techniques to understand tr
39 USD
Сложно найти и дефицит по частоте, дивергенции являются одним из самых надежных торговых сценариев. Этот индикатор автоматически находит и сканирует регулярные и скрытые расхождения, используя ваш любимый осциллятор. [ Руководство по установке | Руководство по обновлению | Устранение неполадок | FAQ | Все продукты ] Легко торговать Находит регулярные и скрытые расхождения Поддерживает много известных генераторов Реализует торговые сигналы на основе прорывов Отображает подходящие уровни ст
125 USD
Trend Scanner mt5 сканирует рыночные тренды с мультисимволов и мультитаймфреймов и отображает их на подвижной панели на графике. Он использует индикатор   Gold Stuff   для анализа.  Трейдер может выбрать несколько пар по своему выбору для отображения. Trend Scanner — отличный инструмент для определения направления тренда, который можно использовать для ручной торговли или торговли с помощью советника, разрешая только ордера на покупку или продажу в соответствии с трендом. Результаты в режиме
50 USD
Следующее поколение автоматизированных зон спроса и предложения. Новый инновационный алгоритм, работающий на любом графике. Все зоны создаются динамически в соответствии с ценовым действием рынка. ДВА ТИПА СИГНАЛОВ --> 1) ПРИ ПОПАДАНИИ ЦЕНЫ В ЗОНУ 2) ПРИ ФОРМИРОВАНИИ НОВОЙ ЗОНЫ Вы не получите еще один бесполезный индикатор. Вы получаете полную торговую стратегию с проверенными результатами.     Новые особенности:     Оповещения, когда цена достигает зоны спроса/предложения
149 USD
Уровни поддержки и сопротивления с давних времен были мощнейшим инструментом для анализа рынка. Strong Support индикатор строит уровни поддержки по локальным минимумам цены, а уровни сопротивления по локальным максимумам цены.  Другие мои разработки можно посмотреть   здесь Рекомендуется использовать совместно с трендовым индикатором, например,   Gold Stuff   - это позволит торговать по тренду и одновременно определять зоны консолидации или разворота тренда, а также устанавливать стоп-лосс и тей
50 USD
** All Symbols x All Timeframes scan just by pressing scanner button ** ***Contact me after purchase to send you instructions and add you in "123 scanner group" for sharing or seeing experiences with other users. After 15 years of experience in the markets and 3 years of programming, Winner indicator is ready. I would like to share with you! Introduction The 123 Pattern Scanner indicator with a special enhanced algorithm is a very repetitive common pattern finder with a high success rate . Inte
39 USD
** All Symbols x All Timeframes scan just by pressing scanner button ** *** Contact me after the purchase to send you instructions and add you in "ABCD scanner group" for sharing or seeing experiences with other users. Introduction This indicator scans AB=CD retracement patterns in all charts. The ABCD is the basic foundation for all harmonic patterns and highly repetitive with a high success rate . The ABCD Scanner indicator is a scanner reversal ABCD pattern that helps you identify when the pr
39 USD
Другие продукты этого автора
Questa utility di base non agisce in automatico, ma supporterà il trader, ti aiuterà nella gestione dei lotti tramite: martingala potrai impostare TP e SL se vuoi piazzare ordini senza l'uso della martingala. Consiglio: Questo EA ti aiuterà nella gestione dei tuoi ordini ed è  ottimo abbinarlo ad indicatori come i pattern (trovate nel nostro store anche un indicatore pattern completo)
30 USD
Questo indicatore fractal ti invierà un messaggio telefonico (tramite app mt4) non è necessaria la configurazione dell'indicatore, basta impostare l'ID del tuo smartphone e potrai ricevere il messaggio BUY o SELL in tempo reale (affidabilità 80%) per qualsiasi domanda o dubbio non esitate a contattarmi su mql5.com o telegram (link al gruppo disponibile in bio)
30 USD
Questo EA studia le tendenze dei mercati ed è possibile scegliere fra: il tipo di lotto da usare: fisso/equity/auto l'uso del sistema martingala Auto TP/SL Questo EA è consigliato per il trading a LUNGO TERMINE, quindi potrete avere il conto leggermente sotto il vostro capitale iniziale anche per qualche mese, ma con le impostazioni più conservative possibili recupererete sempre il capitale. Per i FILE SET cliccare qui:  LINK Raccomandazioni:   Con meno di 10.000€ è consigliato un lottaggio bas
199 USD
What Is MT4 Candlestick Pattern Indicator Candlestick patterns are groups of candlestick that have a meaning for the trader. These groups are usually composed of two, three, four, or five candles and indicate some form of price action happening. In many cases traders use these patterns to decide what to do next. Candlestick Pattern Indicator for MT4 is a plugin that allows you to see the most common candlestick patterns on your chart. The indicator scans the chart and detects popular patterns, m
40 USD
Tra le tecniche alternative di trading più utilizzate dagli investitori, uno spazio interessante va dato alla   strategia Ichimoku cloud   che si basasulle nuvole (kumo). Queste ultime sono il vero fulcro del sistema di trading Hichimoku Kinko Hyo. Molti erroneamente pensano che l’Ichimoku Kinko Hyo sia un semplice indicatore trend following, mentre invece è un vero e proprio   sistema di trading completo . Infatti   grazie a UN SOLO grafico (sia pure molto complesso) ci dà una visione complet
30 USD
Questo indicatore è studiato per analizzare: Lo Stochastic Oscillators , la Moving Averages , il MACD , il crossover MA , e per finire i Parabolic SAR. Il tutto viene racchiuso in un grafico che indicherà con frecce e spettri il momento ideale per aprire un trade. "La precisione dei segnali dipende sempre dai valori impostati, con i valori stock si ha un ottima affidabilità "
69 USD
Trade Assistant MetaTrader indicator  — a multi-timeframe indicator that is based on three standard indicators:   Stochastic oscillator ,   RSI   (Relative Strength Index), and   CCI   (Commodity Channel Index). It displays current trend directions for M1, M5, M15, M30, H1, H4, D1, W1, and MN1 timeframes. When you follow such an indicator you have a clear picture of the trends across all important timeframes. It doesn't matter which timeframe you attach this indicator to. The indicator can be d
49 USD
What Is Supertrend Line Indicator? MT4 Supertrend Line indicator is a great tool to add to your MetaTrader platform. Supertrend indicator uses a combination of a   moving average   and   average true range   to detect the trend of a trading instrument. Supertrend indicator for MetaTrader 4 easily shows the trend as a line following the price. Basically, the indicator takes into account the volatility of the price and draws a line on the chart showing if the price is likely to be in an uptrend or
40 USD
RaysFX (Average Directional Movement Index) Technical indicator (ADX) helps to determine the market trend. It was developed and described in detail by Welles Wilder. The simplest trading method based on the system of directional movement implies comparison of two direction indicators: the 14-period +DI one and the 14-period -DI. To do this, one either puts the charts of indicators one on top of the other, or +DI is subtracted from -DI. W. Wilder recommends buying whenever the +DI crosses ab
30 USD
RaysFX (Average Directional Movement Index) to → ARROW Technical indicator (ADX) helps to determine the market trend. It was developed and described in detail by Welles Wilder. The simplest trading method based on the system of directional movement implies comparison of two direction indicators: the 14-period +DI one and the 14-period -DI. To do this, one either puts the charts of indicators one on top of the other, or +DI is subtracted from -DI. W. Wilder recommends buying whenever the +DI
30 USD
Фильтр:
Нет отзывов
Ответ на отзыв