RaysFX Volume Profile
- Indicadores
- Versión: 1.2
- Activaciones: 5

Método de cálculo
El método de cálculo consiste en sumar el número de operaciones realizadas a un precio determinado. Alternativamente, los volúmenes a un determinado precio pueden ser sumados si el tipo de volumen real se establece en los parámetros.
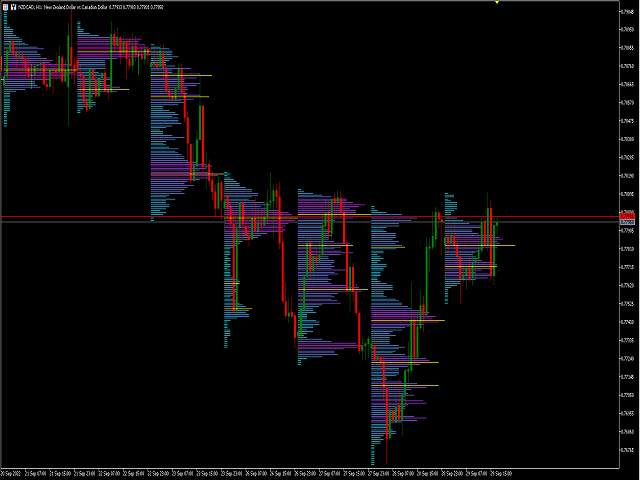
Los datos comerciales se interpolan basándose en los datos de terminal más precisos disponibles (datos de marco temporal М1). Cada barra se divide en varias operaciones en función del movimiento estimado del precio dentro de la barra. Esta es una característica distintiva del producto que lo diferencia de otros que no tienen interpolación y utilizan el marco de tiempo en el que se lanza el indicador.
Se podría haber alcanzado una mayor mejora de la precisión sin el uso de fuentes adicionales debido a una interpolación más fiable de los datos M1 a los ticks. Pero casi todos los brokers que utilizan MetaTrader 4 tienen su propio flujo de cotizaciones, lo que hace que estas mejoras sean prácticamente inútiles. Las pruebas muestran que las distribuciones son casi similares en todos los brokers. Los métodos utilizados proporcionan resultados comparables a las distribuciones obtenidas utilizando los datos más precisos.
Los máximos (modos) de las distribuciones suelen utilizarse como niveles de soporte/resistencia. No tiene sentido buscar un modo máximo a la hora de determinar un buen nivel debido a un "problema de sombreado": el siguiente grupo de precios afecta en gran medida al anterior, a veces ocultándolo por completo, y viceversa. Estudie detenidamente el gráfico y especifique los niveles construyendo distribuciones en los segmentos más interesantes con la ayuda de VP-Range. Las distribuciones en un rango mayor pueden tener mayor peso.
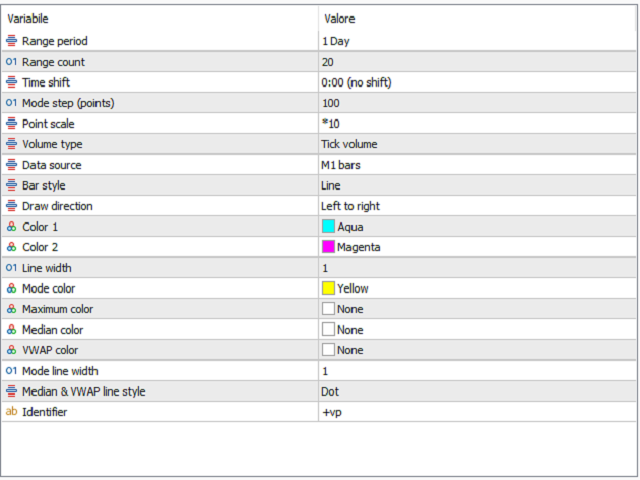
parámetros
| Parámetro | Descripción |
|---|---|
| Período de rango | Timeframe, sólo valores estándar de M1 a MN1 (1, 5, 15, 30, 60, 240, 1440, 10080, 43200). MT5 también permite utilizar plazos intermedios. |
| Recuento de rangos | Número de rangos. |
| Desplazamiento temporal | Desplazamiento temporal de -12 a +12 horas con un paso de una hora. |
| Paso de modo (puntos) | El paso mínimo entre los modos (seleccionado subjetivamente para cada símbolo). |
| Escala de puntos | Escala de puntos al dibujar el histograma. Cuanto mayor sea el valor, más rápida será la operación pero más tosca será la visualización. |
| Tipo de volumen | Tipo de volumen (tick o real). Si un broker no proporciona volumen real, el indicador no mostrará nada. |
| Fuente de datos | Fuente de datos:
|
| Estilo de barra | Estilo de barra de histograma:
|
| Color 1 | Color del histograma 1. Configure a Ninguno para usar un color de fondo de gráfico. |
| Color 2 | Color del histograma 2. Establecer en Ninguno para utilizar un color de fondo de gráfico. |
| Ancho de línea | Ancho de línea cuando se dibuja un histograma. |
| Color modo (Ninguno=desactivar) | Color máximo local (modo de distribución). Establezca Ninguno para desactivar. |
| Color máximo (Ninguno=desactivar) | Color máximo. Desactive esta opción. |
| Color medio (Ninguno=desactivar) | Color medio. Desactive esta opción. |
| Color VWAP (Ninguno=desactivar) | Color VWAP (media ponderada por volumen de precios). Desactive esta opción. |
| Ancho de línea de modo | Ancho de la línea de modo. |
| Estilo de línea mediana y VWAP | Estilo de las líneas de mediana y VWAP. |
| Identificador | Identificador del indicador, utilice valores diferentes para varias instancias del indicador en un mismo gráfico. |