RaysFX Volume Profile
- インディケータ
- バージョン: 1.2
- アクティベーション: 5

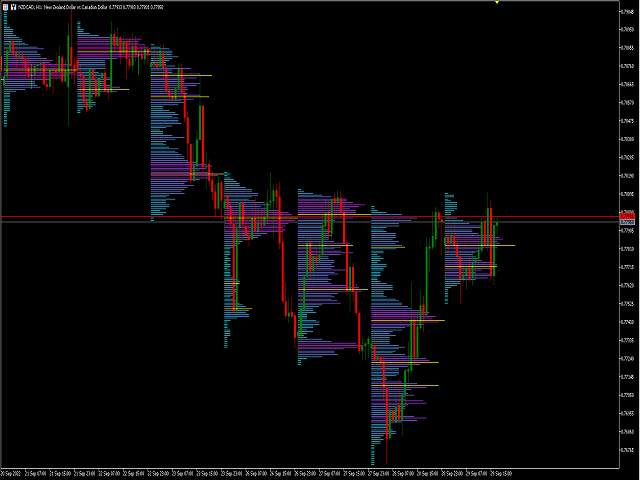
Calculation method
The calculation method is summing the number of deals performed at a certain price. Alternatively, the volumes at a certain price can be summed if the real volume type is set in the parameters.
The trade data is interpolated based on the most accurate terminal data available (М1 timeframe data). Each bar is divided into several trades based on the estimated price movement inside the bar. This is a distinguishing feature of the product setting it apart from other ones that have no interpolation and use the timeframe the indicator is launched at.
A further accuracy improvement without the use of additional sources could have been reached due to more reliable interpolation of M1 data to ticks. But almost every broker using MetaTrader 4 has its own quote flow making such improvements practically useless. Tests show that distributions look almost similar at all brokers. Used methods provide results comparable to distributions received using the most accurate data.
Distributions maximums (modes) are usually used as support/resistance levels. There is no point in searching for a maximum mode when determining a good level due to a "shading problem" - the next price cluster greatly affects the previous one sometimes hiding it completely, and vice versa. Study the chart carefully and specify the levels by constructing distributions on the most interesting segments with the help of VP-Range. Distributions at a bigger range may have greater weight.
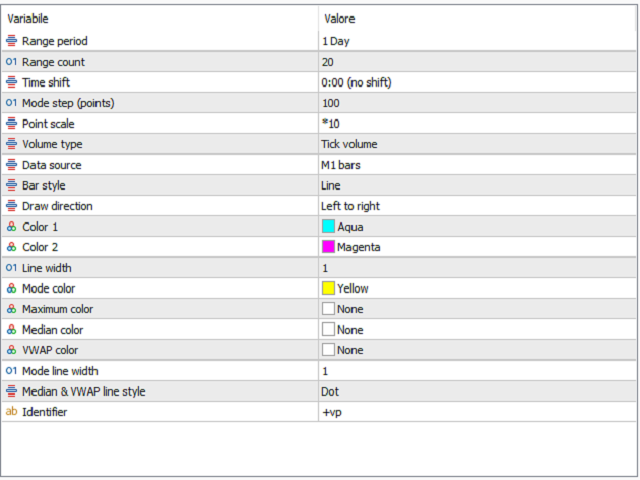
parameters
| Parameter | Description |
|---|---|
| Range period | Timeframe, only standard values from M1 to MN1 (1, 5, 15, 30, 60, 240, 1440, 10080, 43200). MT5 also allows using intermediate timeframes. |
| Range count | Number of ranges. |
| Time shift | Time shift from -12 to +12 hours with a one hour step. |
| Mode step (points) | The minimum step between the modes (selected subjectively for each symbol). |
| Point scale | Point scale when drawing the histogram. The greater the value, the faster the operation but the more rough the display. |
| Volume type | Volume type (tick or real). If a broker does not provide real volume, the indicator will show nothing. |
| Data source | Data source:
|
| Bar style | Histogram bar style:
|
| Color 1 | Histogram color 1. Set to None to use a chart background color. |
| Color 2 | Histogram color 2. Set to None to use a chart background color. |
| Line width | Line width when drawing a histogram. |
| Mode color (None=disable) | Local maximum color (distribution mode). Set None to disable. |
| Maximum color (None=disable) | Maximum color. Set None to disable. |
| Median color (None=disable) | Median color. Set None to disable. |
| VWAP color (None=disable) | VWAP color (average weighted by price volume). Set None to disable. |
| Mode line width | Mode line width. |
| Median & VWAP line style | Style of median lines and VWAP. |
| Identifier | Indicator ID, use different values for several indicator instances on a single chart. |