KT ZigZag Arrows MT5
- Индикаторы
-
KEENBASE SOFTWARE SOLUTIONS
 Keenbase Trading разрабатывает профессиональные индикаторы и советники (Expert Advisors) для MetaTrader 4 и MetaTrader 5, помогая трейдерам принимать более взвешенные торговые решения.
 - Версия: 1.0
- Активации: 10
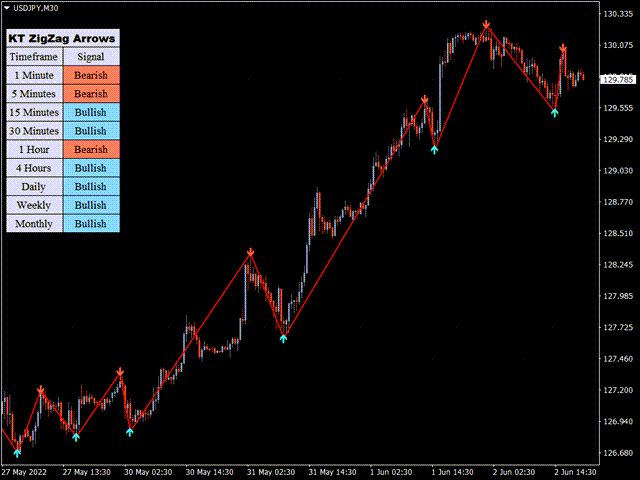
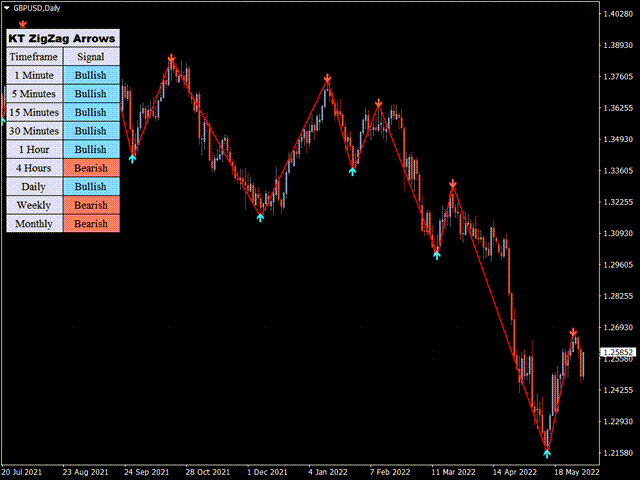
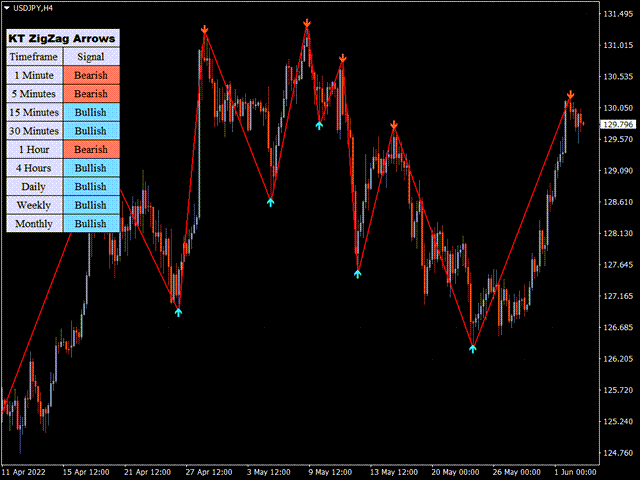
Индикатор отображает стрелки вверх и вниз на каждом ценовом колебании, определяемом классическим индикатором ZigZag. Когда ZigZag формирует новый минимум, отображается зелёная стрелка. Аналогично, красная стрелка отображается при формировании нового максимума.
Особенности
- По сравнению с классическим ZigZag, он более точно определяет точки разворота.
- Помогает заранее распознавать формирующиеся графические фигуры.
- Оснащён сканером мульти-таймфрейма, показывающим направление ZigZag на каждом таймфрейме.
- Включены все оповещения MetaTrader.
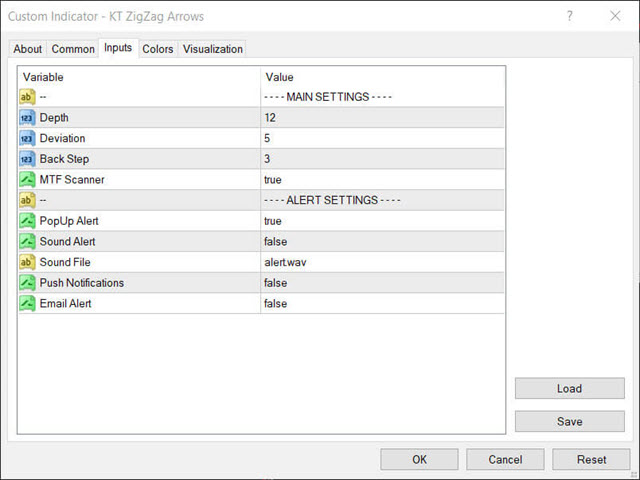
Параметры
- Глубина: целое число, определяющее количество баров в точках разворота ZigZag.
- Отклонение: процент отклонения до смены направления.
- Шаг назад: минимальное количество баров между максимумами/минимумами ZigZag.
- Сканер MTF: показывает направление ZigZag на нескольких таймфреймах.
- Настройки оповещений
Недостатки
ZigZag является перерисовывающимся и запаздывающим индикатором, поэтому логично, что стрелки, основанные на нём, тоже будут перерисовываться и отставать. Он может казаться идеальным на исторических данных, так как постоянно подстраивается под новые максимумы и минимумы.
So ganz okay wäre besser wenn man nicht nur Pfeil hoch und runter Alarme bekommt sondern auch MTF Alarme was die genaue Trendrichtung zeigt das ermöglicht gute Ein und Ausstiege. Würde mich freuen wenn es zu ermöglichen ist.