News Range Forecast
- Индикаторы
- Версия: 1.0
- Активации: 5

News Range Forecast shows, for each upcoming high-impact US release, how far price usually travels after it on the symbol of your chart: within the first 5, 15 and 60 minutes, measured from the last price before the number. Size only: it gives no direction and no signals, and it does not trade.
What it shows
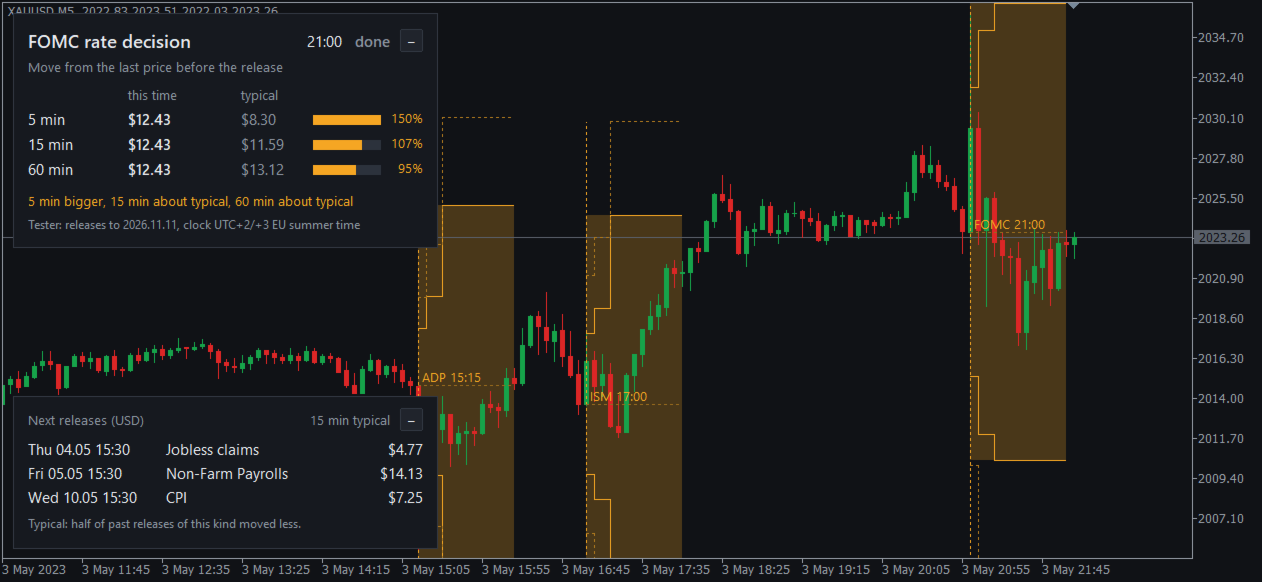
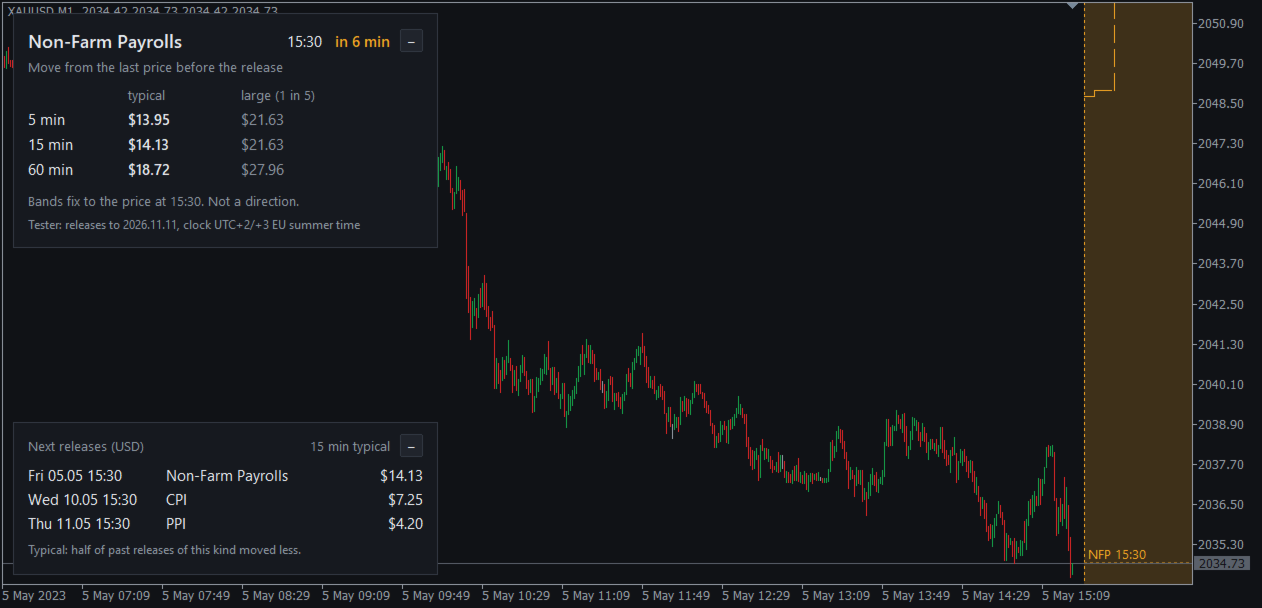
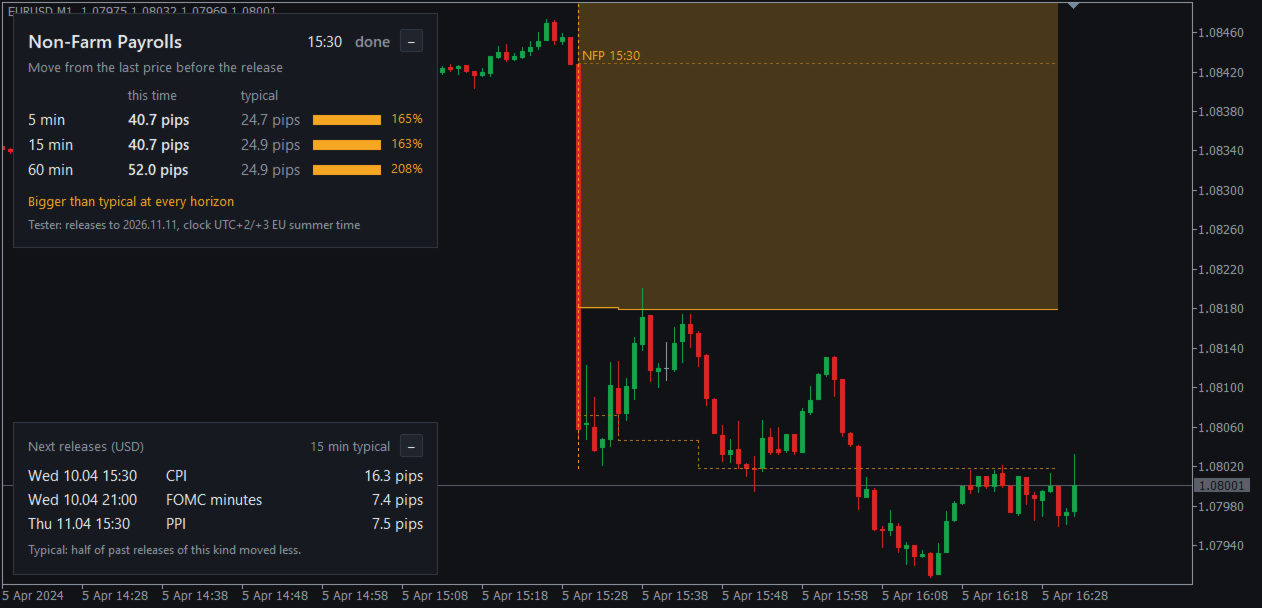
- Before the release: the panel names the next release, its time and a countdown, and gives two sizes for each horizon: the typical move (half of past releases of this kind moved less) and the large move (four releases in five moved less). From 12 hours before the release the bands are drawn on the chart as steps from the release minute, dashed and following the current price.
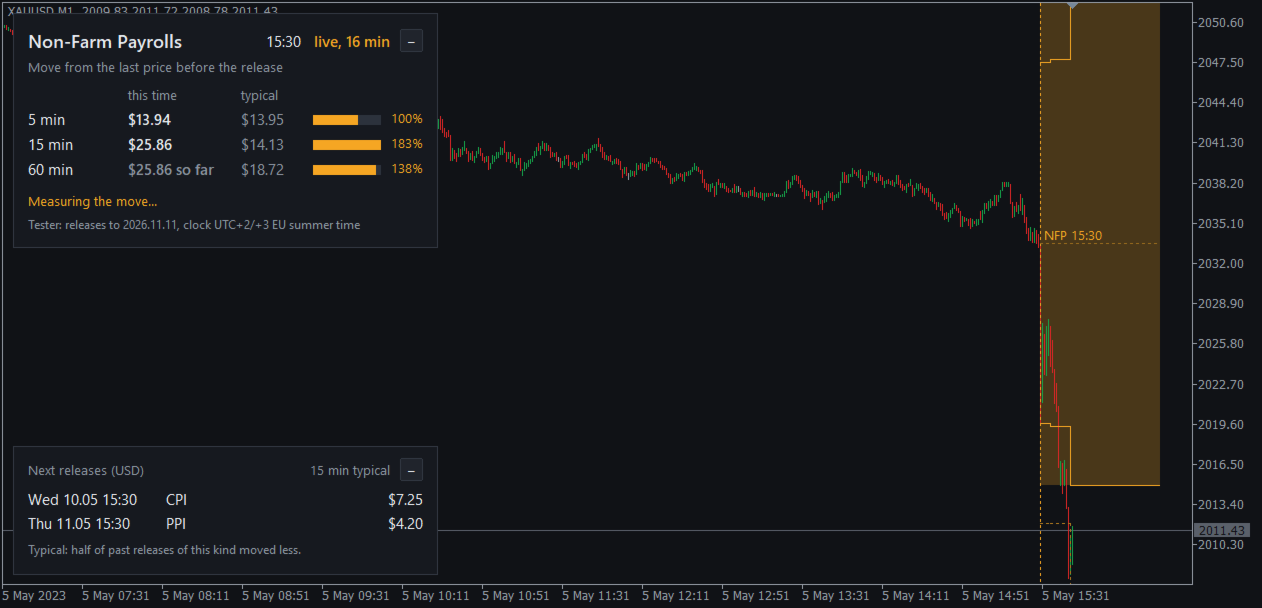
- At the release minute the bands are fixed to the last price before the number and do not move again.
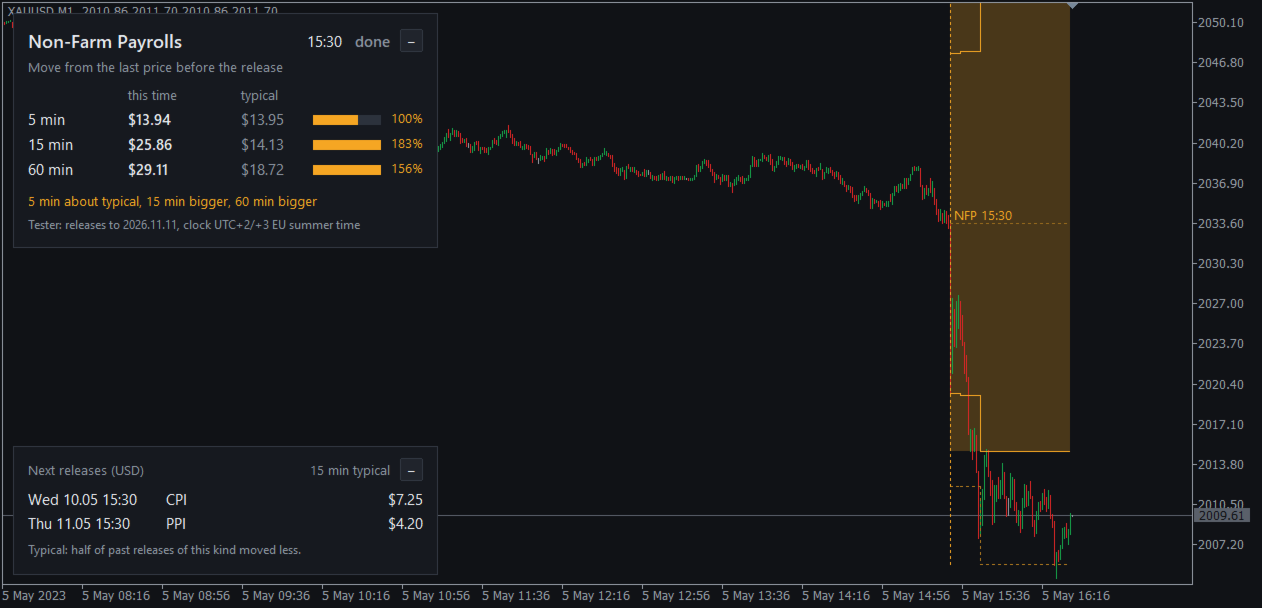
- After the release: the panel shows this release's move against the typical one for 5, 15 and 60 minutes, with a bar, a percentage and one plain sentence, for example "15 min bigger, 60 min about typical". Past releases stay drawn on the chart, so you can scroll back and compare.
- A second panel lists the next releases with their typical 15-minute move.
- Each panel has a minimise button, and offset inputs place it beside another panel on the same chart.
How to use it
- Before a release: compare the typical and the large move with your stop and your position size. A stop closer than the typical move sits inside what a release of this kind has usually covered, in one direction or the other.
- Pending orders and entries: the steps show how far price usually gets in 5, 15 and 60 minutes. An order placed closer than that is inside the usual noise of the release.
- After the number: the percentage says whether this move was usual or unusual for this kind of release, before you decide what to do next.
Which releases
FOMC rate decisions, Non-Farm Payrolls, CPI, core PCE, the advance GDP estimate, retail sales, PPI, ISM manufacturing and services, ADP employment, FOMC minutes and jobless claims. JOLTS job openings, consumer confidence and Michigan sentiment can be switched on. Releases that come out in the same minute share one set of bands, sized by the bigger one. Other high-impact events of the symbol's currencies are listed in the panel without sizes.
Which symbols
Gold (XAUUSD and its broker names), EURUSD, GBPUSD and USDJPY have their own sizes. AUDUSD, NZDUSD, USDCAD and USDCHF use sizes estimated from the three USD majors, and the panel says so. On other symbols the releases are listed without bands.
How the sizes are made
For each kind of release and each of these markets the indicator carries the usual size of the move after it, measured on minute history from 2013 to 2024. On your chart that size is scaled to how this symbol has been moving at that time of day in recent weeks, on your broker's own prices. So the bands are in your chart's units (dollars on gold, pips on forex) and follow the market's current pace.
What it needs
- The economic calendar built into MetaTrader 5. No web requests, no DLL, no external files.
- About 30 days of M1 history of the symbol. The terminal loads it on first use, and the panel says when it is still waiting.
- Bands are drawn on M1 to H1 charts (above M15 only the 60-minute band). The panels work on any timeframe.
Strategy Tester
The MetaTrader 5 calendar does not work in the Strategy Tester, so the indicator carries a built-in list of US release times for testing, and the panel shows the date it ends. The server's clock is read from the chart's history; set "Server clock" by hand if past releases stand an hour off. On charts above M1 test with "1 minute OHLC" or "Every tick".
For expert advisors
Six buffers: typical upper and lower, large upper and lower (during the hour after a release), the next release time and its typical 15-minute move.
Inputs
Which releases are shown, the large band, past releases on the chart, the panels (corner, scale, offsets, room for other panels), alerts (off by default: before a release, when the move passes the typical band; pop-up, push, sound), units, band colour and opacity, and the server clock.
Notes
The sizes describe the past. They are not a promise about the next release. A release can move far more than the large band, for example when the number is a big surprise or the market is thin. Spreads usually widen around releases: the bands measure price, not your fill.