Daily Range Forecast
- Индикаторы
- Версия: 1.0

Daily Range Forecast shows how big today is likely to be, how much of it has already moved, and the two prices past which the day is bigger than usual. On gold it uses a built-in model tested on gold history; on any other chart it fits itself to that symbol's own history.
What it shows
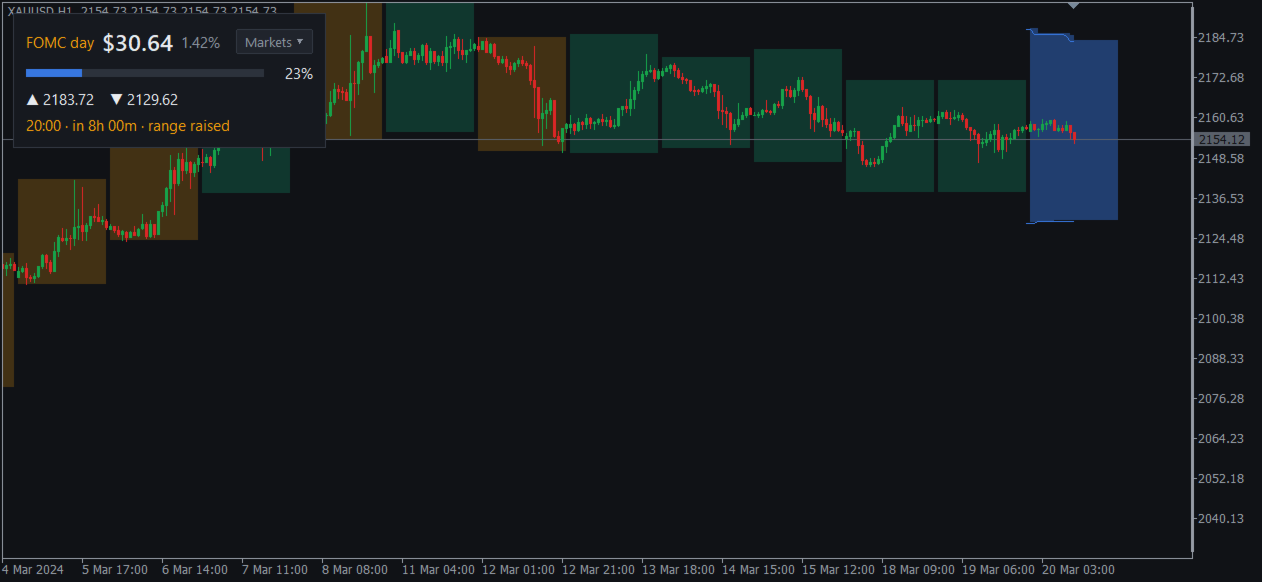
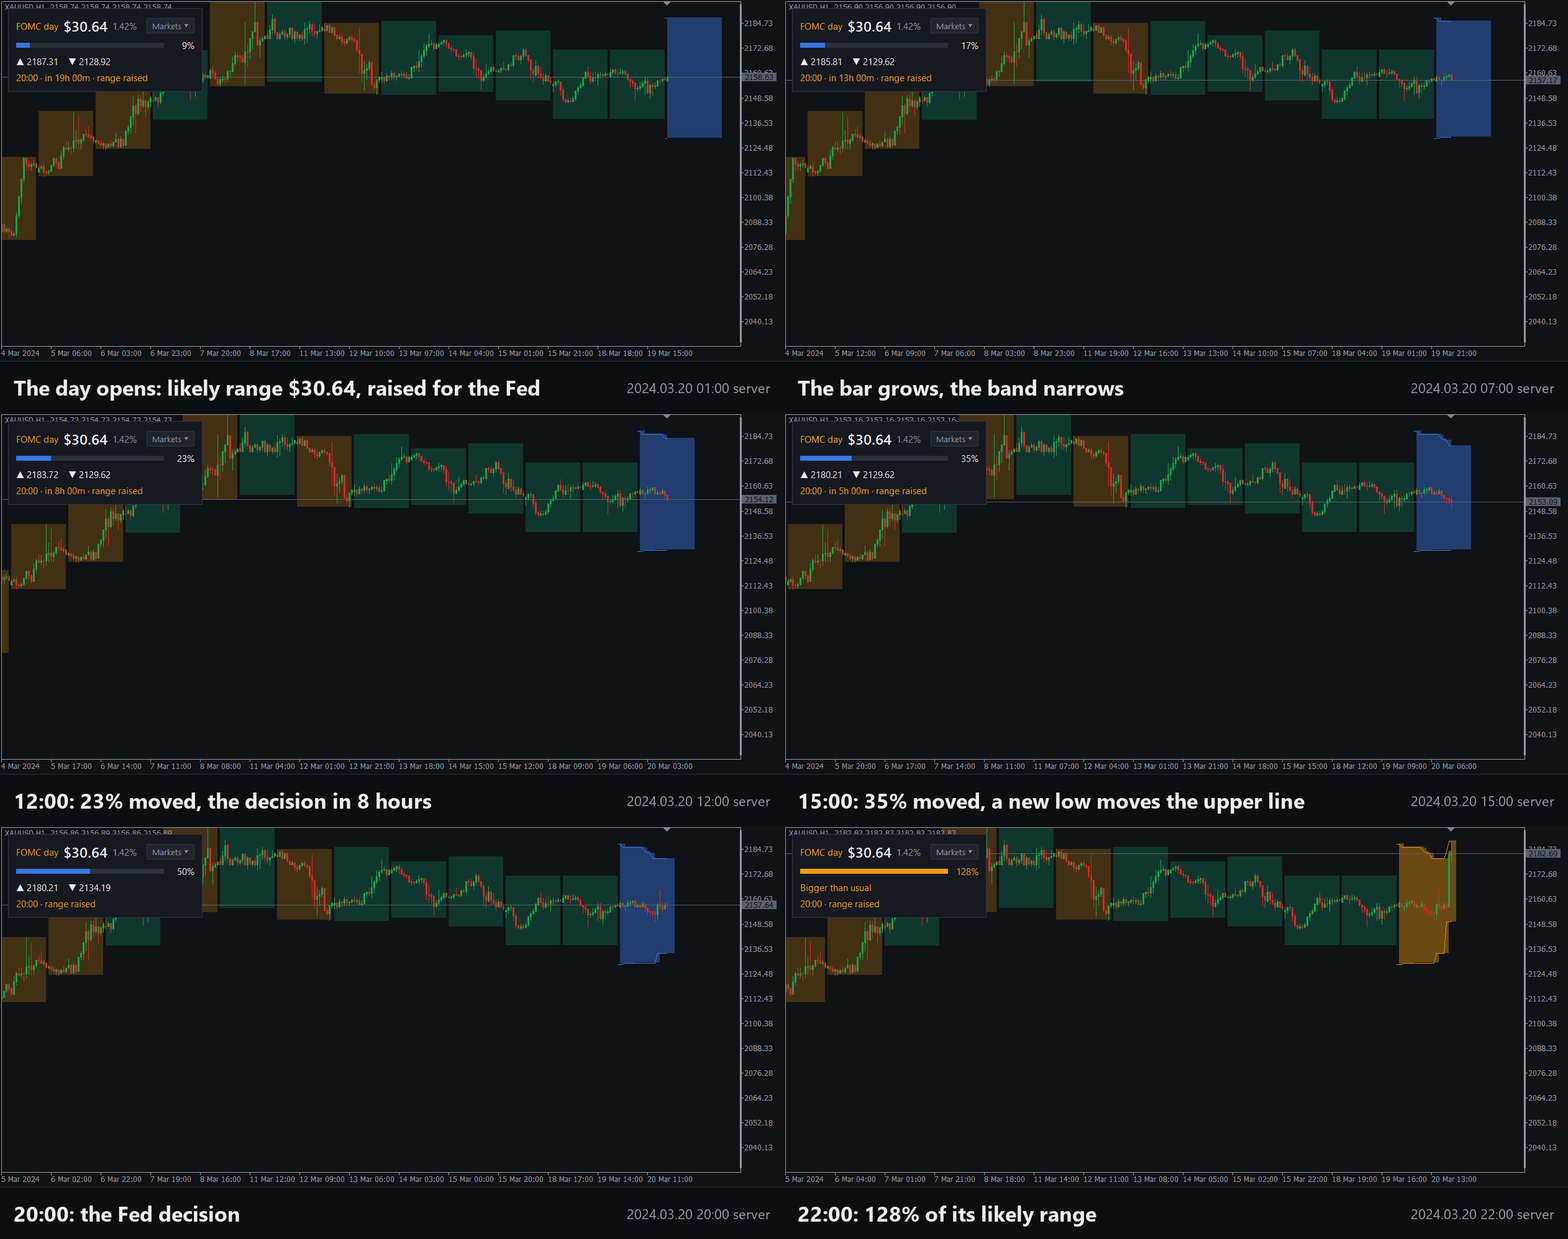
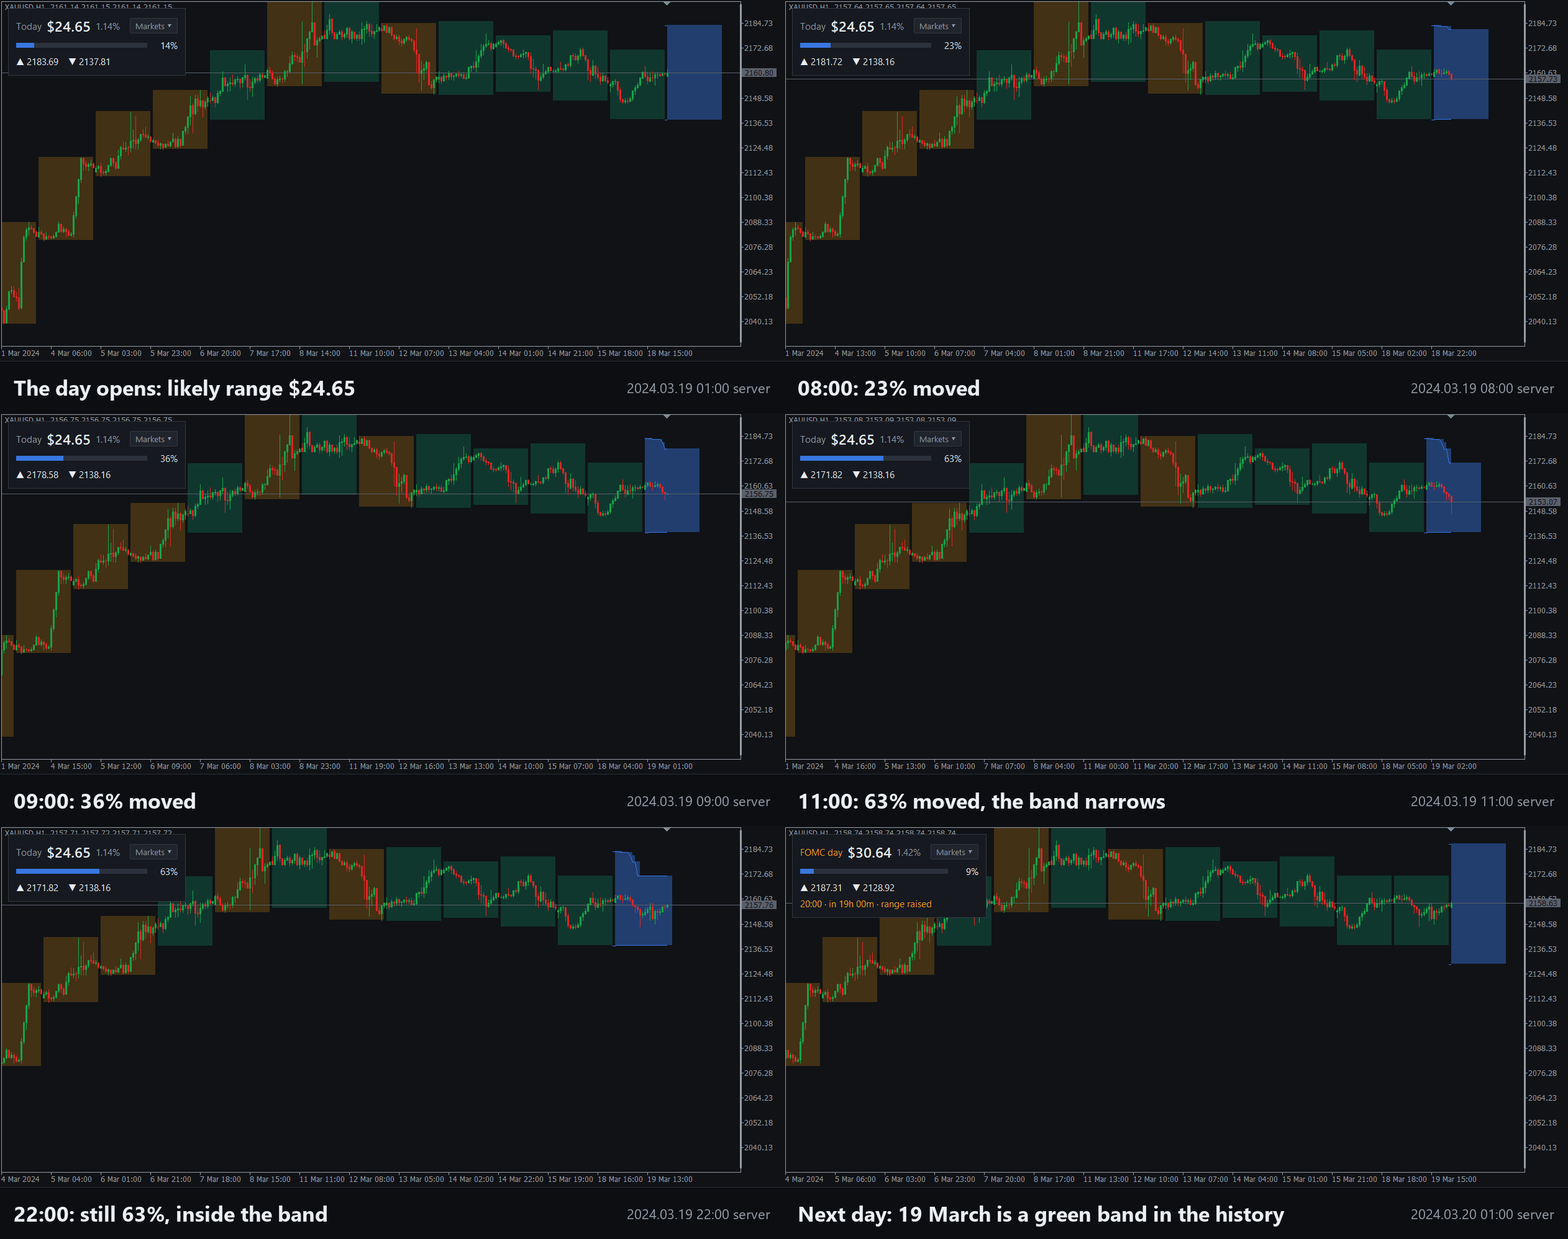
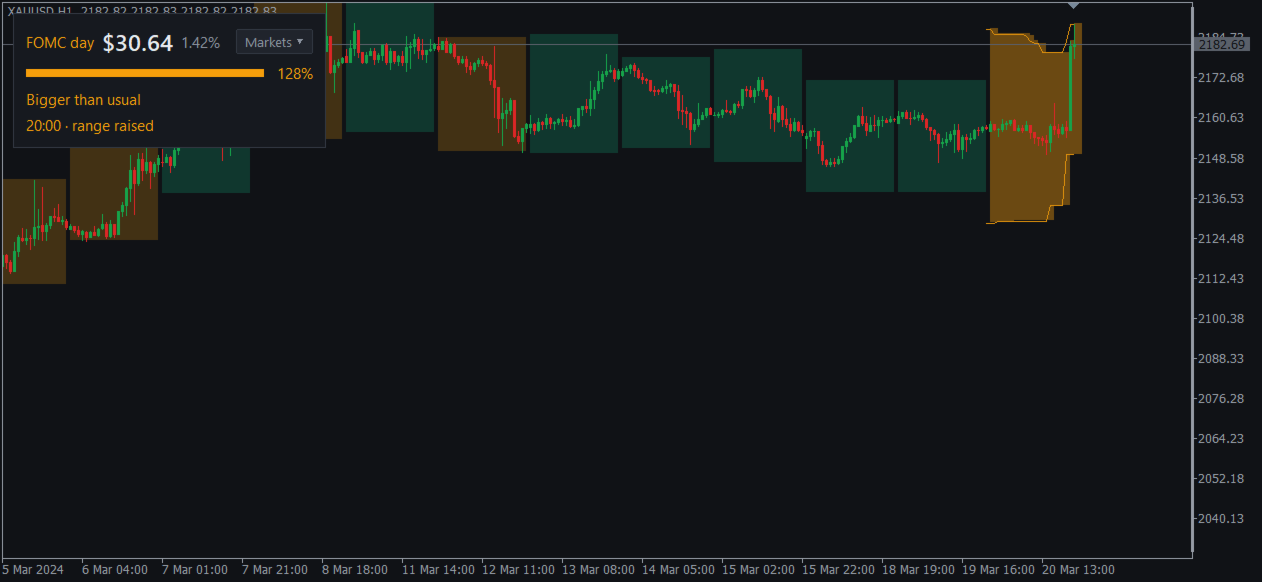
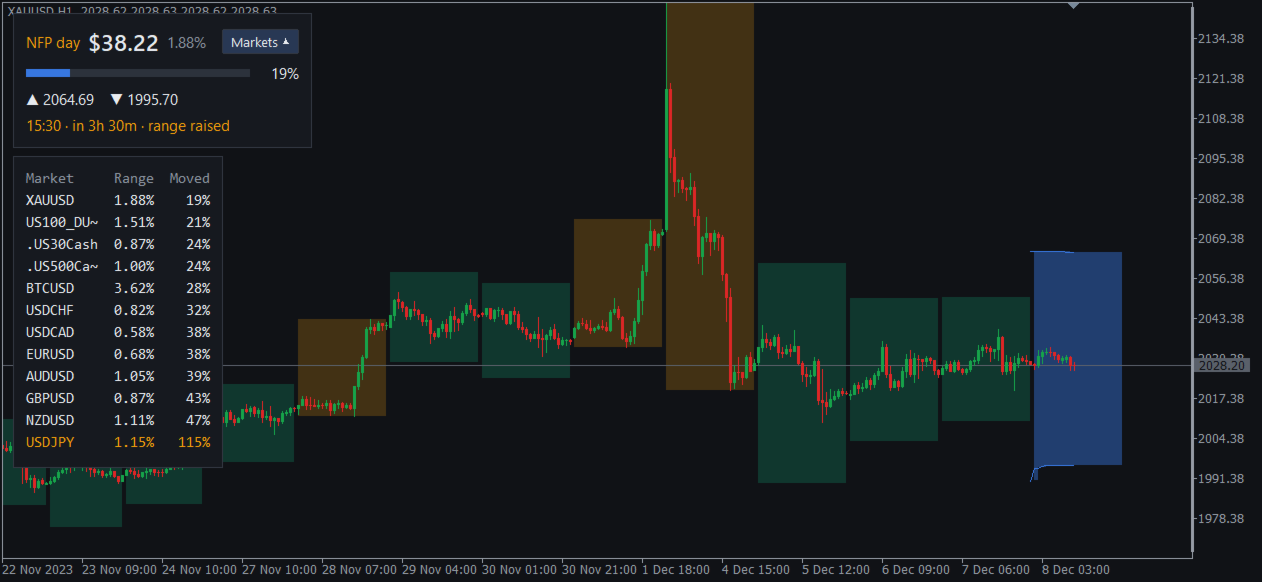
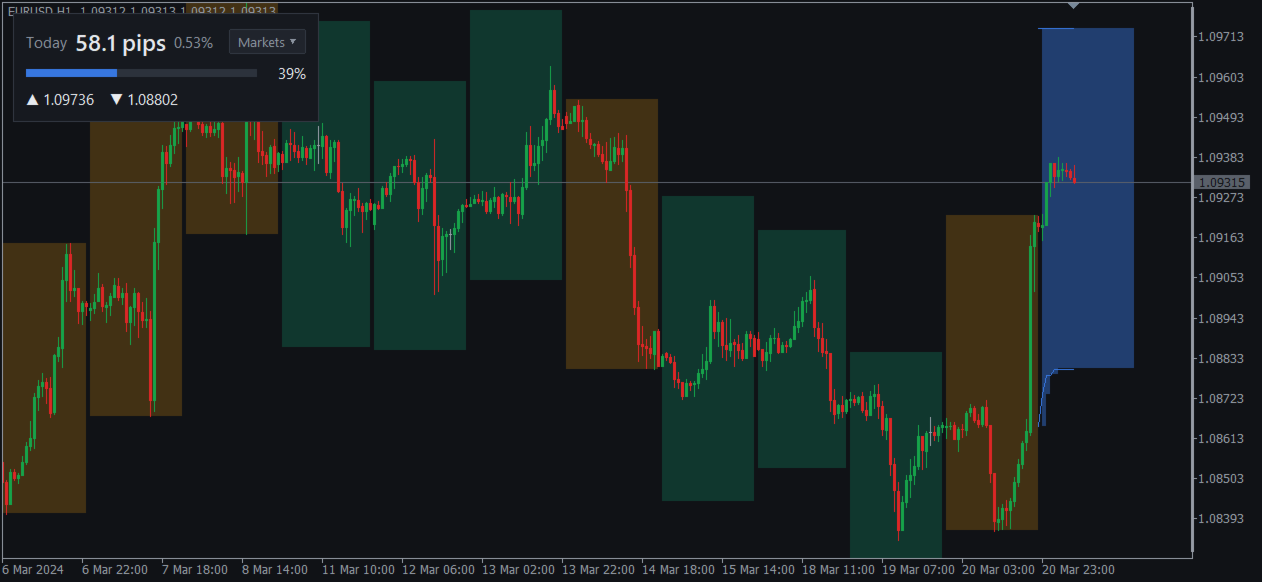
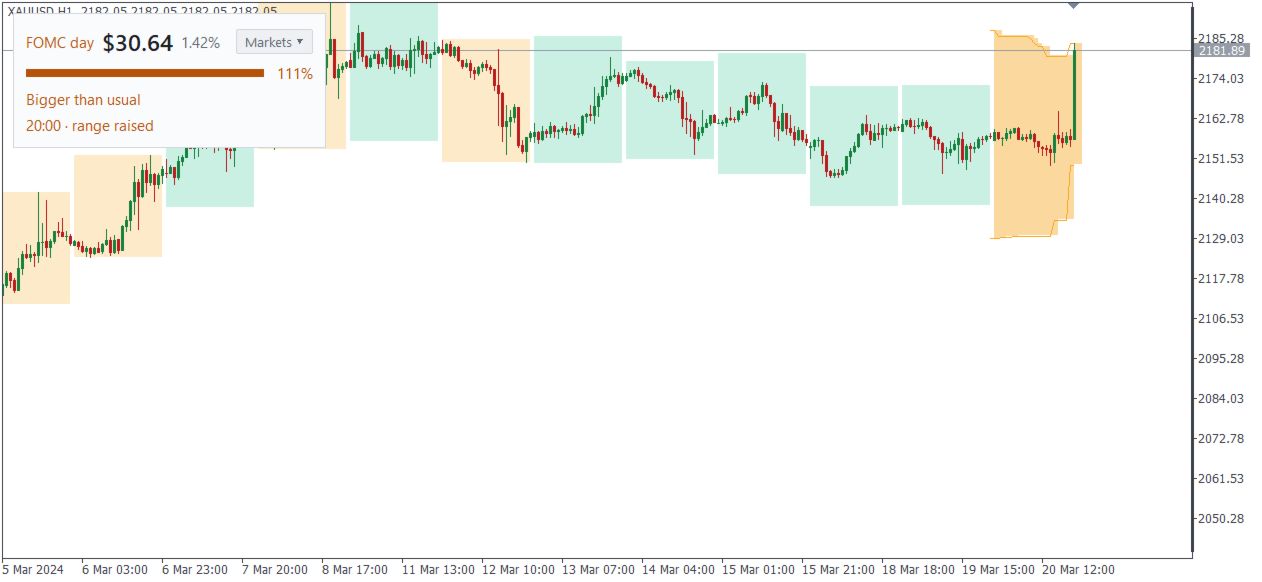
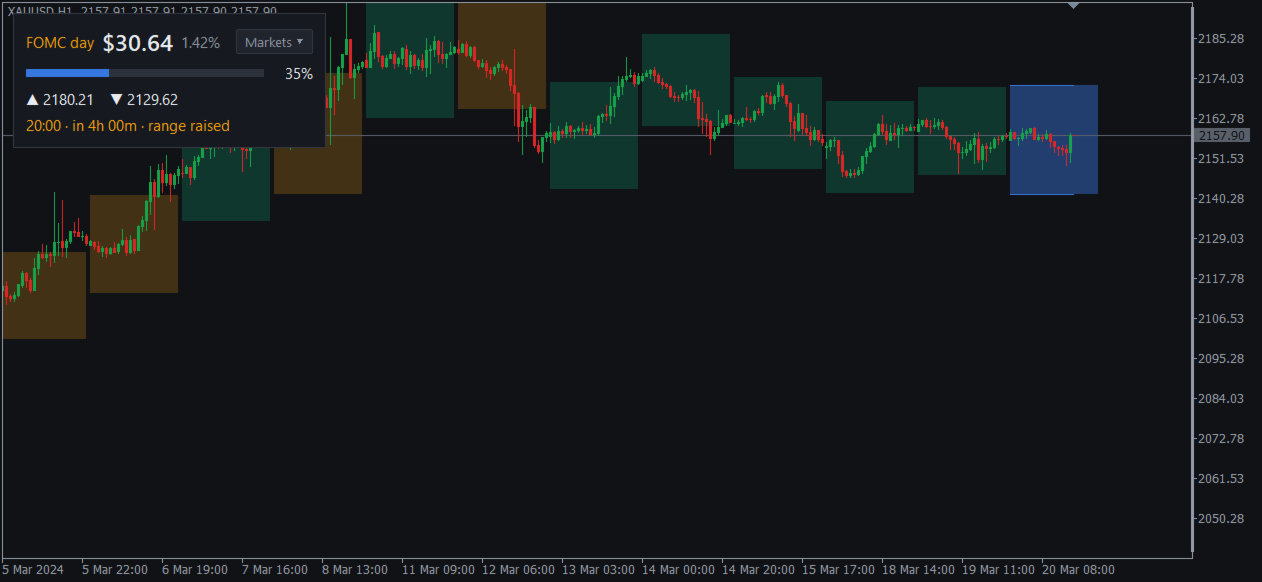
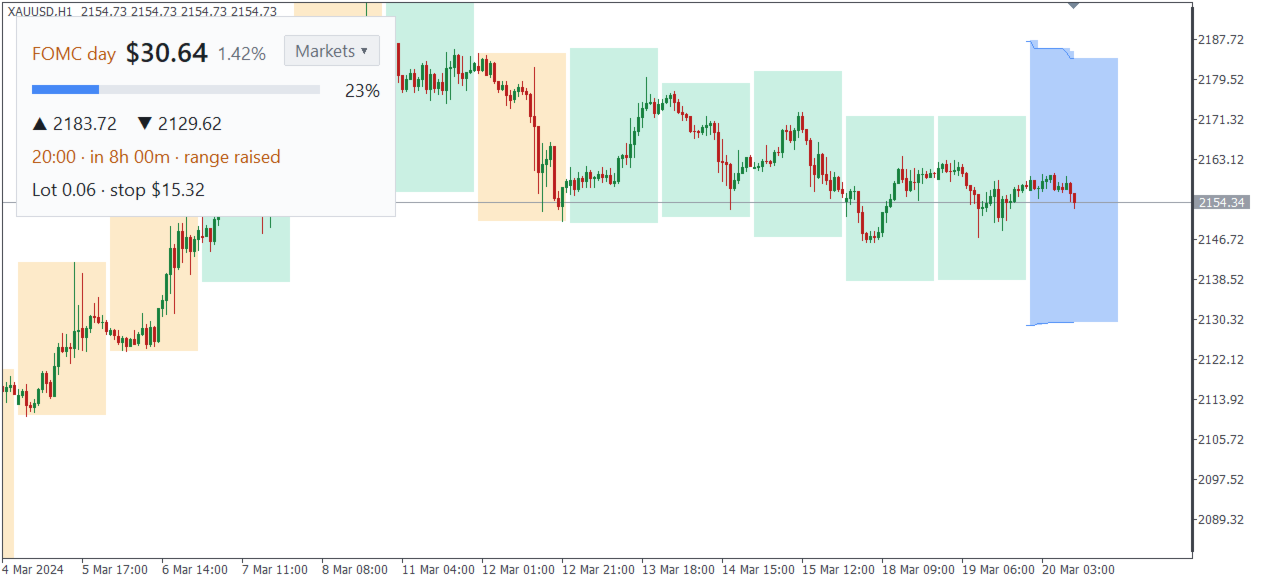
- Today's band on the chart: from today's high minus the likely range to today's low plus it. It narrows only with a new high or low; past either edge the day is bigger than usual. The likely range is set at the day's first bar and does not change during the day.
- History: up to 120 past days as soft bands behind the candles, green when the day stayed within its range, amber when it was bigger. No arrows and no labels.
- A small panel: today's likely range in dollars (pips on currency pairs) and percent, a bar of how much has moved, and the two prices.
- US release days on gold (CPI, payrolls, Fed decisions): the panel names the day, counts down to the release, and the range is raised.
- Markets: a small button opens a table of today's likely range and the share moved for 7 FX majors, US30, US500, US100 and BTCUSD under your broker's names, plus your own symbols (marked not tested), freshest first.
- Alerts at 80% and 100% moved: pop-up, push, sound.
- An optional lot helper: the lot for your risk with a stop set as a share of today's range, rounded down to your broker's volume step.
- Optional, on by default: on M1 to H4 the chart's price scale is set to show the candles and bands on view; it stops as soon as you change the scale yourself and is released when you remove the indicator.
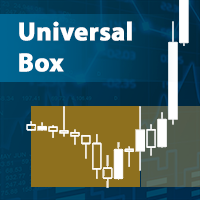
- A box around the open as another view; your colours, opacity and edge lines.
How to use it
- Before you trade: the likely range says how big today is likely to be. A plan that needs a much bigger move asks for an unusual day.
- During the day: the bar shows how much has moved; the band shows what is left.
- Target: one past the band needs a bigger day than usual. The edges are not support or resistance.
- Stop and lot: compare your stop with the range, or let the lot helper size it. Example, 14 June 2023: the range was $32.33; a stop of half of it is 16.17 USD per 0.01 lot, so a risk of 50 USD gives 0.03 lot.
How the forecast works
A statistical volatility model, made once at the day's open from finished days only. On gold the model is built in and was tested on gold history; on other symbols the same kind of model is fitted to that symbol's own recent history. It forecasts size, not direction, and gives no signals.
What was measured
On gold, January 2019 to April 2024, 1,375 days that were not used to build the model, without the release-day adjustment (except the release-day line):
- The day's range was at most the forecast on 65% of days; on average 0.95 of it.
- The day passed an edge of the band on 35% of days, mostly in the New York morning; the close then came back inside on 48% (not a turning point). At 12 hours, days with 80-100% moved passed an edge on 62%, days under 50% on 24%.
- US release days: on 92 release days from 2021 to April 2024, a factor counted only on earlier release days raised the share of days within the range from 34% to 57%.
- On other markets the model, fitted to each one's own history, was tested on a group of 7 major FX pairs (accuracy varies by pair) and on US30, US500, US100 (Dukascopy prices) and BTCUSD. Other symbols are not tested.
These are results on past data, not trading results.
Inputs
- Display: room levels or box around the open; history days (0-120) or today only.
- Look: colours for today, within and bigger, fill opacity, edge lines and their width, fit the price scale.
- Panel: on or off, corner, scale; release-day headline.
- Alerts: 80% and 100%; pop-up, push, sound.
- Lot helper: risk % and stop as % of today's range (off by default).
- Markets: more symbols.
- Model: Auto (built-in on gold, fitted elsewhere), Gold, or Fit to this symbol; day start New York 17:00 or server midnight; server clock.
For expert advisors
Twelve buffers (box levels, open, range in price and %, moved %, ADR(20), regime, model, day start, the two levels), filled in every view; read them on D1 or lower. Four more hold the drawn bands (H4 and below; past days at their final levels, so not for backtests).
Limits
- Fit to this symbol needs about a year of M5 history (250 days by default). With MetaTrader's default Max bars in chart (100,000) it uses at most 345 days; the panel says when it needs more.
- Release days: a built-in US list to December 2027, gold only, no other news; in backtests before May 2024 the adjustment is partly in-sample.
- If missing past bars load later, today's forecast can change (the panel says so).
- The markets table adds its markets to Market Watch and needs about 100,000 M5 bars each; index sessions differ by broker.
- It keeps a small day cache in MQL5\Files, and the Markets button state, the learned server clock and the price-scale limits it set in global variables.
- Strategy Tester: about a month of M5 history before the start; above M5 use "Every tick" or "1 minute OHLC".