Bollinger Market Structure and Trend Intelligence

BOLLINGER MARKET & TREND INTELLIGENCE — MT5 Edition

STOP GUESSING WHICH BREAKOUTS ARE REAL.

Most Bollinger breakouts fail. This engine tells you which ones won't — before you risk a single dollar.

You get a quality score, a volatility percentile, and a post-breakout efficiency reading. All locked on bar close. No repainting. No guessing.

The market gives you maybe three clean breakouts a week. This tool makes sure you catch them — and helps you avoid the twelve that would have stopped you out.

THE PROBLEM

You've been here before.

It's 2 AM. You're staring at a chart. Price just closed outside the upper Bollinger Band. Your heart rate jumps. You enter long.

Three candles later, price is back inside the band. Then it collapses. Your stop gets hit. You're left staring at a "confirmed" breakout that reversed the moment you clicked buy.

You tell yourself: "I should have waited for a retest."

But when you wait for retests, the market runs without you. You watch a 200-pip move from the sidelines because you were "being patient."

So you try adding filters. An RSI here. A MACD there. An ADX overlay. Now your chart looks like a Christmas tree. Twelve indicators. Six conflicting signals. And you still don't know if the breakout is real.

The problem isn't your discipline. It isn't your strategy.

The problem is that your tools don't measure what actually matters.

They don't tell you if volatility was compressed before the breakout. They don't score the breakout candle's body and close position. They don't measure post-breakout directional efficiency. They don't distinguish between a genuine channel violation and a liquidity sweep.

What if you could see all of that — in one panel — and make a decision in under three seconds?

THE REVELATION

Bollinger Market & Trend Intelligence is a complete analytical engine for MT5 that transforms raw Bollinger Bands into a multi-dimensional decision system.

Its core promise is simple: Know whether a breakout is worth trading — before you enter.

Here's the fundamental insight that separates this from every other Bollinger indicator on the marketplace:

Most tools evaluate the breakout bar using the current Bollinger Bands — which means the breakout bar itself moves the band it's supposedly breaking. That's circular logic. That's why so many signals repaint or fail.

This engine reads the completed Bollinger Bands from the bar strictly before the evaluated bar. The breakout tests a fixed, pre-existing threshold. It cannot move its own goalpost. The band is locked. The signal is honest.

Think of it as a lie detector for breakouts. Price can scream "I'm breaking out!" — but this engine checks the volatility context, the candle quality, the follow-through, and the efficiency of the move. If the story doesn't hold up, it tells you.

No repainting. No circular logic. No false confidence.

THE DASHBOARD — YOUR ENTIRE MARKET IN ONE GLANCE

When you attach this indicator to your MT5 chart, a clean, color-coded command center appears in the corner you choose. It's designed for dark-themed charts — high contrast, no eye strain, no clutter.

The dashboard is organized into five logical panels. Each panel answers a specific question you're already asking.

Top-left: MARKET STATE. What is volatility doing right now? You see the state — from EXTREME COMPRESSION to EXTREME EXPANSION — in a color-coded readout. Below it, the width percentile tells you exactly where current volatility sits relative to the last 100 bars. The Width/ATR ratio normalizes across symbols and timeframes. Velocity and acceleration show whether volatility is speeding up or slowing down. The "Interpretation" line translates it all into plain English: "Extreme compression releasing strongly" or "Expansion decelerating."

Top-middle: GENERAL TREND. What is the broader structure doing? You get direction, strength score (0-100), state (STRONG UPTREND to STRONG DOWNTREND), confidence level, market structure (HH + HL, LH + LL, etc.), momentum with ADX reading, persistence percentage, and phase (ESTABLISHED UPTREND, TREND DEVELOPING, TREND WEAKENING, etc.). The "Environment" line tells you if the trend is happening under compression or expansion.

Top-right: CURRENT TREND. What is the recent pressure doing? Same comprehensive readout — but over a shorter lookback. This is where you see if the current pressure aligns with or contradicts the broader trend. The "Pressure" insight tells you if momentum is building, fading, or absent.

Bottom-left: BREAKOUT INTELLIGENCE. This is the heart of the system. You see the direction of the most recent breakout, how many bars ago it occurred, its status (BREAKOUT, VALID, RETESTED, FALSE BREAKOUT, SWEPT, BULLISH CONTINUATION, etc.), its quality score (MARGINAL to EXCELLENT), the breakout candle type (STRONG BULLISH, BEARISH, etc.), body percentage, close position percentage, distance from the channel in ATR multiples, and your current price position within the channel. The "Signal" insight condenses it all into one actionable line.

Bottom-right: POST-BREAKOUT. What happened after the breakout? This panel measures the actual follow-through. You see the post-breakout state (BULLISH, BEARISH, RANGING), momentum, progression (HIGHER, LOWER CHANNEL, SIDEWAYS), bars analyzed, bullish movement in points, bearish movement in points, net change, efficiency percentage, and the bull/bear/range bar distribution.

Bottom: FINAL ASSESSMENT. The system synthesizes everything into a final deduction paragraph. It tells you the relationship between general and current trend, the market environment, and what to watch for next. A large, color-coded FINAL BIAS badge gives you the bottom line: BULLISH, BEARISH, EMERGING BULLISH, BULLISH STRUCTURE / CORRECTION, etc. — with a LONG/SHORT/NEUTRAL tag and the current volatility state.

Every panel uses a carefully chosen ultraviolet palette — indigo, plum, bronze — that stands out on dark charts without being garish. Bullish readings glow lime green. Bearish readings burn tomato red. Warning states flash gold. You understand the entire market in under three seconds.

THE ENGINE ROOM — WHAT'S ACTUALLY UNDER THE HOOD

This isn't a simple Bollinger Bands plot with some arrows. It's a seven-phase analytical engine. Here's what each phase does — and why it matters to your bottom line.

PHASE 1: THE FIXED THRESHOLD

What it does: Reads the completed Bollinger Bands from the bar before the evaluated bar. The breakout bar tests a fixed, pre-existing band.

Why it matters to you: This is the single most important architectural decision in the entire indicator. It eliminates the circular logic that causes repainting and false signals in almost every other Bollinger breakout tool.

Without it: You'd be trading breakouts that only exist because the breakout bar itself moved the band. That's not a signal. That's a mirage.

PHASE 2: THE VOLATILITY ENGINE

What it does: Calculates Bollinger Band width, normalizes it against ATR, then computes a percentile rank over your chosen lookback (default: 100 bars). It also calculates width velocity (how fast width is changing) and acceleration (how fast velocity is changing). A hysteresis mechanism prevents state-flipping when readings hover near thresholds.

Why it matters to you: Volatility context is everything. A breakout from EXTREME COMPRESSION is a different animal than a breakout from EXTREME EXPANSION. This engine tells you which one you're looking at — and whether the compression is deepening, holding, or releasing.

Without it: You'd treat every breakout the same. You'd enter breakouts from exhausted expansion moves and wonder why they fail.

PHASE 3: THE PERSISTENT BREAKOUT ENGINE

What it does: Scans up to 3,000 bars (configurable) to find the most recent qualifying breakout. Stores it persistently with absolute bar indexing. Tracks whether it's been confirmed (price held outside the channel for N bars), retired (price returned inside for N bars), or aged out.

Why it matters to you: You always see the most recent breakout — even if it happened 200 bars ago. The engine remembers. You don't have to scroll back or wonder.

Without it: You'd miss the context of the last breakout. You'd see a new signal without knowing how the previous one resolved.

PHASE 4: BREAKOUT INTELLIGENCE

What it does: Scores the breakout candle itself. Measures body percentage (how much of the candle's range is body vs. wick) and close position (where the close sits within the range). Classifies the candle as STRONG BULLISH, STRONG BEARISH, BULLISH, BEARISH, or NEUTRAL. Also calculates the breakout distance from the channel in ATR multiples.

Why it matters to you: A breakout with a 70% body and a close at the extreme high is a different signal than a breakout with a 20% body and a long upper wick. This engine distinguishes them. The quality score (MARGINAL to EXCELLENT) synthesizes candle quality, distance, and confirmation into one readable metric.

Without it: You'd treat a weak, wicky breakout the same as a strong, decisive one. You'd get chopped up.

PHASE 5: TREND & STRUCTURE SCORING

What it does: Runs two independent trend assessments — General Trend (default: 50-bar lookback) and Current Trend (default: 20-bar lookback). Each assessment combines EMA alignment (fast vs. slow), EMA slope normalized by ATR, ADX with directional indicators, market structure (higher highs/lows vs. lower highs/lows), and persistence (percentage of bars closing above/below the fast EMA). The result is a 0-100 score, a direction, a state (STRONG UPTREND to STRONG DOWNTREND), a confidence level, a momentum reading, a phase, and a structure classification.

Why it matters to you: You see both the forest and the trees. The General Trend tells you the broader context. The Current Trend tells you what's happening right now. When they align, you have conviction. When they diverge, you have a correction or a developing reversal.

Without it: You'd trade breakouts without knowing if they're with or against the broader trend. You'd fight the market.

PHASE 6: BREAKOUT VALIDATION

What it does: After a breakout is stored, the engine tracks every subsequent bar. It detects:

  • Confirmation: Price held outside the channel for N bars (default: 1).

  • Retest: Price returned to within 0.25 ATR of the channel and held.

  • False breakout: Price closed back inside the channel.

  • Sweep: A wick exceeded the channel by 35%+ of the candle's range, then reversed.

Why it matters to you: Most breakouts fail. This engine tells you how they fail — and whether the failure is a clean rejection (false breakout) or a liquidity grab (sweep). That distinction changes how you manage your trade.

Without it: You'd see a breakout, enter, and get stopped out without understanding why. You'd never learn to distinguish between a genuine failure and a stop hunt.

PHASE 7: DASHBOARD & ALERTS

What it does: Renders the entire analytical output as a clean, color-coded dashboard. Optional alerts notify you when a new breakout is detected, with the direction, status, post-breakout state, and net change.

Why it matters to you: You don't have to interpret raw numbers. The dashboard tells you what matters. The alerts keep you informed without staring at the screen.

Without it: You'd have to manually check every symbol and timeframe. You'd miss breakouts while looking elsewhere.

THE PROOF STACK

No repainting. Every signal is locked on bar close. The breakout bar cannot move its own threshold. What you see in history is what you would have seen in real time.

Works on any timeframe, any symbol, any account type. Forex, indices, crypto, commodities. M1 to MN. The ATR normalization ensures the readings are comparable across instruments.

Zero external dependencies. No DLLs. No web requests. No third-party libraries. Everything runs inside MT5.

Built-in hysteresis. The volatility state machine uses a 3% hysteresis band to prevent state-flipping when readings hover near thresholds. You won't see "COMPRESSION" and "BALANCED" alternating every bar.

ATR normalization throughout. Width/ATR ratio, breakout distance in ATR, retest distance in ATR, EMA slope in ATR — every metric that could be distorted by symbol volatility is normalized.

Persistent breakout tracking. The engine scans up to 3,000 bars to find the most recent breakout. It stores it with absolute bar indexing and tracks its lifecycle. You always have context.

Configurable everything. Over 40 parameters organized into logical groups. Defaults are optimized out of the box. Tweak only if you want to match your specific style.

Optional alerts. Popup notifications and sound alerts when a new breakout is detected. Primed on attachment so historical events don't trigger false notifications.

Breakout chart label. A text label appears on the chart at the breakout bar, showing direction and status. Optional — you can turn it off.

MT5 native. Built specifically for MetaTrader 5 — not a ported MT4 version. Uses the full MT5 indicator architecture.

USE CASES — WHEN THIS ENGINE EARNS ITS KEEP

The Compression Coil. The market has been ranging for three days. The MARKET STATE panel flashes "EXTREME COMPRESSION" with positive acceleration. The GENERAL TREND panel shows a bullish structure. The CURRENT TREND panel shows neutral pressure. You know a violent move is loading. The BREAKOUT INTELLIGENCE panel tells you the moment it fires — and whether the breakout candle is strong or weak. You enter with confidence because you saw the coil before the spring.

The Failed Breakout Avoidance. Price closes above the upper band. Your old self would have entered immediately. But the BREAKOUT INTELLIGENCE panel shows "WEAK" quality — the candle has a 25% body and a long upper wick. The POST-BREAKOUT panel shows "RANGING" with 40% efficiency. You stay flat. Two bars later, the status flips to "FALSE BREAKOUT." You saved yourself a stop-out.

The Retest Entry. Price breaks out bullishly. The status reads "BREAKOUT" — not yet confirmed. You wait. Two bars later, price pulls back to within 0.25 ATR of the channel. The status flips to "RETESTED." The POST-BREAKOUT panel shows "BULLISH" with 80% efficiency. You enter on the retest with a tight stop just below the channel. This is the highest-probability entry — and the engine told you exactly when it happened.

The Sweep Reversal. Price spikes below the lower band, then closes back inside. The status reads "SWEPT." The BREAKOUT INTELLIGENCE panel shows a bearish direction, but the POST-BREAKOUT panel shows "BULLISH" progression. You recognize this as a liquidity grab — a stop hunt. You enter long against the sweep, targeting the upper channel. The engine gave you the confidence to take the other side of the trap.

The Trend Alignment Entry. The GENERAL TREND panel shows "BULLISH | STRONG UPTREND." The CURRENT TREND panel shows "BULLISH | ESTABLISHED UPTREND." The MARKET STATE panel shows "BALANCED" volatility. The FINAL BIAS badge reads "BULLISH" with a "LONG" tag. Price breaks out bullishly. The breakout quality reads "EXCELLENT." This is the highest-conviction setup the engine can produce. You size up.

The Divergence Warning. The GENERAL TREND panel shows "BULLISH." The CURRENT TREND panel shows "BEARISH." The FINAL ASSESSMENT paragraph reads: "The broader structure is bullish, but the current trend has turned bearish. This indicates an active correction or developing reversal." You're holding a long position. You tighten your stop. The engine warned you before the reversal became obvious.

THE WORKFLOW — FROM CHART OPEN TO TRADE DECISION

Step 1: Attach the indicator. Drag it onto your MT5 chart. The dashboard appears in your chosen corner. The engine begins analyzing on the next bar open.

Step 2: Read the FINAL BIAS badge. This is your bottom line. BULLISH, BEARISH, or something more nuanced. It takes one second.

Step 3: Check the MARKET STATE panel. Is volatility compressed, balanced, or expanded? Is it accelerating or decelerating? This tells you what kind of move to expect.

Step 4: Check the BREAKOUT INTELLIGENCE panel. Is there an active breakout? What's its status? Its quality? Its distance from the channel? If there's no breakout, you wait.

Step 5: Check the POST-BREAKOUT panel. If there's an active breakout, what's the follow-through? Is it bullish, bearish, or ranging? What's the efficiency? This tells you if the breakout has legs.

Step 6: Make your decision. If the bias aligns with the breakout direction, the quality is strong, and the post-breakout response is efficient — you have a trade. If not, you wait. The engine gives you the confidence to act — or the discipline to stay flat.

Total time: under 30 seconds. No math. No cross-referencing. No guesswork.

PARAMETER OVERVIEW — SIMPLE, LOGICAL, FORGIVING

All parameters are organized into seven groups. Defaults are optimized out of the box. You can trade this indicator for months without changing a single setting. But if you want to tune it to your style, here's what each group controls.

Phase 1 — Bollinger. The core band settings. Period (default: 20), standard deviations (default: 2.0). Adjust these if you want faster or slower bands.

Phase 2 — Volatility. The width lookback (default: 100), ATR period (default: 14), velocity and acceleration bars (default: 3 each), width smoothing (default: 3), and the percentile thresholds for compression and expansion states. The hysteresis setting (default: 3%) prevents state-flipping.

Phase 3 — Breakout. Minimum breakout distance in ATR (default: 0.05), strong breakout threshold (default: 0.50), confirmation bars (default: 1), retirement rules, and scan lookback (default: 3,000 bars). Keep Last Breakout Visible (default: true) ensures the most recent event stays in the panels even after it ages out.

Phase 4 — Intelligence. Strong body percentage (default: 60%), strong close percentage (default: 75%), ranging move threshold (default: 0.10 ATR), directional majority (default: 60%), and directional efficiency (default: 50%). These control how the engine scores breakout candles and post-breakout movement.

Phase 5 — Trend. General trend lookback (default: 50), current trend lookback (default: 20), slope lookback (default: 10), neutral slope threshold (default: 0.02 ATR), ADX period (default: 14), fast EMA (default: 20), slow EMA (default: 50), and ADX thresholds for trend and strong trend (default: 20 and 30).

Phase 6 — Validation. Retest ATR distance (default: 0.25) and sweep wick percentage (default: 35%). These control how the engine detects retests and liquidity sweeps.

Phase 7 — Dashboard. Show/hide dashboard, corner placement, panel width, font size, offsets, insight wrap characters, breakout label visibility, and alert enable/disable.

Default settings are optimized out of the box. Tweak only if you want to match your specific style.

THE UPGRADE PATH — FOR TRADERS WHO WANT TO GO FURTHER

Bollinger Market & Trend Intelligence is a complete standalone system. But for you — if you want to go further — it pairs naturally with complementary tools.

If you trade breakouts across multiple symbols, consider adding a multi-symbol scanner to your workflow. It alerts you when any symbol on your watchlist enters EXTREME COMPRESSION — so you can focus on the charts that matter.

If you want to automate your breakout entries, consider a trade management EA that can read the indicator's output and execute with predefined risk parameters. The engine's non-repainting signals make it suitable for automation.

These are not required. They are simply the next logical step for you if you want to build a complete ecosystem around this analytical core.

THE CLOSE — WHAT YOU DO NEXT

You've seen what this engine does.

It reads the completed Bollinger Bands from the bar before the breakout — so the breakout bar can't move its own threshold. It scores volatility context, candle quality, post-breakout efficiency, and trend alignment. It tells you whether a breakout is worth trading — before you risk a single dollar.

And when you buy, you don't just get the indicator.

You get the complete user guide — free.

Every panel explained. Every reading decoded. Every parameter documented. Plus worked examples showing you exactly how to read the dashboard in live market conditions.

You'll know what "EXTREME COMPRESSION releasing strongly" means for your next trade. You'll know why a "SWEPT" signal is different from a "FALSE BREAKOUT." You'll know when to trust an "EXCELLENT" quality score — and when to stay flat.

No guesswork. No learning curve. You attach it, you read the guide, you understand it.

The market won't wait for you to feel ready. Breakouts happen whether you're prepared or not. The only question is whether you'll have the context to act on them.

Click "Buy" to add Bollinger Market & Trend Intelligence to your MT5 today — and get the full user guide instantly. Or download the free demo and test it on your own charts before committing. See the dashboard. Read the signals. Watch how it scores breakouts in real time.

Lifetime updates. Direct developer support. Zero risk to try.

Bollinger Breakout Intelligence | Volatility Compression Detector | Multi-Timeframe Trend Analysis | No Repaint Dashboard | Post-Breakout Efficiency Scoring | MT5 Indicator


おすすめのプロダクト
RBreaker Gold Indicatorsは、金先物の短期日内取引戦略であり、トレンドフォローと日内反転の2つの取引手法を組み合わせたものです。トレンド相場での利益を捉えるだけでなく、相場が反転した際には迅速に利確し、その流れに沿ってポジションを反転させることができます。 この戦略は、アメリカの雑誌『Futures Truth』において、15年連続で最も収益性の高い取引戦略トップ10に選ばれた実績を持ち、非常に長いライフサイクルを誇り、現在も国内外で広く使用・研究されています。 本インディケーターは、2026年の金先物の値動きに対応し、14日間のATR指標に基づいて、ブレイクアウト係数A、観察係数B、リバーサル係数Rをより合理的な値で定義しています。非常に優れたインディケーターであり、安定的な年間収益を実現しています。ぜひおすすめします〜
Limitless MT5 is a universal indicator suitable for every beginner and experienced trader. works on all currency pairs, cryptocurrencies, raw stocks Limitless MT5 - already configured and does not require additional configuration And now the main thing Why Limitless MT5? 1 complete lack of redrawing 2 two years of testing by the best specialists in trading 3 the accuracy of correct signals exceeds 80% 4 performed well in trading during news releases Trading rules 1 buy signal - the ap
Indicator Name: Fibaction – price action candle Detector Description: Fibo Signal Boxes is a powerful Smart Money Concept (SMC)-inspired indicator that auto-detects price action candles. bullish hammers and shooting stars, then draws precise Fibonacci entry zones and multiple take-profit levels directly on the chart. as for the SL personally i use 40 pips rules  Key Features: Detects bullish hammer and shooting star reversal candles. Automatically draws Fibonacci entry and TP boxes. as
Unlock the Market's Hidden Blueprint with Advanced Pattern Recognizer Tired of staring at charts, struggling to spot high-probability trading opportunities? What if you had a professional analyst scanning the markets 24/7, drawing perfect trendlines, and calculating precise profit targets for you? Introducing Advanced Pattern Recognizer for MetaTrader 5 – Your Automated Technical Analysis Powerhouse. This isn't just another indicator. It's a sophisticated algorithmic engine designed to do the he
A scalping indicator based on mathematical patterns, which on average gives signals with relatively small SL, and also occasionally helps to catch big moves in the markets (more information in the video) This indicator has three main types of notifications: The first type warns of a possible/upcoming signal on the next bar The second type indicates the presence of a ready signal to enter the market/open a position The third type is for SL and TP levels - you will be notified every time price re
Your Trend Friend
Luigi Nunes Labigalini
5 (1)
The trend is your friend! Look at the color of the indicator and trade on that direction. It does not  repaint. After each candle is closed, that's the color of the trend. You can focus on shorter faster trends or major trends, just test what's most suitable for the symbol and timeframe you trade. Simply change the "Length" parameter and the indicator will automatically adapt. You can also change the color, thickness and style of the lines. Download and give it a try! There are big movements w
IVISTscalp5
Vadym Zhukovskyi
5 (6)
[iVISTscalp5]:時間を通じた市場行動研究ラボ TLV Framework | Liquidity Activation Points ⸻ 概要 iVISTscalp5 は、VISTmany プロジェクトの一環として開発された、多層型のタイミングおよび価格構造インジケーターです。 このシステムは、Liquidity Activation Points(タイミング)を通じて、 動きが発生する時間 方向性 値動きの範囲 を予測します。 iVISTscalp5 インジケーターは、デフォルト設定のまま、あらゆる金融商品に使用できます。 ⸻ 実践的価値 iVISTscalp5 は、一般的なテクニカル指標として開発されたものではありません。 開発の中心的な理念は次の通りです。 あらゆる人が「時間」を通じて市場行動を研究できるようにすること。 ⸻ Time Language VISTmany (TLV) — プロジェクトの主要概念 t(p) t(p) は、タイミングが活性化する価格レベルです。 ⸻ p(p) p(p) は
CosmiCLab SMC FIBO CosmiCLab SMC FIBO is a professional trading indicator designed for traders who use Smart Money Concepts (SMC), market structure analysis and Fibonacci retracement levels. The indicator automatically detects market swings and builds Fibonacci levels based on the latest impulse movement. It also identifies market structure changes such as BOS (Break of Structure) and CHOCH (Change of Character), helping traders understand the current market direction. CosmiCLab SMC FIBO also pr
PatternScope — Multi-Pattern Recognition for MT5 PatternScope is a multi-pattern recognition indicator for MetaTrader 5. It scans price action for classic chart patterns, confirms breakouts, and draws clear   Entry, Stop Loss and Take Profit   levels. A compact dashboard shows the latest pattern, bias and Risk:Reward. Patterns:   Double Top/Bottom, Triple Top/Bottom, Head and Shoulders (and inverted), Bullish & Bearish Flag, Pennant, Rising & Falling Wedge, Triangle, Rectangle, Cup and Handle —
Liquidity Order Blocks MT5 Liquidity Order Blocks MT5 is a professional visual indicator for MetaTrader 5 designed to help traders identify and monitor potential bullish and bearish liquidity areas directly on the chart. The indicator detects pivot-based order block zones and displays each zone with a structured visual breakdown of estimated bullish volume, bearish volume, relative strength and delta. Its purpose is to make liquidity areas easier to read, compare and monitor during market analys
PipFinite Trend PRO MT5
Karlo Wilson Vendiola
4.84 (560)
Breakthrough Solution For Trend Trading And Filtering With All Important Features Built Inside One Tool! Trend PRO's smart algorithm detects the trend, filters out market noise and gives entry signals with exit levels. The new features with enhanced rules for statistical calculation improved the overall performance of this indicator. Important Information Revealed Maximize the potential of Trend Pro, please visit www.mql5.com/en/blogs/post/713938 The Powerful Expert Advisor Version Automatin
Tma Poc Gold
Ignacio Agustin Mene Franco
POC + TMA SCALPER GOLD - Expert Advisor Professional DESCRIPTION: Automated trading system designed specifically for XAU/USD, combining Point of Control (POC) with Triangular Moving Average (TMA) to identify high-volume and trending zones. It uses advanced risk management with dynamic trailing stops and an intelligent grid system. TECHNICA
FFx Patterns Alerter gives trade suggestions with Entry, Target 1, Target 2 and StopLoss .... for any of the selected patterns (PinBar, Engulfing, InsideBar, OutsideBar) Below are the different options available: Multiple instances can be applied on the same chart to monitor different patterns Entry suggestion - pips to be added over the break for the entry 3 different options to calculate the SL - by pips, by ATR multiplier or at the pattern High/Low 3 different options to calculate the 2 TPs -
Divergent Stochastic Filter II Catch Reversals Early, Filter Noise, Trade with Confidence The Edge: Why This Stochastic is Different  Every trader knows the Stochastic oscillator. But knowing when to trust its signals, that's the real challenge. The Divergent Stochastic Filter II transforms this classic indicator into a precision reversal detection system by adding critical elements: divergence intelligence, signal filtering and exhaustion detection.  While standard Stochastic oscillators fire s
伝説のウィリアム・ギャン(William Gann)レベルを完全自動で表示するMT5用インジケーター。GANN Masterは日足・週足・月足のデータに基づき、価格が反転またはトレンド継続しやすい重要ゾーンを瞬時にプロットします。 主な機能 ワンクリック期間選択 :Daily/Weekly/Monthlyボタンをクリックするだけで、当日・当週・当月のゾーンを即時表示 自動&手動モード 自動モード :GANN Masterがスイング高値・安値を自動検出し、すべてのギャンレベルを計算 手動モード :チャート上のTopラインとBottomラインをドラッグして任意のスイングポイントを設定、レベルが即座に再計算 強気/弱気レベル :買い/売りそれぞれのレベルを表示。線が接近すると強固なサポート/レジスタンスゾーンを示唆 幅広い銘柄対応 :Forex、貴金属(例:ゴールド)、株価指数、暗号資産など高額商品にも対応。設定でアセットクラスを切り替えるだけでスケールと乗数が自動調整 ユーザーフレンドリーなインターフェース :鮮やかな配色、見やすいラベル、直感的なボタン操作でリアルタイムにレベルを調整 ト
Structure King AI Signal Structure King AI Signal is a professional MetaTrader 5 trading indicator designed to help traders analyze market structure, trend direction, multi-timeframe confirmation and trade management from one clean dashboard. Key Features • Market Structure & Trend Analysis • BUY / SELL Signals • Multi-Timeframe (HTF) Confirmation • Entry Price Levels • Dynamic Stop Loss (SL) • TP1 / TP2 / TP3 Levels • ATR Volatility Analysis • ADX Trend Strength Filter • Adaptive Market Filter
MarketMagnet
Kelly Adediran Raymond
Are you ready to take your trading journey to new heights? Look no further than MarketMagnet, this groundbreaking indicator designed to propel your trading success with excitement and accuracy. Powered by the convergence of Momentum and CCI (Commodity Channel Index), MarketMagnet equips traders with the ultimate tool to determine direction and entry prices for a wide range of recommended currency pairs and instruments. It is designed for traders seeking to scalp for a few pips on lower timeframe
RVE Echo Indicator MT5 — Rejection Velocity Echo RVE Echo Indicator is a custom MetaTrader 5 technical indicator designed to detect abnormal price rejection, sharp velocity changes, and possible reversal zones in the market. RVE stands for Rejection Velocity Echo . The indicator studies how strongly price moves compared to its recent rejection behavior, then highlights moments where the current price movement appears unusually aggressive. This can help traders identify possible exhaustion, rejec

Horizontal lines on the chart alternate between solid and dashed styles, representing areas of interest based on significant highs and lows from different timeframes, creating potential confluence between market structures. The indicator is designed to assist each participant in their own market studies, giving users the flexibility to combine the indicator with their personal trading system and analysis methods . The lines should not be used as standalone entry triggers . Instead, they are inte
GDS Renko Pip ST Chart - Pip-Based Renko Chart Indicator for MetaTrader 5 GDS Renko Pip ST Chart is a pip-based Renko chart indicator for MetaTrader 5. It helps traders build and study cleaner Renko price movement using a practical fixed pip or point-based brick structure. This tool is designed as a Renko chart foundation for manual analysis. It does not predict the market, does not generate buy or sell signals and does not decide whether a trade should be opened. Renko EDGE EA Golden Delta | A
The Rainbow Dragon Indicator by Quant Atlas Creator:  https://www.quant-atlas.com/ The Rainbow Dragon is a composite signal engine that aggregates the seven Rainbow indicators — Blue, Green, Indigo, Red, Violet, Yellow, and Orange — into a single confluence-based reading. Rather than relying on any one model, it treats each Rainbow component as an independent voter and fires only when enough of them agree, giving you a diversified, multi-method read on the market instead of a single point of vie
SMC Indicator BOS & CHoCH analyze market structure using Smart Money Concepts The indicator combines BOS (Break of Structure), CHoCH (Change of Character), Fair Value Gaps (FVG), Liquidity Sweep logic and ATR filtering to provide a structured view of market movements and potential trading opportunities. The indicator automatically identifies swing highs and swing lows and monitors structural breaks in the market. BOS (Break of Structure) identifies potential continuation of the current market st
Caicai L&S Yield Histogram Important Notice: This indicator is an integral tool of the automated EA Caicai Long and Short Pair Trading . This indicator visually displays the percentage deviation (Yield %) of a pair's current spread relative to its own historical mean. It is an excellent tool for quickly visualizing the gross financial potential of a market distortion in Long & Short operations. Main Features: Percentage Visualization: Understand the size of the distortion in palpable percentage
STRICTLY FOR BOOM INDEX ONLY!!!!! Here I bring the Maximum Trend Arrows OT1.0 MT5 indicator. This indicator is made up of a combination of different trend indicators for entries and exits, for entries an orange arrow will paint on the chart below the current market and a red flag for closing of trades and it produces buy arrows only. When the orange arrow appears, it will appear along with it's sound to notify you. The 1H timeframe is recommended, don't use it anywhere else than on the 1H timefr
TREND SNIPER PORTFOLIO MT5 Trend Sniper Portfolio is a fully automated, institutional-grade trading algorithm designed specifically to capture high-probability trend reversals and momentum setups on fast-moving indices, with a primary optimization for the proprietary FX Vol 20 (Weltrade Index) . Unlike traditional high-risk grid or martingale systems that drain account equity during prolonged trends, this algorithm operates under a strict mathematical model built on structural price actio
Cycle Projection Pro is a cyclical analysis indicator for MetaTrader 5, designed for the Daily timeframe. It identifies and projects recurring price cycles forward in time, helping you estimate when — not how much — the market may be approaching a turning point. How it works The indicator sums six harmonic cycles with explicit periods — Weekly, Biweekly, Monthly, Quarterly, Semiannual, Annual — each independently adjustable and can be turned on or off. Their combination produces a composite wav
HAS RSI Signal — SL/TP自動計算機能付き プロフェッショナル・トレンドインジケーター HAS RSI Signal は、信頼性の高いクラシックな手法と最新のノイズ除去アルゴリズムを融合させた強力なトレーディングツールです。 平均足スムーズド(Heiken Ashi Smoothed) と RSI を組み合わせることで、トレンドの転換点や買われすぎ・売られすぎ圏からの脱出タイミングを正確に捉え、明確なエントリーシグナルを提示します。 主な特徴: 二重のフィルタリング: 平均足スムーズドで市場の「ノイズ」を除去し、RSIで勢い(モメンタム)の強さを確認します。 損切り・利確ラインの自動計算: 単にシグナルを出すだけでなく、ボラティリティ( ATR )に基づいた最適なストップロス(SL) と テイクプロフィット(TP)を自動で算出します。 視覚的な分かりやすさ: シグナルはチャート上にカラーキャンドルとして表示されるため、一目でトレンドを把握でき、取引画面をスッキリと保てます。 充実の通知機能: アラート、音声、スマートフォンへのプッシュ通知機能を搭載。チャンスを逃すこと
PipFinite Exit EDGE MT5
Karlo Wilson Vendiola
4.88 (32)
Did You Have A Profitable Trade But Suddenly Reversed? In a solid strategy, exiting a trade is equally important as entering. Exit EDGE helps maximize your current trade profit and avoid turning winning trades to losers. Never Miss An Exit Signal Again Monitor all pairs and timeframes in just 1 chart www.mql5.com/en/blogs/post/726558 How To Trade You can close your open trades as soon as you receive a signal Close your Buy orders if you receive an Exit Buy Signal. Close your Sell orders if
Ultra AS MT5
Yaroslav Varankin
3 (2)
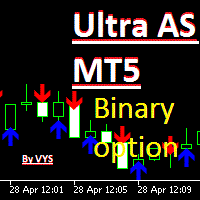
The indicator is designed for binary options trading. The "period" parameter can be adjusted to fit your trading strategy, allowing you to customize the number and quality of signals. A red arrow pointing down indicates a sell signal, while a blue arrow pointing up indicates a buy signal. Recommended expiration time is one candle. You can enter a trade either when the signal appears or on the next candle. Attention: the signal may sometimes disappear on the current candle, so it's important to
CRT Candle Range Theory HTF MT5.   Ultimate CRT Indicator: Advanced ICT Concepts and Malaysian SnR Trading System Master the Market Maker's Footprints with the Most Advanced Candle Range Theory Indicator Unlock the true power of  Smart Money Concepts (SMC)  and trade precisely like the institutions with the  Ultimate CRT Indicator . Built exclusively for serious traders, this indicator automates the highly effective  Candle Range Theory (CRT) , a core pillar of  ICT Concepts (Inner Circle Trader
このプロダクトを購入した人は以下も購入しています
この製品は 2026 年の市場向けに更新され、最新の MT5 ビルドに最適化されています。 価格更新のお知らせ: Smart Trend Trading System は現在 $99 で提供されています。 次の 30 件の購入 後、価格は $199 に上がります。 特別オファー: Smart Trend Trading System を購入後、私にプライベートメッセージを送ることで、 Smart Universal EA を無料 で受け取り、Smart Trend のシグナルを自動売買に変えることができます。 Smart Trend Trading System は、リペイントなし、再描画なし、遅延なしの完全なトレーディングシステムです。よりクリーンなシグナル、より明確なトレンド方向、そしてより整理された取引方法を求めるトレーダー向けに作られています。 Learn Smart Trend Trading System Everything you need to learn, install, and use the product is available here: Online
Trend Sniper X
Sarvarbek Abduvoxobov
4.88 (32)
Trend Sniper X は、トレードの方向性と潜在的な反転ポイントを明確かつ正確に特定するのに役立つ、MetaTrader 5 用のマルチタイムフレーム・トレンドフォロー指標です。 MT4用: https://www.mql5.com/en/market/product/193245 価格情報: 現在の価格はプロモーション価格であり、今後のアップデートや新機能のリリースに伴い変更される場合があります。 ボーナス特典: このインジケーター用の無料自動売買アシスタントEAを入手するには、購入後に an 著者(開発者)へメッセージをお送りください。 Code2Profit チャンネル マルチタイムフレーム分析で相場をマスターしよう! Trend Sniper X で勝率を最大化する方法:重要なルールとセッションのコツ 技術仕様 プラットフォーム MetaTrader 5 インジケータータイプ マルチタイムフレーム・トレンドインジケーター 操作タイムフレーム あらゆるチャートタイムフレームに対応。個別に選択可能な上位タイムフレーム (M1–MN1) を搭載 主要銘柄 FX、ゴールド (X
Neuro Poseidon is a new indicator by Daria Rezueva. It combines precise trading signals with adaptive TP/SL levels - creating best possible trades as a result! Message me and get  Neuro Poseidon Assistant  as a gift to automize your trading process! What makes it stand out? 1. Proven profitability on all assets and timeframes 2. Only confirmed BUY and SELL signals present on the chart 3. Adaptive TP & SL levels generated by the software for each trade 4. Easy to understand - suitable for al
SuperScalp Pro
Van Minh Nguyen
4.64 (33)
SuperScalp Pro - Professional Multi-Layer Confluence Scalping System SuperScalp Proは、クラシックなSupertrendに複数のインテリジェントな確認フィルターを追加した、高度なスキャルピングインジケーターです。より高い確率が期待できるBuy/Sellの取引機会を特定し、ダマシのシグナルを大幅に減らすことをサポートします。 明確なBuyとSellの矢印がチャート上に直接表示され、ATRに基づくStop LossとTake Profitのレベルがリアルタイムで自動計算されます。 購入後、設定方法や推奨設定についてのサポートが必要な場合は、私にご連絡ください。 SuperScalp Pro Auto Traderを使用して、シグナルを簡単に自動化できます: [Auto Trader] 推奨設定ファイルをダウンロード: [Set File] 完全なドキュメントは製品ブログでご覧いただけます: [User Guide] 最新情報を受け取るには公式チャンネルに参加してください: [Official Channel]
Welcome to ENTRY IN THE ZONE AND SMC MULTI TIMEFRAME Entry In The Zone and SMC Multi Timeframe is a real-time market analysis tool based on Smart Money Concepts (SMC), designed to analyze market structure, price direction, and key trading zones. It supports both Single-Timeframe Analysis and Multi-Timeframe Analysis, providing a clearer view of the overall market structure across multiple timeframes, with real-time BUY / SELL signals that do not repaint. It is designed to help filter trading opp
M1 SNIPER は使いやすいトレーディングインジケーターシステムです。M1時間足向けに設計された矢印インジケーターです。M1時間足でのスキャルピングのためのスタンドアロンシステムとして、また既存のトレーディングシステムの一部としても使用できます。このトレーディングシステムはM1時間足での取引に特化して設計されていますが、他の時間足でも使用できます。元々、この手法はXAUUSDとBTCUSDの取引用に設計しましたが、他の市場においても役立つと考えています。 インジケーターのシグナルは、トレンドの方向と逆方向に取引できます。インジケーターのシグナルを利用して両方向に取引するのに役立つ特別な取引テクニックをご紹介します。この手法は、特別な動的なサポートとレジスタンスの価格帯を利用することに基づいています。 ご購入後、M1 SNIPER矢印インジケーターをすぐにダウンロードできます。さらに、M1 SNIPERツールのすべてのユーザーに、以下のスクリーンショットに表示されているApollo Dynamic SRインジケーターを無料で提供しています。この2つのインジケーターを組み合わせることで
SPECIAL OFFER: Buy UNIX Scalper. Get Smart Universal Expert Advisor FREE. Purchase UNIX Scalper for MT5 and receive Smart Universal Expert Advisor at no additional charge to automate your UNIX Scalper signals. One $99 purchase. Your indicator plus a free automation EA. After purchasing, send me a private message on MQL5 to claim your EA.  UNIX Scalper — Multi-Market Analysis, Trade Planning and Automation Find the setup. See the plan. Choose how to trade it. UNIX Scalper brings market analysis,
伝説が帰ってきました:Entry Points Pro 10。 MQL5 Marketのトップ3に3年間入り続けた伝説的インジケーターの再始動です。 2つのバージョンで合計589件の高評価レビュー、毎日数千人のトレーダーが実際のトレードに使用し、デモのダウンロードは31,000件以上   MT4+MT5 。 私はこの5年間に寄せられたレビューをすべて読み、約束を並べる代わりに、その答えをバージョン10に組み込みました。1999年から相場に携わり、 誠実さ、自らの評判、そして顧客を大切にする 作者による製品です。 Entry Points Proのエントリーシグナルは、リペイント(再描画)を一切行いません。 そして今回初めて、これは作者の言葉ではなく検証可能な事実になりました。確定シグナルはローソク足の終値確定後にのみ表示され、自動テストで リペイントはゼロ と確認されています(EURUSD、XAUUSD、BTCUSDで2,486,568回の不変条件チェック、違反0件)。検証方法は公開されており、ストラテジーテスターでご自身で再現できます。 ご購入後は、必ずすぐにダイレクトメッセージでご
Reversion King Indicator
Eugen-alexandru Zibileanu
5 (7)
新たな王者が登場 - インジケーター + 注文管理表示(TP1 + TP2 + TP3)+ オプションのTelegramシグナル送信機能付き(無料) (完全なトレード&シグナルシステム) ゴールド向け最高のEA: Gold Slayer このインジケーターには、高度な戦略、カスタマイズ可能な注文管理システム、そしてエンベロープ拡張を組み合わせた平均回帰システムが搭載されています。さらに、RSIなど複数のインテリジェントな確認フィルターによって、高確率の反転エントリーをBUY・SELLシグナルとして検出します。 単にトレードを学ぶだけでなく、複数ポジションを効果的に管理し、過去に利益を出しているオープンポジションで損失トレードをカバーする方法も学べます。 M5向けに構築・最適化されており、流動性が高くシグナルの精度が安定しているBTCUSDとXAUUSDで優れたパフォーマンスを発揮します。 このインジケーターは、ATRを基に自動計算されたエントリー、ストップロス、テイクプロフィットレベルを備えた明確なLong・Shortシグナルを提供するため、リスク管理が最初から組み込まれています。 マ
この製品は 2026 年の市場向けに更新され、最新の MT5 ビルドに最適化されています。 価格更新のお知らせ: Atomic Analyst は現在 $99 で提供されています。 次の 30 件の購入 後、価格は $199 に上がります。 特別オファー: Atomic Analyst を購入後、私にプライベートメッセージを送ることで、 Smart Universal EA を無料 で受け取り、Atomic Analyst のシグナルを自動売買に変えることができます。 Atomic Analyst は、リペイントなし、再描画なし、遅延なしの Price Action トレーディングインジケーターで、手動取引、シグナルの明確化、EA 自動化のために設計されています。 User manual: settings, inputs and strategy.   &   User Manual PDF . 価格行動、強さ、モメンタム、マルチタイムフレーム方向、高度なフィルターを分析し、トレーダーがノイズを減らし、弱いセットアップを避け、より構造化された取引判断を行えるようにします。 このイ
Gann Made Easy   は、ミスター・ギャンの理論を使用した取引の最良の原則に基づいた、プロフェッショナルで使いやすい外国為替取引システムです。 W・D・ガン。このインジケーターは、ストップロスとテイクプロフィットレベルを含む正確な買いと売りのシグナルを提供します。 PUSH通知を利用して外出先でも取引可能です。 ご購入後、取引方法の説明と優れた追加インジケーターを無料で入手するには、私にご連絡ください! おそらく、ギャンの取引手法についてはすでに何度も聞いたことがあるでしょう。通常、ギャンの理論は初心者のトレーダーだけでなく、すでにある程度の取引経験がある人にとっても非常に複雑なものです。なぜなら、ギャンの取引手法は理論的にはそれほど簡単に適用できるものではないからです。私はその知識を磨き、最良の原則を私の外国為替インジケーターに組み込むために数年を費やしました。 このインジケーターは非常に簡単に適用できます。必要なのは、それをチャートに添付し、簡単な取引推奨事項に従うだけです。このインジケーターは常に市場分析の仕事を行い、取引の機会を探します。適切なエントリーポイントを検
UZFX {SSS} スキャルピング・スマートシグナル v5.0 MT5は、変動の激しい市場において正確かつリアルタイムのシグナルを求めるスキャルパー、デイトレーダー、スイングトレーダー向けに設計された、リペイントのない高性能な取引インジケーターです。(UZFX-LABS)によって開発されたこのインジケーターは、価格行動分析、トレンド確認、スマートフィルタリングを組み合わせることで、すべての通貨ペアおよび時間枠において、高確率の売買シグナル、警告シグナル、トレンド継続の機会を生成します。 トレードの判断に迷うのはもうやめましょう。明確さ、正確さ、そして規律ある市場執行を求めるトレーダーのために設計された、体系的なシグナルシステムに従い始めましょう。 間違いなく、MQL5で入手可能な最高のインジケーターの一つです。絶対に見逃さないでください!!「スマートなトレーダーのためのスマートシグナル」 最新バージョン5.0がリリースされました。価格は予告なく最大499.99ドルまで値上がりする可能性がありますので、チャンスを逃さないようお早めにお求めください!! 購入を決める前に!無料トライアル
Scalper Vault は、スキャルピングを成功させるために必要なすべてを提供するプロフェッショナルなスキャルピング システムです。このインジケーターは、外国為替およびバイナリー オプションのトレーダーが使用できる完全な取引システムです。推奨される時間枠は M5 です。 システムは、トレンドの方向に正確な矢印シグナルを提供します。また、トップとボトムのシグナルとギャン マーケット レベルも提供します。 インジケーターは、プッシュ通知を含むすべてのタイプのアラートを提供します。 インジケータの購入後にご連絡ください。私の個人的な取引の推奨事項と素晴らしいボーナス指標を無料で共有します! 幸せで有益な取引をお祈りします!
FiboSniper Pro – Multi-Filter Fibonacci System with Auto SL/TP and Control Panel FiboSniper Proは、動的なFibonacci Envelopesと複数の確認フィルターを組み合わせ、選別されたBuyおよびSellシグナルを生成するテクニカルインジケーターです。FibonacciレベルはMoving AverageとATRを基に計算され、その後ADX、EMA、RSI、ATR、Volume、Time、Candle構造によってフィルタリングされます。インジケーターは、ATRに基づく自動Stop LossおよびTake Profitレベルをチャート上に直接表示し、さらに迅速な調整が可能なインタラクティブControl Panelを提供します。 購入後、推奨設定ファイルと詳細な使用方法については、私にご連絡ください。 Auto Trader Xを使用してFiboSniper Proのシグナルを自動化できます: [Auto Trader X] User GuideとSet Files: [Click her
このインジケーターを購入された方には、以下の特典を 無料 で提供しています: 各トレードを自動で管理し、ストップロスとテイクプロフィットを設定し、戦略ルールに基づいてポジションを決済する補助ツール 「Bomber Utility」 様々な銘柄に合わせたインジケーターの設定ファイル(セットファイル) 「最小リスク」、「バランスリスク」、「待機戦略」 の3つのモードで使用できる Bomber Utility 用の設定ファイル このトレーディング戦略をすぐに導入・設定・開始できる ステップバイステップのビデオマニュアル ご注意: 上記の特典を受け取るには、MQL5のプライベートメッセージシステムを通じて販売者にご連絡ください。 オリジナルのカスタムインジケーター 「Divergence Bomber(ダイバージェンス・ボンバー)」 をご紹介します。これは、MACDのダイバージェンス(乖離)戦略に基づいた 「オールインワン」型のトレーディングシステム です。 このテクニカルインジケーターの主な目的は、価格とMACDインジケーターの間に発生するダイバージェンスを検出 し、将来の価格の動きを示
通貨強さウィザードは、取引を成功させるためのオールインワン ソリューションを提供する非常に強力な指標です。このインジケーターは、複数の時間枠のすべての通貨のデータを使用して、このまたはその外国為替ペアのパワーを計算します。このデータは、使いやすい通貨インデックスと通貨パワーラインの形式で表され、特定の通貨のパワーを確認するために使用できます。 必要なのは、取引したいチャートにインジケーターを接続することだけです。インジケーターは、取引する通貨の実際の強さを示します。このインジケーターは、トレンドに合わせて取引するときに有利に利用できる売買高の圧力の極値も示します。このインジケーターには、フィボナッチに基づく可能なターゲットも表示されます。 このインジケーターは、PUSH 通知を含むあらゆるタイプのアラートを提供します。 購入後ご連絡下さい。私の取引のヒントをあなたと共有し、素晴らしいボーナスインジケーターを無料で提供します! 幸せで有益な取引をお祈りします。
GEM Signal Pro GEM Signal Pro は、MetaTrader 5 向けのトレンドフォロー型インジケーターです。より明確なシグナル、より整理されたトレードセットアップ、そして実用的なリスク管理をチャート上で確認したいトレーダーのために設計されています。 単純な矢印だけを表示するのではなく、GEM Signal Pro はトレード全体の考え方を、より見やすく分かりやすい形で表示します。条件が確認されると、インジケーターはエントリー価格、ストップロス、利確目標をチャート上に表示し、トレードセットアップをより効率的に確認できるようにします。 動作の仕組み このインジケーターは、まず内部ロジックに基づいて有効なシードシグナルを検出します。 確認条件が満たされると、GEM Signal Pro はチャート上に完全なセットアップを表示します。これにより、トレーダーはトレード構造をより明確に把握し、手作業による分析を減らすことができます。 チャート上のトレードレベル 確認済みシグナルに対して、GEM Signal Pro は以下を表示できます。 エントリー価格 ストップロス テ
ATSTRONG PRO:市場構造&ブレイクアウトインジケーター ブレイクアウト検出エンジン | 5つの動的TPターゲット | ライブダッシュボードパネル | リペイントなし 導入価格 現在の価格: $59 — 10回の販売ごとに価格が$10上昇します。 ATSTRONG PRO は、MetaTrader 5 用に設計された高度なブレイクアウトおよび機関投資家向け市場構造インジケーターです。 高確率のスイングピボットを検出し、クラスター化されたサポートとレジスタンスの蓄積ゾーンを特定し、 リアルタイムで構造の破壊(BOS)と性質の変化(CHoCH)のシグナルを発します。 このインジケーターは、ダイナミックなストップロスと5つの個別のテイクプロフィットレベル(TP1〜TP5)をチャート上に自動的に直接描画します。 リスクリワード予測ボックス、星付けされたシグナル品質の評価、およびリアルタイムのオンチャートパフォーマンス分析ダッシュボードを備えています。 取引に関する注意: これは手動取引および市場分析用のインジケーターです。ローソク足の確定時に明確な視覚的シグナル、レベル、アラー
Power Candles V3 - 自己最適化型強弱インジケーター Power Candles V3は 、通貨や銘柄の強さを、適用されたすべてのチャート上で実行可能なトレードプランに変換します。単にローソク足を色分けするだけでなく、バックグラウンドでリアルタイムの自動最適化を実行し、目の前の銘柄に対して最適なストップロス、テイクプロフィット、およびシグナルの閾値を提示します。ワンクリックで実取引に適用でき、エントリーポイント、ストップロス、テイクプロフィットのラインが正確な価格位置にチャート上に表示され、方向性を示すアラートがリアルタイムで発動します。 このツールは、Stein Investmentsのエコシステムの一部です。  18種類以上のツールをすべて閲覧し、AIを活用したセットアップの推奨事項を入手し、  https://stein.investments でコミュニティに参加しましょう クローズしたバーごとに3,000回以上のトレードシミュレーション。9つの強さの状態。2つの戦略を並行してテスト。勝率の高い設定をワンクリックで適用。 なぜこれが必要なのか ほとんどの強
Azimuth Pro
Ottaviano De Cicco
5 (7)
Azimuth Pro V2:MT5向けシンセティック・フラクタル構造分析と確認済みエントリー 概要 Azimuth Pro は Merkava Labs によるマルチレベルスイング構造インジケーターです。4つのネストされたスイングレイヤー、スイングアンカーVWAP、ABCパターン検出、3タイムフレーム構造フィルタリング、そして確定バーでの確認済みエントリー — 1つのチャートで、ミクロスイングからマクロサイクルまでを網羅するワークフロー。 これはブラインドシグナル製品ではありません。ロケーション、コンテキスト、タイミングを重視するトレーダーのための構造ファーストワークフローです。 ️ サマーセール — 夏至とThe Oracle Proの発売を記念して、Azimuth Proが30%オフ。現在279 USD(通常399 USD)。期間限定の夏季オファー。 1. V2での変更点 シンセティック・マルチタイムフレームエンジン 上位タイムフレーム分析をMeridian Proと同じ独自のシンセティックアーキテクチャで一から再構築。よりクリーンなHTFコンテキスト、安定したライブ動作、
Crystal Heikin Ashi Signals - Professional Trend & Signal Detection Indicator Advanced Heikin Ashi Visualization with Intelligent Signal System for Manual & Automated Trading Final Price: $149 ---------> Price goes up $10 after every 10 sales . Limited slots available — act fast . Overview Crystal Heikin Ashi Signals is a professional-grade MetaTrader 5 indicator that combines pure Heikin Ashi candle visualization with an advanced momentum-shift detection system. Designed for both manual traders
トレンドキャッチャーインジケーター トレンドキャッチャーインジケーターは、開発者独自の適応型トレンド分析指標を組み合わせることで、市場価格の動きを分析します。短期的なノイズを除去し、根底にあるモメンタムの強さ、ボラティリティの拡大、価格構造の挙動に焦点を当てることで、真の市場方向性を特定します。また、移動平均線、RSI、ボラティリティフィルターなどの平滑化およびトレンドフィルタリング機能を備えたカスタマイズ指標も使用します。 実際の運用状況のモニタリングやその他の製品については、こちらをご覧ください: https://www.mql5.com/en/users/mechanic/seller ご注意ください。私はTelegramでEAや設定を販売していません。詐欺です。すべての設定はブログで無料で公開しています。 重要!ご購入後すぐにご連絡ください。手順とボーナスをお送りします!
Crystal Quantum Pro
Muhammad Jawad Shabir
5 (3)
CRYSTAL QUANTUM PRO Institutional Signal & Trade Intelligence for MetaTrader 5 Final Price: 199 USD ----> Price goes up 10 USD after every 10 sales. Limited launch slots available, act fast. Most indicators give you an arrow and leave you alone. A naked arrow is a gamble. Winning consistently requires CONFLUENCE , a clear STOP and TARGET , and honest PROOF that the system works. Crystal Quantum Pro delivers all three in one clean, no-repaint package. Crystal Quantum Pro is a complete decision sy
FX Power: 通貨の強弱を分析して、より賢い取引を実現 概要 FX Power は主要通貨と金の実際の強弱をあらゆる市場状況で理解するための必須ツールです。強い通貨を買い、弱い通貨を売ることで、 FX Power は取引の意思決定を簡素化し、高い確率の取引機会を見出します。トレンドを追従する場合でも、極端なデルタ値を使用して反転を予測する場合でも、このツールはあなたの取引スタイルに完全に適応します。ただ取引するだけではなく、 FX Power で賢く取引をしましょう。 1. なぜ FX Power がトレーダーにとって非常に有益なのか 通貨と金のリアルタイム強弱分析 • FX Power は主要通貨と金の相対的な強弱を計算し、マーケットダイナミクスに関する明確な洞察を提供します。 • どの資産がリードしているか、または後れを取っているかを監視して、取引するペアを賢く選びましょう。 マルチタイムフレームの包括的なビュー • 短期、中期、長期のタイムフレームで通貨と金の強弱を追跡し、マーケットトレンドに基づいて取引戦略を調整できます。 • スキャルピングからスイングトレード
FX Trend NG:次世代マルチマーケット・トレンドインテリジェンス 概要 FX Trend NG は、複数の時間足に対応したプロフェッショナル向けトレンド分析およびマーケット監視ツールです。 市場全体の構造を数秒で把握することができます。 複数のチャートを切り替える必要はありません。どの銘柄がトレンド中なのか、どこでモメンタムが弱まっているのか、そしてどの時間足で強い整合性があるのかを瞬時に確認できます。 ローンチ特別オファー – FX Trend NG を $30(6ヶ月) または $80 永久ライセンス でご利用いただけます。 すでに Stein Investments のユーザーですか? -> メッセージを送信 して、プライベートグループへアクセスしてください。 セットアップや詳細情報が必要ですか? -> Stein Investments 公式ページ をご覧ください。 1. FX Trend NG が他と異なる理由 3ステート・トレンドロジック ― Buy と Sell だけではない • 多くのインジケーターは Buy または Sell の2状態のみを表示します。
BTMM State Engine Pro by G-Labs — Beat The Market Maker indicator for MetaTrader 5. Asian session range, London and New York kill zones, level progression (L1/L2/L3), peak formation detection (PFH/PFL), entry signals, and a multi-pair scanner from one chart. Stop scanning charts one pair at a time. The State Engine tracks the BTMM daily cycle automatically — Asian box, room boundaries, level blocks, peak formations, and filtered entries — while the scanner dashboard shows level, peak status, d
M1 Quantum MT5
Hamed Dehgani
4.27 (11)
M1 Quantum を使用したライブトレードシグナル : シグナル (取引は 自動的に Quantum Trade Assistant によって実行され、この製品に 無料 で含まれています。) 最新ニュース: バージョン1.64がリリースされました。現在、すべての取引で、関連するサポート/レジスタンスゾーンの後ろにStop Lossが設定されます。今回のバージョンでは、EAのパフォーマンスを向上させるためにSmart Close機能も改善されました。 8月9日から、ライブシグナルはバージョン1.64で稼働しています。 価格プラン: 現在価格: $169 (早期購入者向けオファー) 次回予定価格: $189 予定小売価格: $299 開発者からのお知らせ: ご購入後、 最新の推奨設定ファイル(Set File) 、運用アドバイス、および他の M1 Quantum ユーザーと交流できる VIPサポートグループ への招待をご希望の場合は、お気軽にご連絡ください。 よくある質問 - 設定ファイル - インストールガイド M1 Quantum は、M1専用のプロフェッショナルトレーディング
Precision Spike Detector
Francisco Mandomo Simbine
5 (2)
Precision Spike Detector V3 – Institutional-Grade AI Trading System Attention: The price increases by US$50 for every 10 purchases.  Final price: US$599 Precision Spike Detector V3   is a   state-of-the-art, institutional-grade market analysis system   for   MetaTrader 5 , designed to detect   high-probability market movements   in synthetic indices such as   Boom, Crash, GainX, and PainX . After purchase, send me a private message to receive the optimized configuration files,  the installation
Elliott Wave Hunter - SMC Edition Elliott Wave Hunter identifies Elliott Wave 2 and Wave 5 setups and combines them with Smart Money Concepts to filter entries to high-probability zones only. Wave 2 signals mark continuation entries in the direction of the dominant Wave 1 impulse. The indicator waits for the retracement to confirm, locates an Order Block, Fair Value Gap or Liquidity Sweep zone within the impulse, then triggers only when price returns to retest that zone with a qualifying revers
ICT PO3 (Power of 3) AMD Protocol Framework Indicator True Time & Structure Integration   |  Non-Repainting | Real-Time  | Multi-Asset  | MT4 Version Available Full Setup Guide & Strategy Playbook: https://www.mql5.com/en/blogs/post/768683 MT4 Version: https://www.mql5.com/en/market/product/171742 Indicator Overview The ICT PO3 AMD Protocol Framework is a complete structural overlay for MetaTrader 5 that maps the True Daily Cycle directly onto your lower-timeframe execution chart. It project
作者のその他のプロダクト
SWING VOLUME PROFILE Swing-Based Volume Profile + Fibonacci + RSI -------------------------------------------------- Auto-detected swings. Volume profile. Fibonacci. RSI. All-in-one. -------------------------------------------------- WHAT THIS INDICATOR DOES Swing Volume Profile (SVP) automatically detects structural swings and displays a volume profile for the most recent completed swing — with Fibonacci retracement and RSI overlay. No manual range selection needed. The indicator finds
FIXED RANGE VOLUME PROFILE Auto-Detecting Volume Profile Indicator with Real-Time Trendline Tracking -------------------------------------------------- FREE INDICATOR Volume distribution. Value areas. High-volume nodes. All from your trendline. -------------------------------------------------- WHAT THIS INDICATOR DOES Fixed Range Volume Profile (FRVP) displays volume distribution over a user-defined range — automatically detecting the latest trendline you draw or drag on the chart. No
SWING DETECTOR WITH RSI AND FIBONACCI Structural Swing Points + Fibonacci Retracement + RSI Overlay -------------------------------------------------- FREE INDICATOR Identify swings. See Fibonacci levels. Check RSI. All in one free indicator. -------------------------------------------------- WHAT THIS INDICATOR DOES This indicator automatically detects structural swing highs and lows using configurable depth and deviation filtering. It connects swings with trend lines, overlays standard
FREE
SWING HIGHS LOWS DETECTOR Swing Detection with Divergence Analysis -------------------------------------------------- Identify swings. Spot divergences. Trade with confluence. -------------------------------------------------- WHAT THIS INDICATOR DOES This indicator automatically detects structural swing highs and lows using configurable depth and deviation filtering. It then analyzes RSI and MACD to detect regular and hidden divergences between consecutive swings of the same type. Diver
FREE
SWING DETECTOR WITH RSI AND FIBONACCI Structural Swing Points + Fibonacci Retracement + RSI Overlay -------------------------------------------------- FREE INDICATOR Identify swings. See Fibonacci levels. Check RSI. All in one free indicator. -------------------------------------------------- WHAT THIS INDICATOR DOES This indicator automatically detects structural swing highs and lows using configurable depth and deviation filtering. It connects swings with trend lines, overlays standard
FREE
SWING HIGHS LOWS DETECTOR Swing Detection with Divergence Analysis -------------------------------------------------- Identify swings. Spot divergences. Trade with confluence. -------------------------------------------------- WHAT THIS INDICATOR DOES This indicator automatically detects structural swing highs and lows using configurable depth and deviation filtering. It then analyzes RSI and MACD to detect regular and hidden divergences between consecutive swings of the same type. Diver
FREE
FIXED RANGE VOLUME PROFILE Auto-Detecting Volume Profile Indicator with Real-Time Trendline Tracking -------------------------------------------------- Volume distribution. Value areas. High-volume nodes. All from your trendline. -------------------------------------------------- WHAT THIS INDICATOR DOES Fixed Range Volume Profile (FRVP) displays volume distribution over a user-defined range — automatically detecting the latest trendline you draw or drag on the chart. No manual range sel
ADAPTIVE SWING DENSITY HEAT MAP Structural Density + Participation Analysis -------------------------------------------------- See where price clusters. See where price fights. -------------------------------------------------- WHAT THIS INDICATOR DOES This indicator analyzes swing point density across price levels, then tracks how price actually interacts with each zone — measuring participation, acceptance, and rejection. The result is a heat map of structural zones, color-coded by den
CONSOLIDATION INTELLIGENCE PRO (MT4) Catch The Next Big Move! Stop Getting Chopped Up in Ranges. Map Institutional Order Density With 5-Tier Heatmaps. Up to 70% of retail losses happen inside messy consolidation ranges. Consolidation Intelligence Pro scans your MT4 charts for overlapping candle accumulation, measures body-to-wick density, and maps real-time 5-Tier Heatmaps directly over high-value consolidation zones. You instantly see where liquidity is stacked, where institutional orders are c
DONCHIAN MARKET & TREND INTELLIGENCE ENGINE (MT4) Multi-Factor Volatility, Trend Structure & Institutional Breakout Validation Dashboard MOST BREAKOUT INDICATORS ARE TRAPPING YOU. They Tell You THAT Price Broke Out. They Never Tell You IF It Will Hold. You have lived this scenario dozens of times: Price spends days coiling inside a tight Donchian band on your MT4 chart. A massive candle punches above the 20-period high. You buy the breakout — expecting momentum. Three candles later, price colla
BOLLINGER MARKET & TREND INTELLIGENCE — MT4 Edition STOP GUESSING WHICH BREAKOUTS ARE REAL. Most Bollinger breakouts fail. This engine tells you which ones won't — before you risk a single dollar. You get a quality score, a volatility percentile, and a post-breakout efficiency reading. All locked on bar close. No repainting. No guessing. The market gives you maybe three clean breakouts a week. This tool makes sure you catch them — and helps you avoid the twelve that would have stopped you out. T
FREE
ADAPTIVE SWING DENSITY HEAT MAP Structural Density + Participation Analysis See where price clusters. See where price fights. -------------------------------------------------- WHAT THIS INDICATOR DOES This indicator analyzes swing point density across price levels, then tracks how price actually interacts with each zone — measuring participation, acceptance, and rejection. The result is a heat map of structural zones, color-coded by density strength: - Red zones = Highest density (80-10
SWING VOLUME PROFILE Swing-Based Volume Profile + Fibonacci + RSI -------------------------------------------------- Auto-detected swings. Volume profile. Fibonacci. RSI. All-in-one. -------------------------------------------------- WHAT THIS INDICATOR DOES Swing Volume Profile (SVP) automatically detects structural swings and displays a volume profile for the most recent completed swing — with Fibonacci retracement and RSI overlay. No manual range selection needed. The indicator finds
CONSOLIDATION INTELLIGENCE PRO Catch The Next Big Move!Stop Getting Chopped Up in Ranges. Map Institutional Order Density With 5-Tier Heatmaps. Up to 70% of retail losses happen inside messy consolidation ranges. Consolidation Intelligence Pro scans your charts for overlapping candle accumulation, measures body-to-wick density, and maps real-time 5-Tier Heatmaps directly over high-value consolidation zones. You instantly see where liquidity is stacked, where institutional orders are concentrate
DONCHIAN MARKET & TREND INTELLIGENCE The Only Donchian Tool That Tells You WHY the Market Is Moving — Not Just Where Most Donchian indicators draw three lines and call it a day. You get an upper band. A middle band. A lower band. And when price pokes above the upper band, you're supposed to just... buy? That's not analysis. That's guessing with extra steps. THE PROBLEM EVERY DONCHIAN TRADER KNOWS You've seen it a hundred times. Price finally breaks above the 20-period high after days of compress
VWAP SNIPER REVERSAL PRO Stop Catching Falling Knives. Trade Institutional Exhaustion With Zero Repaint Guesswork. Most mean-reversion indicators force you to guess where a market will turn. VWAP Sniper Reversal Pro waits for institutional buyers or sellers to completely exhaust themselves BEFORE firing a single signal arrow. You get the exact entry, the exact structural turn, and absolute non-repainting confidence. If you are tired of watching "overbought" signals keep climbing while your accou
フィルタ:
レビューなし
レビューに返信