Bollinger Market Structure and Trend Intelligence

BOLLINGER MARKET & TREND INTELLIGENCE — MT5 Edition

STOP GUESSING WHICH BREAKOUTS ARE REAL.

Most Bollinger breakouts fail. This engine tells you which ones won't — before you risk a single dollar.

You get a quality score, a volatility percentile, and a post-breakout efficiency reading. All locked on bar close. No repainting. No guessing.

The market gives you maybe three clean breakouts a week. This tool makes sure you catch them — and helps you avoid the twelve that would have stopped you out.

THE PROBLEM

You've been here before.

It's 2 AM. You're staring at a chart. Price just closed outside the upper Bollinger Band. Your heart rate jumps. You enter long.

Three candles later, price is back inside the band. Then it collapses. Your stop gets hit. You're left staring at a "confirmed" breakout that reversed the moment you clicked buy.

You tell yourself: "I should have waited for a retest."

But when you wait for retests, the market runs without you. You watch a 200-pip move from the sidelines because you were "being patient."

So you try adding filters. An RSI here. A MACD there. An ADX overlay. Now your chart looks like a Christmas tree. Twelve indicators. Six conflicting signals. And you still don't know if the breakout is real.

The problem isn't your discipline. It isn't your strategy.

The problem is that your tools don't measure what actually matters.

They don't tell you if volatility was compressed before the breakout. They don't score the breakout candle's body and close position. They don't measure post-breakout directional efficiency. They don't distinguish between a genuine channel violation and a liquidity sweep.

What if you could see all of that — in one panel — and make a decision in under three seconds?

THE REVELATION

Bollinger Market & Trend Intelligence is a complete analytical engine for MT5 that transforms raw Bollinger Bands into a multi-dimensional decision system.

Its core promise is simple: Know whether a breakout is worth trading — before you enter.

Here's the fundamental insight that separates this from every other Bollinger indicator on the marketplace:

Most tools evaluate the breakout bar using the current Bollinger Bands — which means the breakout bar itself moves the band it's supposedly breaking. That's circular logic. That's why so many signals repaint or fail.

This engine reads the completed Bollinger Bands from the bar strictly before the evaluated bar. The breakout tests a fixed, pre-existing threshold. It cannot move its own goalpost. The band is locked. The signal is honest.

Think of it as a lie detector for breakouts. Price can scream "I'm breaking out!" — but this engine checks the volatility context, the candle quality, the follow-through, and the efficiency of the move. If the story doesn't hold up, it tells you.

No repainting. No circular logic. No false confidence.

THE DASHBOARD — YOUR ENTIRE MARKET IN ONE GLANCE

When you attach this indicator to your MT5 chart, a clean, color-coded command center appears in the corner you choose. It's designed for dark-themed charts — high contrast, no eye strain, no clutter.

The dashboard is organized into five logical panels. Each panel answers a specific question you're already asking.

Top-left: MARKET STATE. What is volatility doing right now? You see the state — from EXTREME COMPRESSION to EXTREME EXPANSION — in a color-coded readout. Below it, the width percentile tells you exactly where current volatility sits relative to the last 100 bars. The Width/ATR ratio normalizes across symbols and timeframes. Velocity and acceleration show whether volatility is speeding up or slowing down. The "Interpretation" line translates it all into plain English: "Extreme compression releasing strongly" or "Expansion decelerating."

Top-middle: GENERAL TREND. What is the broader structure doing? You get direction, strength score (0-100), state (STRONG UPTREND to STRONG DOWNTREND), confidence level, market structure (HH + HL, LH + LL, etc.), momentum with ADX reading, persistence percentage, and phase (ESTABLISHED UPTREND, TREND DEVELOPING, TREND WEAKENING, etc.). The "Environment" line tells you if the trend is happening under compression or expansion.

Top-right: CURRENT TREND. What is the recent pressure doing? Same comprehensive readout — but over a shorter lookback. This is where you see if the current pressure aligns with or contradicts the broader trend. The "Pressure" insight tells you if momentum is building, fading, or absent.

Bottom-left: BREAKOUT INTELLIGENCE. This is the heart of the system. You see the direction of the most recent breakout, how many bars ago it occurred, its status (BREAKOUT, VALID, RETESTED, FALSE BREAKOUT, SWEPT, BULLISH CONTINUATION, etc.), its quality score (MARGINAL to EXCELLENT), the breakout candle type (STRONG BULLISH, BEARISH, etc.), body percentage, close position percentage, distance from the channel in ATR multiples, and your current price position within the channel. The "Signal" insight condenses it all into one actionable line.

Bottom-right: POST-BREAKOUT. What happened after the breakout? This panel measures the actual follow-through. You see the post-breakout state (BULLISH, BEARISH, RANGING), momentum, progression (HIGHER, LOWER CHANNEL, SIDEWAYS), bars analyzed, bullish movement in points, bearish movement in points, net change, efficiency percentage, and the bull/bear/range bar distribution.

Bottom: FINAL ASSESSMENT. The system synthesizes everything into a final deduction paragraph. It tells you the relationship between general and current trend, the market environment, and what to watch for next. A large, color-coded FINAL BIAS badge gives you the bottom line: BULLISH, BEARISH, EMERGING BULLISH, BULLISH STRUCTURE / CORRECTION, etc. — with a LONG/SHORT/NEUTRAL tag and the current volatility state.

Every panel uses a carefully chosen ultraviolet palette — indigo, plum, bronze — that stands out on dark charts without being garish. Bullish readings glow lime green. Bearish readings burn tomato red. Warning states flash gold. You understand the entire market in under three seconds.

THE ENGINE ROOM — WHAT'S ACTUALLY UNDER THE HOOD

This isn't a simple Bollinger Bands plot with some arrows. It's a seven-phase analytical engine. Here's what each phase does — and why it matters to your bottom line.

PHASE 1: THE FIXED THRESHOLD

What it does: Reads the completed Bollinger Bands from the bar before the evaluated bar. The breakout bar tests a fixed, pre-existing band.

Why it matters to you: This is the single most important architectural decision in the entire indicator. It eliminates the circular logic that causes repainting and false signals in almost every other Bollinger breakout tool.

Without it: You'd be trading breakouts that only exist because the breakout bar itself moved the band. That's not a signal. That's a mirage.

PHASE 2: THE VOLATILITY ENGINE

What it does: Calculates Bollinger Band width, normalizes it against ATR, then computes a percentile rank over your chosen lookback (default: 100 bars). It also calculates width velocity (how fast width is changing) and acceleration (how fast velocity is changing). A hysteresis mechanism prevents state-flipping when readings hover near thresholds.

Why it matters to you: Volatility context is everything. A breakout from EXTREME COMPRESSION is a different animal than a breakout from EXTREME EXPANSION. This engine tells you which one you're looking at — and whether the compression is deepening, holding, or releasing.

Without it: You'd treat every breakout the same. You'd enter breakouts from exhausted expansion moves and wonder why they fail.

PHASE 3: THE PERSISTENT BREAKOUT ENGINE

What it does: Scans up to 3,000 bars (configurable) to find the most recent qualifying breakout. Stores it persistently with absolute bar indexing. Tracks whether it's been confirmed (price held outside the channel for N bars), retired (price returned inside for N bars), or aged out.

Why it matters to you: You always see the most recent breakout — even if it happened 200 bars ago. The engine remembers. You don't have to scroll back or wonder.

Without it: You'd miss the context of the last breakout. You'd see a new signal without knowing how the previous one resolved.

PHASE 4: BREAKOUT INTELLIGENCE

What it does: Scores the breakout candle itself. Measures body percentage (how much of the candle's range is body vs. wick) and close position (where the close sits within the range). Classifies the candle as STRONG BULLISH, STRONG BEARISH, BULLISH, BEARISH, or NEUTRAL. Also calculates the breakout distance from the channel in ATR multiples.

Why it matters to you: A breakout with a 70% body and a close at the extreme high is a different signal than a breakout with a 20% body and a long upper wick. This engine distinguishes them. The quality score (MARGINAL to EXCELLENT) synthesizes candle quality, distance, and confirmation into one readable metric.

Without it: You'd treat a weak, wicky breakout the same as a strong, decisive one. You'd get chopped up.

PHASE 5: TREND & STRUCTURE SCORING

What it does: Runs two independent trend assessments — General Trend (default: 50-bar lookback) and Current Trend (default: 20-bar lookback). Each assessment combines EMA alignment (fast vs. slow), EMA slope normalized by ATR, ADX with directional indicators, market structure (higher highs/lows vs. lower highs/lows), and persistence (percentage of bars closing above/below the fast EMA). The result is a 0-100 score, a direction, a state (STRONG UPTREND to STRONG DOWNTREND), a confidence level, a momentum reading, a phase, and a structure classification.

Why it matters to you: You see both the forest and the trees. The General Trend tells you the broader context. The Current Trend tells you what's happening right now. When they align, you have conviction. When they diverge, you have a correction or a developing reversal.

Without it: You'd trade breakouts without knowing if they're with or against the broader trend. You'd fight the market.

PHASE 6: BREAKOUT VALIDATION

What it does: After a breakout is stored, the engine tracks every subsequent bar. It detects:

  • Confirmation: Price held outside the channel for N bars (default: 1).

  • Retest: Price returned to within 0.25 ATR of the channel and held.

  • False breakout: Price closed back inside the channel.

  • Sweep: A wick exceeded the channel by 35%+ of the candle's range, then reversed.

Why it matters to you: Most breakouts fail. This engine tells you how they fail — and whether the failure is a clean rejection (false breakout) or a liquidity grab (sweep). That distinction changes how you manage your trade.

Without it: You'd see a breakout, enter, and get stopped out without understanding why. You'd never learn to distinguish between a genuine failure and a stop hunt.

PHASE 7: DASHBOARD & ALERTS

What it does: Renders the entire analytical output as a clean, color-coded dashboard. Optional alerts notify you when a new breakout is detected, with the direction, status, post-breakout state, and net change.

Why it matters to you: You don't have to interpret raw numbers. The dashboard tells you what matters. The alerts keep you informed without staring at the screen.

Without it: You'd have to manually check every symbol and timeframe. You'd miss breakouts while looking elsewhere.

THE PROOF STACK

No repainting. Every signal is locked on bar close. The breakout bar cannot move its own threshold. What you see in history is what you would have seen in real time.

Works on any timeframe, any symbol, any account type. Forex, indices, crypto, commodities. M1 to MN. The ATR normalization ensures the readings are comparable across instruments.

Zero external dependencies. No DLLs. No web requests. No third-party libraries. Everything runs inside MT5.

Built-in hysteresis. The volatility state machine uses a 3% hysteresis band to prevent state-flipping when readings hover near thresholds. You won't see "COMPRESSION" and "BALANCED" alternating every bar.

ATR normalization throughout. Width/ATR ratio, breakout distance in ATR, retest distance in ATR, EMA slope in ATR — every metric that could be distorted by symbol volatility is normalized.

Persistent breakout tracking. The engine scans up to 3,000 bars to find the most recent breakout. It stores it with absolute bar indexing and tracks its lifecycle. You always have context.

Configurable everything. Over 40 parameters organized into logical groups. Defaults are optimized out of the box. Tweak only if you want to match your specific style.

Optional alerts. Popup notifications and sound alerts when a new breakout is detected. Primed on attachment so historical events don't trigger false notifications.

Breakout chart label. A text label appears on the chart at the breakout bar, showing direction and status. Optional — you can turn it off.

MT5 native. Built specifically for MetaTrader 5 — not a ported MT4 version. Uses the full MT5 indicator architecture.

USE CASES — WHEN THIS ENGINE EARNS ITS KEEP

The Compression Coil. The market has been ranging for three days. The MARKET STATE panel flashes "EXTREME COMPRESSION" with positive acceleration. The GENERAL TREND panel shows a bullish structure. The CURRENT TREND panel shows neutral pressure. You know a violent move is loading. The BREAKOUT INTELLIGENCE panel tells you the moment it fires — and whether the breakout candle is strong or weak. You enter with confidence because you saw the coil before the spring.

The Failed Breakout Avoidance. Price closes above the upper band. Your old self would have entered immediately. But the BREAKOUT INTELLIGENCE panel shows "WEAK" quality — the candle has a 25% body and a long upper wick. The POST-BREAKOUT panel shows "RANGING" with 40% efficiency. You stay flat. Two bars later, the status flips to "FALSE BREAKOUT." You saved yourself a stop-out.

The Retest Entry. Price breaks out bullishly. The status reads "BREAKOUT" — not yet confirmed. You wait. Two bars later, price pulls back to within 0.25 ATR of the channel. The status flips to "RETESTED." The POST-BREAKOUT panel shows "BULLISH" with 80% efficiency. You enter on the retest with a tight stop just below the channel. This is the highest-probability entry — and the engine told you exactly when it happened.

The Sweep Reversal. Price spikes below the lower band, then closes back inside. The status reads "SWEPT." The BREAKOUT INTELLIGENCE panel shows a bearish direction, but the POST-BREAKOUT panel shows "BULLISH" progression. You recognize this as a liquidity grab — a stop hunt. You enter long against the sweep, targeting the upper channel. The engine gave you the confidence to take the other side of the trap.

The Trend Alignment Entry. The GENERAL TREND panel shows "BULLISH | STRONG UPTREND." The CURRENT TREND panel shows "BULLISH | ESTABLISHED UPTREND." The MARKET STATE panel shows "BALANCED" volatility. The FINAL BIAS badge reads "BULLISH" with a "LONG" tag. Price breaks out bullishly. The breakout quality reads "EXCELLENT." This is the highest-conviction setup the engine can produce. You size up.

The Divergence Warning. The GENERAL TREND panel shows "BULLISH." The CURRENT TREND panel shows "BEARISH." The FINAL ASSESSMENT paragraph reads: "The broader structure is bullish, but the current trend has turned bearish. This indicates an active correction or developing reversal." You're holding a long position. You tighten your stop. The engine warned you before the reversal became obvious.

THE WORKFLOW — FROM CHART OPEN TO TRADE DECISION

Step 1: Attach the indicator. Drag it onto your MT5 chart. The dashboard appears in your chosen corner. The engine begins analyzing on the next bar open.

Step 2: Read the FINAL BIAS badge. This is your bottom line. BULLISH, BEARISH, or something more nuanced. It takes one second.

Step 3: Check the MARKET STATE panel. Is volatility compressed, balanced, or expanded? Is it accelerating or decelerating? This tells you what kind of move to expect.

Step 4: Check the BREAKOUT INTELLIGENCE panel. Is there an active breakout? What's its status? Its quality? Its distance from the channel? If there's no breakout, you wait.

Step 5: Check the POST-BREAKOUT panel. If there's an active breakout, what's the follow-through? Is it bullish, bearish, or ranging? What's the efficiency? This tells you if the breakout has legs.

Step 6: Make your decision. If the bias aligns with the breakout direction, the quality is strong, and the post-breakout response is efficient — you have a trade. If not, you wait. The engine gives you the confidence to act — or the discipline to stay flat.

Total time: under 30 seconds. No math. No cross-referencing. No guesswork.

PARAMETER OVERVIEW — SIMPLE, LOGICAL, FORGIVING

All parameters are organized into seven groups. Defaults are optimized out of the box. You can trade this indicator for months without changing a single setting. But if you want to tune it to your style, here's what each group controls.

Phase 1 — Bollinger. The core band settings. Period (default: 20), standard deviations (default: 2.0). Adjust these if you want faster or slower bands.

Phase 2 — Volatility. The width lookback (default: 100), ATR period (default: 14), velocity and acceleration bars (default: 3 each), width smoothing (default: 3), and the percentile thresholds for compression and expansion states. The hysteresis setting (default: 3%) prevents state-flipping.

Phase 3 — Breakout. Minimum breakout distance in ATR (default: 0.05), strong breakout threshold (default: 0.50), confirmation bars (default: 1), retirement rules, and scan lookback (default: 3,000 bars). Keep Last Breakout Visible (default: true) ensures the most recent event stays in the panels even after it ages out.

Phase 4 — Intelligence. Strong body percentage (default: 60%), strong close percentage (default: 75%), ranging move threshold (default: 0.10 ATR), directional majority (default: 60%), and directional efficiency (default: 50%). These control how the engine scores breakout candles and post-breakout movement.

Phase 5 — Trend. General trend lookback (default: 50), current trend lookback (default: 20), slope lookback (default: 10), neutral slope threshold (default: 0.02 ATR), ADX period (default: 14), fast EMA (default: 20), slow EMA (default: 50), and ADX thresholds for trend and strong trend (default: 20 and 30).

Phase 6 — Validation. Retest ATR distance (default: 0.25) and sweep wick percentage (default: 35%). These control how the engine detects retests and liquidity sweeps.

Phase 7 — Dashboard. Show/hide dashboard, corner placement, panel width, font size, offsets, insight wrap characters, breakout label visibility, and alert enable/disable.

Default settings are optimized out of the box. Tweak only if you want to match your specific style.

THE UPGRADE PATH — FOR TRADERS WHO WANT TO GO FURTHER

Bollinger Market & Trend Intelligence is a complete standalone system. But for you — if you want to go further — it pairs naturally with complementary tools.

If you trade breakouts across multiple symbols, consider adding a multi-symbol scanner to your workflow. It alerts you when any symbol on your watchlist enters EXTREME COMPRESSION — so you can focus on the charts that matter.

If you want to automate your breakout entries, consider a trade management EA that can read the indicator's output and execute with predefined risk parameters. The engine's non-repainting signals make it suitable for automation.

These are not required. They are simply the next logical step for you if you want to build a complete ecosystem around this analytical core.

THE CLOSE — WHAT YOU DO NEXT

You've seen what this engine does.

It reads the completed Bollinger Bands from the bar before the breakout — so the breakout bar can't move its own threshold. It scores volatility context, candle quality, post-breakout efficiency, and trend alignment. It tells you whether a breakout is worth trading — before you risk a single dollar.

And when you buy, you don't just get the indicator.

You get the complete user guide — free.

Every panel explained. Every reading decoded. Every parameter documented. Plus worked examples showing you exactly how to read the dashboard in live market conditions.

You'll know what "EXTREME COMPRESSION releasing strongly" means for your next trade. You'll know why a "SWEPT" signal is different from a "FALSE BREAKOUT." You'll know when to trust an "EXCELLENT" quality score — and when to stay flat.

No guesswork. No learning curve. You attach it, you read the guide, you understand it.

The market won't wait for you to feel ready. Breakouts happen whether you're prepared or not. The only question is whether you'll have the context to act on them.

Click "Buy" to add Bollinger Market & Trend Intelligence to your MT5 today — and get the full user guide instantly. Or download the free demo and test it on your own charts before committing. See the dashboard. Read the signals. Watch how it scores breakouts in real time.

Lifetime updates. Direct developer support. Zero risk to try.

Bollinger Breakout Intelligence | Volatility Compression Detector | Multi-Timeframe Trend Analysis | No Repaint Dashboard | Post-Breakout Efficiency Scoring | MT5 Indicator


Produtos recomendados
RBreaker
Zhong Long Wu
RBreaker Gold Indicators é uma estratégia de negociação intradiária de curto prazo para futuros de ouro que combina duas abordagens: o seguimento de tendência e as reversões intradiárias. Ela permite capturar lucros durante mercados em tendência e também realizar lucros oportunamente e operar na direção oposta quando o mercado se reverte. Esta estratégia foi classificada por 15 anos consecutivos entre as dez estratégias de negociação mais lucrativas pela revista americana Futures Truth. Ela pos
Limitless MT5
Dmitriy Kashevich
Limitless MT5 is a universal indicator suitable for every beginner and experienced trader. works on all currency pairs, cryptocurrencies, raw stocks Limitless MT5 - already configured and does not require additional configuration And now the main thing Why Limitless MT5? 1 complete lack of redrawing 2 two years of testing by the best specialists in trading 3 the accuracy of correct signals exceeds 80% 4 performed well in trading during news releases Trading rules 1 buy signal - the ap
Fibaction
Abdelkhalek Orabi
Indicator Name: Fibaction – price action candle Detector Description: Fibo Signal Boxes is a powerful Smart Money Concept (SMC)-inspired indicator that auto-detects price action candles. bullish hammers and shooting stars, then draws precise Fibonacci entry zones and multiple take-profit levels directly on the chart. as for the SL personally i use 40 pips rules  Key Features: Detects bullish hammer and shooting star reversal candles. Automatically draws Fibonacci entry and TP boxes. as
Unlock the Market's Hidden Blueprint with Advanced Pattern Recognizer Tired of staring at charts, struggling to spot high-probability trading opportunities? What if you had a professional analyst scanning the markets 24/7, drawing perfect trendlines, and calculating precise profit targets for you? Introducing Advanced Pattern Recognizer for MetaTrader 5 – Your Automated Technical Analysis Powerhouse. This isn't just another indicator. It's a sophisticated algorithmic engine designed to do the he
WanaScalper
Isaac Wanasolo
1 (1)
A scalping indicator based on mathematical patterns, which on average gives signals with relatively small SL, and also occasionally helps to catch big moves in the markets (more information in the video) This indicator has three main types of notifications: The first type warns of a possible/upcoming signal on the next bar The second type indicates the presence of a ready signal to enter the market/open a position The third type is for SL and TP levels - you will be notified every time price re
Your Trend Friend
Luigi Nunes Labigalini
5 (1)
A tendência é sua amiga! Veja a cor do indicador e faça suas operações nessa direção. Ele não repinta. Ou seja, depois que cada candle se fecha, a cor dele é definitiva e não irá se alterar. Você pode focar em movimentos mais curtos e rápidos ou tendências mais longas, basta testar o que melhor se encaixa no seu operacional de acordo com o ativo e tempo gráfico usado. Altere o parâmetro de entrada "Length" e o indicador irá se adaptar automaticamente (quanto maior ele for, maior a tendência an
IVISTscalp5
Vadym Zhukovskyi
5 (6)
[iVISTscalp5]: Um laboratório para estudar o comportamento do mercado através do tempo TLV Framework | Liquidity Activation Points ⸻ Descrição Geral iVISTscalp5 é um indicador multinível de timings e estrutura de preços desenvolvido dentro do projeto VISTmany. O sistema prevê o tempo, a direção e o alcance do movimento através dos Liquidity Activation Points (timings). O indicador iVISTscalp5 pode ser utilizado com os parâmetros padrão em qualquer instrumento financeiro. ⸻ Valor Prático
CosmiCLab SMC FIBO CosmiCLab SMC FIBO is a professional trading indicator designed for traders who use Smart Money Concepts (SMC), market structure analysis and Fibonacci retracement levels. The indicator automatically detects market swings and builds Fibonacci levels based on the latest impulse movement. It also identifies market structure changes such as BOS (Break of Structure) and CHOCH (Change of Character), helping traders understand the current market direction. CosmiCLab SMC FIBO also pr
PatternScope — Multi-Pattern Recognition for MT5 PatternScope is a multi-pattern recognition indicator for MetaTrader 5. It scans price action for classic chart patterns, confirms breakouts, and draws clear   Entry, Stop Loss and Take Profit   levels. A compact dashboard shows the latest pattern, bias and Risk:Reward. Patterns:   Double Top/Bottom, Triple Top/Bottom, Head and Shoulders (and inverted), Bullish & Bearish Flag, Pennant, Rising & Falling Wedge, Triangle, Rectangle, Cup and Handle —
Liquidity Order Blocks MT5
Johan Adrian Nieto Resendiz
Liquidity Order Blocks MT5 Liquidity Order Blocks MT5 is a professional visual indicator for MetaTrader 5 designed to help traders identify and monitor potential bullish and bearish liquidity areas directly on the chart. The indicator detects pivot-based order block zones and displays each zone with a structured visual breakdown of estimated bullish volume, bearish volume, relative strength and delta. Its purpose is to make liquidity areas easier to read, compare and monitor during market analys
PipFinite Trend PRO MT5
Karlo Wilson Vendiola
4.84 (560)
Breakthrough Solution For Trend Trading And Filtering With All Important Features Built Inside One Tool! Trend PRO's smart algorithm detects the trend, filters out market noise and gives entry signals with exit levels. The new features with enhanced rules for statistical calculation improved the overall performance of this indicator. Important Information Revealed Maximize the potential of Trend Pro, please visit www.mql5.com/en/blogs/post/713938 The Powerful Expert Advisor Version Automatin
Tma Poc Gold
Ignacio Agustin Mene Franco
POC + TMA SCALPER GOLD - Expert Advisor Professional DESCRIPTION: Automated trading system designed specifically for XAU/USD, combining Point of Control (POC) with Triangular Moving Average (TMA) to identify high-volume and trending zones. It uses advanced risk management with dynamic trailing stops and an intelligent grid system. TECHNICA
FFx Patterns Alerter gives trade suggestions with Entry, Target 1, Target 2 and StopLoss .... for any of the selected patterns (PinBar, Engulfing, InsideBar, OutsideBar) Below are the different options available: Multiple instances can be applied on the same chart to monitor different patterns Entry suggestion - pips to be added over the break for the entry 3 different options to calculate the SL - by pips, by ATR multiplier or at the pattern High/Low 3 different options to calculate the 2 TPs -
Divergent Stochastic Filter II Catch Reversals Early, Filter Noise, Trade with Confidence The Edge: Why This Stochastic is Different  Every trader knows the Stochastic oscillator. But knowing when to trust its signals, that's the real challenge. The Divergent Stochastic Filter II transforms this classic indicator into a precision reversal detection system by adding critical elements: divergence intelligence, signal filtering and exhaustion detection.  While standard Stochastic oscillators fire s
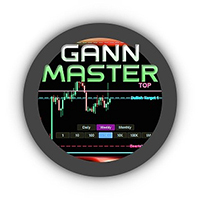
Níveis lendários de William Gann em um indicador MT5 totalmente automatizado. O GANN Master identifica zonas-chave onde o preço tem maior probabilidade de reverter ou continuar sua tendência, com base em dados diários, semanais e mensais. Recursos principais: Botões de período com um clique: clique em Daily, Weekly ou Monthly para traçar instantaneamente as zonas do dia, da semana ou do mês atuais Modos Automático e Manual • Automático: o GANN Master calcula todos os níveis para você, sem neces
Structure King AI Signal Structure King AI Signal is a professional MetaTrader 5 trading indicator designed to help traders analyze market structure, trend direction, multi-timeframe confirmation and trade management from one clean dashboard. Key Features • Market Structure & Trend Analysis • BUY / SELL Signals • Multi-Timeframe (HTF) Confirmation • Entry Price Levels • Dynamic Stop Loss (SL) • TP1 / TP2 / TP3 Levels • ATR Volatility Analysis • ADX Trend Strength Filter • Adaptive Market Filter
MarketMagnet
Kelly Adediran Raymond
Are you ready to take your trading journey to new heights? Look no further than MarketMagnet, this groundbreaking indicator designed to propel your trading success with excitement and accuracy. Powered by the convergence of Momentum and CCI (Commodity Channel Index), MarketMagnet equips traders with the ultimate tool to determine direction and entry prices for a wide range of recommended currency pairs and instruments. It is designed for traders seeking to scalp for a few pips on lower timeframe
RVE Echo Indicator MT5 — Rejection Velocity Echo RVE Echo Indicator is a custom MetaTrader 5 technical indicator designed to detect abnormal price rejection, sharp velocity changes, and possible reversal zones in the market. RVE stands for Rejection Velocity Echo . The indicator studies how strongly price moves compared to its recent rejection behavior, then highlights moments where the current price movement appears unusually aggressive. This can help traders identify possible exhaustion, rejec

Descrição do Indicador As linhas horizontais no gráfico alternam entre linhas sólidas e tracejadas , representando regiões de interesse do mercado identificadas a partir de regiões de topos e fundos em diferentes períodos gráficos, buscando criar confluências entre diferentes tempos . O indicador foi desenvolvido para auxiliar nos estudos de cada participante , proporcionando liberdade para que o usuário possa combinar as informações apresentadas com seu próprio sistema de análise e tomada de de
GDS Renko Pip ST Chart - Pip-Based Renko Chart Indicator for MetaTrader 5 GDS Renko Pip ST Chart is a pip-based Renko chart indicator for MetaTrader 5. It helps traders build and study cleaner Renko price movement using a practical fixed pip or point-based brick structure. This tool is designed as a Renko chart foundation for manual analysis. It does not predict the market, does not generate buy or sell signals and does not decide whether a trade should be opened. Renko EDGE EA Golden Delta | A
The Rainbow Dragon Indicator by Quant Atlas Creator:  https://www.quant-atlas.com/ The Rainbow Dragon is a composite signal engine that aggregates the seven Rainbow indicators — Blue, Green, Indigo, Red, Violet, Yellow, and Orange — into a single confluence-based reading. Rather than relying on any one model, it treats each Rainbow component as an independent voter and fires only when enough of them agree, giving you a diversified, multi-method read on the market instead of a single point of vie
SMC Indicator BOS & CHoCH analyze market structure using Smart Money Concepts The indicator combines BOS (Break of Structure), CHoCH (Change of Character), Fair Value Gaps (FVG), Liquidity Sweep logic and ATR filtering to provide a structured view of market movements and potential trading opportunities. The indicator automatically identifies swing highs and swing lows and monitors structural breaks in the market. BOS (Break of Structure) identifies potential continuation of the current market st
Histograma de Rendimento L&S Caicai Aviso Importante: Este indicador é uma ferramenta integrante do robô automatizado EA Caicai Long and Short Pair Trading . Este indicador exibe visualmente o desvio percentual (Yield %) do spread atual de um par em relação à sua própria média histórica. É excelente para visualizar rapidamente o potencial financeiro bruto de uma distorção. Principais Funcionalidades: Visualização em Percentual: Entenda facilmente o tamanho da distorção em termos percentuais. Múl
STRICTLY FOR BOOM INDEX ONLY!!!!! Here I bring the Maximum Trend Arrows OT1.0 MT5 indicator. This indicator is made up of a combination of different trend indicators for entries and exits, for entries an orange arrow will paint on the chart below the current market and a red flag for closing of trades and it produces buy arrows only. When the orange arrow appears, it will appear along with it's sound to notify you. The 1H timeframe is recommended, don't use it anywhere else than on the 1H timefr
TREND SNIPER PORTFOLIO MT5 Trend Sniper Portfolio is a fully automated, institutional-grade trading algorithm designed specifically to capture high-probability trend reversals and momentum setups on fast-moving indices, with a primary optimization for the proprietary FX Vol 20 (Weltrade Index) . Unlike traditional high-risk grid or martingale systems that drain account equity during prolonged trends, this algorithm operates under a strict mathematical model built on structural price actio
Cycle Projection Pro is a cyclical analysis indicator for MetaTrader 5, designed for the Daily timeframe. It identifies and projects recurring price cycles forward in time, helping you estimate when — not how much — the market may be approaching a turning point. How it works The indicator sums six harmonic cycles with explicit periods — Weekly, Biweekly, Monthly, Quarterly, Semiannual, Annual — each independently adjustable and can be turned on or off. Their combination produces a composite wav
HAS RSI Signal — Indicador de Tendência Profissional com Cálculo de SL/TP O HAS RSI Signal é uma ferramenta de negociação poderosa que combina clássicos comprovados com algoritmos modernos de filtragem de ruído. O indicador analisa o mercado através das velas Heiken Ashi Smoothed (HAS) e do oscilador RSI , fornecendo sinais de entrada claros em momentos de reversão de tendência ou na saída de zonas de sobrecompra/sobrevenda. Principais Vantagens: Filtragem Dupla: O uso do Heiken Ashi Smoothed pe
PipFinite Exit EDGE MT5
Karlo Wilson Vendiola
4.88 (32)
Did You Have A Profitable Trade But Suddenly Reversed? In a solid strategy, exiting a trade is equally important as entering. Exit EDGE helps maximize your current trade profit and avoid turning winning trades to losers. Never Miss An Exit Signal Again Monitor all pairs and timeframes in just 1 chart www.mql5.com/en/blogs/post/726558 How To Trade You can close your open trades as soon as you receive a signal Close your Buy orders if you receive an Exit Buy Signal. Close your Sell orders if
Ultra AS MT5
Yaroslav Varankin
3 (2)
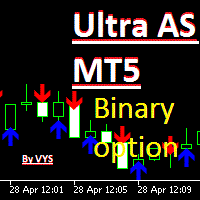
The indicator is designed for binary options trading. The "period" parameter can be adjusted to fit your trading strategy, allowing you to customize the number and quality of signals. A red arrow pointing down indicates a sell signal, while a blue arrow pointing up indicates a buy signal. Recommended expiration time is one candle. You can enter a trade either when the signal appears or on the next candle. Attention: the signal may sometimes disappear on the current candle, so it's important to
CRT Candle Range Theory HTF MT5.   Ultimate CRT Indicator: Advanced ICT Concepts and Malaysian SnR Trading System Master the Market Maker's Footprints with the Most Advanced Candle Range Theory Indicator Unlock the true power of  Smart Money Concepts (SMC)  and trade precisely like the institutions with the  Ultimate CRT Indicator . Built exclusively for serious traders, this indicator automates the highly effective  Candle Range Theory (CRT) , a core pillar of  ICT Concepts (Inner Circle Trader
Os compradores deste produto também adquirem
Este produto foi atualizado para o mercado de 2026 e otimizado para as versões mais recentes do MT5. AVISO DE ATUALIZAÇÃO DE PREÇO: Smart Trend Trading System está atualmente disponível por $99 . O preço aumentará para $199 após as próximas 30 compras . OFERTA ESPECIAL: Após comprar o Smart Trend Trading System, envie-me uma mensagem privada para receber o Smart Universal EA GRÁTIS e transformar seus sinais do Smart Trend em operações automatizadas. Smart Trend Trading System é um sistema de tr
Trend Sniper X
Sarvarbek Abduvoxobov
4.88 (32)
Trend Sniper X é um indicador de acompanhamento de tendência para múltiplos tempos gráficos no MetaTrader 5 que ajuda os traders a identificar a direção da tendência e potenciais pontos de reversão com clareza e precisão. para MT4: https://www.mql5.com/en/market/product/193245 Informações sobre o preço: O preço atual é promocional e está sujeito a alterações à medida que novas atualizações e funcionalidades forem lançadas. Oferta Bônus: Para obter o Auto-Trade Assistant EA GRATUITO para este in
Neuro Poseidon MT5
Daria Rezueva
4.79 (53)
Neuro Poseidon is a new indicator by Daria Rezueva. It combines precise trading signals with adaptive TP/SL levels - creating best possible trades as a result! Message me and get  Neuro Poseidon Assistant  as a gift to automize your trading process! What makes it stand out? 1. Proven profitability on all assets and timeframes 2. Only confirmed BUY and SELL signals present on the chart 3. Adaptive TP & SL levels generated by the software for each trade 4. Easy to understand - suitable for al
SuperScalp Pro
Van Minh Nguyen
4.64 (33)
SuperScalp Pro - Professional Multi-Layer Confluence Scalping System SuperScalp Pro é um indicador avançado de scalping que aprimora o Supertrend clássico com vários filtros inteligentes de confirmação. Ele ajuda a identificar oportunidades de Buy/Sell com maior probabilidade, reduzindo significativamente os sinais falsos. Setas claras de Buy e Sell aparecem diretamente no gráfico, enquanto os níveis de Stop Loss e Take Profit baseados em ATR são calculados automaticamente em tempo real. Após a
Welcome to ENTRY IN THE ZONE AND SMC MULTI TIMEFRAME Entry In The Zone and SMC Multi Timeframe is a real-time market analysis tool based on Smart Money Concepts (SMC), designed to analyze market structure, price direction, and key trading zones. It supports both Single-Timeframe Analysis and Multi-Timeframe Analysis, providing a clearer view of the overall market structure across multiple timeframes, with real-time BUY / SELL signals that do not repaint. It is designed to help filter trading opp
M1 Sniper MT5
Oleg Rodin
5 (7)
O   M1 SNIPER   é um sistema indicador de negociação fácil de usar. É um indicador de seta projetado para o período M1. O indicador pode ser usado como um sistema independente para scalping no período M1 e pode ser usado como parte do seu sistema de negociação existente. Embora este sistema de negociação tenha sido projetado especificamente para negociação no M1, ele também pode ser usado em outros períodos. Originalmente, desenvolvi este método para negociar XAUUSD e BTCUSD. Mas considero-o úti
SPECIAL OFFER: Buy UNIX Scalper. Get Smart Universal Expert Advisor FREE. Purchase UNIX Scalper for MT5 and receive Smart Universal Expert Advisor at no additional charge to automate your UNIX Scalper signals. One $99 purchase. Your indicator plus a free automation EA. After purchasing, send me a private message on MQL5 to claim your EA.  UNIX Scalper — Multi-Market Analysis, Trade Planning and Automation Find the setup. See the plan. Choose how to trade it. UNIX Scalper brings market analysis,
A lenda está de volta: Entry Points Pro 10. O relançamento do lendário indicador que se manteve por 3 anos no Top-3 do MQL5 Market. Centenas de avaliações entusiasmadas (589 nas duas versões), milhares de traders operam com ele todos os dias, 31.000+ downloads da versão demo   MT4+MT5 . Li cada avaliação de vocês ao longo de cinco anos — e, em vez de promessas, coloquei as respostas dentro da versão 10. Do autor que está no mercado desde 1999 e valoriza a honestidade, a própria reputação e os se
Reversion King Indicator
Eugen-alexandru Zibileanu
5 (7)
Um novo Rei chegou à cidade - Indicador + Gestão de Ordens (TP1 + TP2 + TP3) + Enviador opcional de sinais para Telegram INCLUÍDO (GRÁTIS) (SISTEMA COMPLETO DE TRADING e SINAIS) Nosso melhor EA para Ouro: Gold Slayer Este indicador inclui uma estratégia avançada, um sistema de trading com gestão de ordens personalizável e um sistema de reversão à média que combina extensões de envelopes, apoiado por múltiplos filtros inteligentes de confirmação, como o RSI, para capturar entradas de reversão de
Atomic Analyst MT5
Issam Kassas
4.44 (57)
Este produto foi atualizado para o mercado de 2026 e otimizado para as versões mais recentes do MT5. AVISO DE ATUALIZAÇÃO DE PREÇO: Atomic Analyst está atualmente disponível por $99 . O preço aumentará para $199 após as próximas 30 compras . OFERTA ESPECIAL: Após comprar o Atomic Analyst, envie-me uma mensagem privada para receber o Smart Universal EA GRÁTIS e transformar seus sinais do Atomic Analyst em operações automatizadas. Atomic Analyst é um indicador de trading de Price Action sem repa
Gann Made Easy   é um sistema de negociação Forex profissional e fácil de usar, baseado nos melhores princípios de negociação usando a teoria do sr. W. D. Gann. O indicador fornece sinais precisos de COMPRA e VENDA, incluindo níveis de Stop Loss e Take Profit. Você pode negociar mesmo em movimento usando notificações PUSH. Entre em contato comigo após a compra para receber instruções de negociação e ótimos indicadores extras gratuitamente! Provavelmente você já ouviu muitas vezes sobre os método
O UZFX {SSS} Scalping Smart Signals v5.0 MT5 é um indicador de negociação de alto desempenho, sem repintura, concebido para scalpers, day traders e swing traders que exigem sinais precisos e em tempo real em mercados em rápida evolução. Desenvolvido pela (UZFX-LABS), este indicador combina a análise da ação do preço, a confirmação de tendências e a filtragem inteligente para gerar sinais de compra e venda de alta probabilidade, sinais de alerta e oportunidades de continuação de tendências em tod
Scalper Vault   é um sistema profissional de escalpelamento que fornece tudo o que você precisa para um escalpelamento bem-sucedido. Este indicador é um sistema de negociação completo que pode ser usado por comerciantes de forex e opções binárias. O período de tempo recomendado é M5. O sistema fornece sinais de seta precisos na direção da tendência. Ele também fornece sinais superiores e inferiores e níveis de mercado Gann. Os indicadores fornecem todos os tipos de alertas, incluindo notificaçõe
FiboSniper Pro
Van Minh Nguyen
5 (2)
FiboSniper Pro – Multi-Filter Fibonacci System with Auto SL/TP and Control Panel FiboSniper Pro é um indicador técnico que combina Fibonacci Envelopes dinâmicos com vários filtros de confirmação para gerar sinais seletivos de Buy e Sell. Os níveis de Fibonacci são calculados com base em Moving Average e ATR e, em seguida, filtrados por ADX, EMA, RSI, ATR, Volume, Time e estrutura das velas. O indicador exibe diretamente no gráfico os níveis automáticos de Stop Loss e Take Profit baseados em ATR,
Divergence Bomber
Ihor Otkydach
4.89 (94)
Cada comprador deste indicador recebe adicionalmente, e de forma gratuita: A ferramenta exclusiva "Bomber Utility", que acompanha automaticamente cada operação, define os níveis de Stop Loss e Take Profit e fecha operações de acordo com as regras da estratégia; Arquivos de configuração (set files) para ajustar o indicador em diferentes ativos; Set files para configurar o Bomber Utility nos modos: "Risco Mínimo", "Risco Balanceado" e "Estratégia de Espera"; Um vídeo tutorial passo a passo que a
Currency Strength Wizard   é um indicador muito poderoso que fornece uma solução completa para uma negociação bem-sucedida. O indicador calcula o poder deste ou daquele par forex usando os dados de todas as moedas em vários intervalos de tempo. Esses dados são representados em uma forma de índice de moeda fácil de usar e linhas de energia de moeda que você pode usar para ver o poder desta ou daquela moeda. Tudo o que você precisa é anexar o indicador ao gráfico que deseja negociar e o indicador
Gem SIGNAL
Shengzu Zhong
5 (1)
GEM Signal Pro GEM Signal Pro é um indicador seguidor de tendência para MetaTrader 5, desenvolvido para traders que desejam sinais mais claros, setups mais estruturados e uma gestão de risco mais prática diretamente no gráfico. Em vez de mostrar apenas uma seta simples, o GEM Signal Pro ajuda a apresentar a ideia completa da operação de forma mais clara e fácil de entender. Quando as condições são confirmadas, o indicador pode mostrar o preço de entrada, o stop loss e os alvos de take profit no
ATSTRONG PRO: Indicador de Estrutura de Mercado e Rompimento Motor de Detecção de Rompimento | 5 Alvos TP Dinâmicos | Painel de Controle ao Vivo | Sem Repintura Preço de Lançamento Preço Atual: $59 — O preço aumenta em $10 após cada 10 vendas. ATSTRONG PRO é um indicador avançado de rompimento e estrutura de mercado institucional projetado para MetaTrader 5. Ele detecta pivôs de swing de alta probabilidade, identifica zonas agrupadas de acúmulo de suporte e resistência, e sinaliza Quebra de E
Power Candles MT5
Daniel Stein
4.73 (11)
Power Candles V3 - Indicador de força com auto-otimização O Power Candles V3 transforma a força da moeda e do instrumento num plano de negociação prático em todos os gráficos aos quais está associado. Em vez de se limitar a colorir as velas, executa uma otimização automática em tempo real em segundo plano e apresenta-lhe os melhores valores de Stop Loss, Take Profit e limiar de sinal para o símbolo em questão. Basta um clique para o adotar na negociação em tempo real — as linhas de entrada, Stop
Azimuth Pro
Ottaviano De Cicco
5 (7)
Azimuth Pro V2: Estrutura Fractal Sintética e Entradas Confirmadas para MT5 Visão geral Azimuth Pro é um indicador de estrutura swing multinível da Merkava Labs . Quatro camadas de swing aninhadas, VWAP ancorado em swings, detecção de padrões ABC, filtragem estrutural de três timeframes e entradas confirmadas em barra fechada — um gráfico, um fluxo de trabalho dos micro-swings aos macro-ciclos. Este não é um produto de sinais cegos. É um fluxo de trabalho baseado em estrutura para traders que v
Crystal Heikin Ashi Signals
Muhammad Jawad Shabir
5 (4)
Crystal Heikin Ashi Signals - Professional Trend & Signal Detection Indicator Advanced Heikin Ashi Visualization with Intelligent Signal System for Manual & Automated Trading Final Price: $149 ---------> Price goes up $10 after every 10 sales . Limited slots available — act fast . Overview Crystal Heikin Ashi Signals is a professional-grade MetaTrader 5 indicator that combines pure Heikin Ashi candle visualization with an advanced momentum-shift detection system. Designed for both manual traders
Trend Catcher ind mt5
Ramil Minniakhmetov
5 (18)
INDICADOR TREND CATCHER O Indicador Trend Catcher analisa os movimentos de preços do mercado, utilizando uma combinação de indicadores de análise de tendências adaptativos, proprietários e personalizados pelo autor. Identifica a verdadeira direção do mercado, filtrando o ruído de curto prazo e focando a força do momentum subjacente, a expansão da volatilidade e o comportamento da estrutura de preços. Utiliza também uma combinação de indicadores personalizados de suavização e filtragem de tendê
Crystal Quantum Pro
Muhammad Jawad Shabir
5 (3)
CRYSTAL QUANTUM PRO Institutional Signal & Trade Intelligence for MetaTrader 5 Final Price: 199 USD ----> Price goes up 10 USD after every 10 sales. Limited launch slots available, act fast. Most indicators give you an arrow and leave you alone. A naked arrow is a gamble. Winning consistently requires CONFLUENCE , a clear STOP and TARGET , and honest PROOF that the system works. Crystal Quantum Pro delivers all three in one clean, no-repaint package. Crystal Quantum Pro is a complete decision sy
FX Power MT5 NG
Daniel Stein
5 (33)
FX Power: Analise a Força das Moedas para Decisões de Negociação Mais Inteligentes Visão Geral FX Power é a sua ferramenta essencial para compreender a força real das principais moedas e do ouro em quaisquer condições de mercado. Identificando moedas fortes para comprar e fracas para vender, FX Power simplifica as decisões de negociação e revela oportunidades de alta probabilidade. Quer você prefira seguir tendências ou antecipar reversões usando valores extremos de Delta, esta ferramenta adap
FX Trend MT5 NG
Daniel Stein
5 (6)
FX Trend NG: A Nova Geração de Inteligência de Tendência Multi-Mercado Visão Geral FX Trend NG é uma ferramenta profissional de análise de tendências e monitoramento de mercado em múltiplos períodos de tempo. Permite compreender a estrutura completa do mercado em segundos. Em vez de alternar entre vários gráficos, você visualiza instantaneamente quais ativos estão em tendência, onde o momentum está enfraquecendo e onde existe alinhamento forte entre diferentes timeframes. Oferta de Lançamento
Btmm state engine pro
Garry James Goodchild
5 (4)
BTMM State Engine Pro by G-Labs — Beat The Market Maker indicator for MetaTrader 5. Asian session range, London and New York kill zones, level progression (L1/L2/L3), peak formation detection (PFH/PFL), entry signals, and a multi-pair scanner from one chart. Stop scanning charts one pair at a time. The State Engine tracks the BTMM daily cycle automatically — Asian box, room boundaries, level blocks, peak formations, and filtered entries — while the scanner dashboard shows level, peak status, d
M1 Quantum MT5
Hamed Dehgani
4.27 (11)
Sinais de Trading ao Vivo usando o M1 Quantum: Sinal   (Operação executada automaticamente pelo Quantum Trade Assistant , incluído gratuitamente neste produto.) Últimas Notícias : A versão 1.64 foi lançada. Agora, todas as operações têm um Stop Loss colocado atrás das zonas relevantes de Suporte/Resistência. A função Smart Close também foi aprimorada para aumentar o desempenho do EA nesta versão. Desde 9 de agosto, o sinal ao vivo está sendo executado na versão 1.64. Plano de Preços: Preço Atua
Precision Spike Detector
Francisco Mandomo Simbine
5 (2)
Precision Spike Detector V3 – Institutional-Grade AI Trading System Attention: The price increases by US$50 for every 10 purchases.  Final price: US$599 Precision Spike Detector V3   is a   state-of-the-art, institutional-grade market analysis system   for   MetaTrader 5 , designed to detect   high-probability market movements   in synthetic indices such as   Boom, Crash, GainX, and PainX . After purchase, send me a private message to receive the optimized configuration files,  the installation
Elliot Wave Pattern Hunter
Shingidzano Lesetedi
5 (1)
Elliott Wave Hunter - SMC Edition Elliott Wave Hunter identifies Elliott Wave 2 and Wave 5 setups and combines them with Smart Money Concepts to filter entries to high-probability zones only. Wave 2 signals mark continuation entries in the direction of the dominant Wave 1 impulse. The indicator waits for the retracement to confirm, locates an Order Block, Fair Value Gap or Liquidity Sweep zone within the impulse, then triggers only when price returns to retest that zone with a qualifying revers
ICT PO3 (Power of 3) AMD Protocol Framework Indicator True Time & Structure Integration   |  Non-Repainting | Real-Time  | Multi-Asset  | MT4 Version Available Full Setup Guide & Strategy Playbook: https://www.mql5.com/en/blogs/post/768683 MT4 Version: https://www.mql5.com/en/market/product/171742 Indicator Overview The ICT PO3 AMD Protocol Framework is a complete structural overlay for MetaTrader 5 that maps the True Daily Cycle directly onto your lower-timeframe execution chart. It project
Mais do autor
SWING VOLUME PROFILE Swing-Based Volume Profile + Fibonacci + RSI -------------------------------------------------- Auto-detected swings. Volume profile. Fibonacci. RSI. All-in-one. -------------------------------------------------- WHAT THIS INDICATOR DOES Swing Volume Profile (SVP) automatically detects structural swings and displays a volume profile for the most recent completed swing — with Fibonacci retracement and RSI overlay. No manual range selection needed. The indicator finds
FIXED RANGE VOLUME PROFILE Auto-Detecting Volume Profile Indicator with Real-Time Trendline Tracking -------------------------------------------------- FREE INDICATOR Volume distribution. Value areas. High-volume nodes. All from your trendline. -------------------------------------------------- WHAT THIS INDICATOR DOES Fixed Range Volume Profile (FRVP) displays volume distribution over a user-defined range — automatically detecting the latest trendline you draw or drag on the chart. No
SWING DETECTOR WITH RSI AND FIBONACCI Structural Swing Points + Fibonacci Retracement + RSI Overlay -------------------------------------------------- FREE INDICATOR Identify swings. See Fibonacci levels. Check RSI. All in one free indicator. -------------------------------------------------- WHAT THIS INDICATOR DOES This indicator automatically detects structural swing highs and lows using configurable depth and deviation filtering. It connects swings with trend lines, overlays standard
FREE
SWING HIGHS LOWS DETECTOR Swing Detection with Divergence Analysis -------------------------------------------------- Identify swings. Spot divergences. Trade with confluence. -------------------------------------------------- WHAT THIS INDICATOR DOES This indicator automatically detects structural swing highs and lows using configurable depth and deviation filtering. It then analyzes RSI and MACD to detect regular and hidden divergences between consecutive swings of the same type. Diver
FREE
SWING DETECTOR WITH RSI AND FIBONACCI Structural Swing Points + Fibonacci Retracement + RSI Overlay -------------------------------------------------- FREE INDICATOR Identify swings. See Fibonacci levels. Check RSI. All in one free indicator. -------------------------------------------------- WHAT THIS INDICATOR DOES This indicator automatically detects structural swing highs and lows using configurable depth and deviation filtering. It connects swings with trend lines, overlays standard
FREE
SWING HIGHS LOWS DETECTOR Swing Detection with Divergence Analysis -------------------------------------------------- Identify swings. Spot divergences. Trade with confluence. -------------------------------------------------- WHAT THIS INDICATOR DOES This indicator automatically detects structural swing highs and lows using configurable depth and deviation filtering. It then analyzes RSI and MACD to detect regular and hidden divergences between consecutive swings of the same type. Diver
FREE
FIXED RANGE VOLUME PROFILE Auto-Detecting Volume Profile Indicator with Real-Time Trendline Tracking -------------------------------------------------- Volume distribution. Value areas. High-volume nodes. All from your trendline. -------------------------------------------------- WHAT THIS INDICATOR DOES Fixed Range Volume Profile (FRVP) displays volume distribution over a user-defined range — automatically detecting the latest trendline you draw or drag on the chart. No manual range sel
ADAPTIVE SWING DENSITY HEAT MAP Structural Density + Participation Analysis -------------------------------------------------- See where price clusters. See where price fights. -------------------------------------------------- WHAT THIS INDICATOR DOES This indicator analyzes swing point density across price levels, then tracks how price actually interacts with each zone — measuring participation, acceptance, and rejection. The result is a heat map of structural zones, color-coded by den
CONSOLIDATION INTELLIGENCE PRO (MT4) Catch The Next Big Move! Stop Getting Chopped Up in Ranges. Map Institutional Order Density With 5-Tier Heatmaps. Up to 70% of retail losses happen inside messy consolidation ranges. Consolidation Intelligence Pro scans your MT4 charts for overlapping candle accumulation, measures body-to-wick density, and maps real-time 5-Tier Heatmaps directly over high-value consolidation zones. You instantly see where liquidity is stacked, where institutional orders are c
DONCHIAN MARKET & TREND INTELLIGENCE ENGINE (MT4) Multi-Factor Volatility, Trend Structure & Institutional Breakout Validation Dashboard MOST BREAKOUT INDICATORS ARE TRAPPING YOU. They Tell You THAT Price Broke Out. They Never Tell You IF It Will Hold. You have lived this scenario dozens of times: Price spends days coiling inside a tight Donchian band on your MT4 chart. A massive candle punches above the 20-period high. You buy the breakout — expecting momentum. Three candles later, price colla
BOLLINGER MARKET & TREND INTELLIGENCE — MT4 Edition STOP GUESSING WHICH BREAKOUTS ARE REAL. Most Bollinger breakouts fail. This engine tells you which ones won't — before you risk a single dollar. You get a quality score, a volatility percentile, and a post-breakout efficiency reading. All locked on bar close. No repainting. No guessing. The market gives you maybe three clean breakouts a week. This tool makes sure you catch them — and helps you avoid the twelve that would have stopped you out. T
FREE
ADAPTIVE SWING DENSITY HEAT MAP Structural Density + Participation Analysis See where price clusters. See where price fights. -------------------------------------------------- WHAT THIS INDICATOR DOES This indicator analyzes swing point density across price levels, then tracks how price actually interacts with each zone — measuring participation, acceptance, and rejection. The result is a heat map of structural zones, color-coded by density strength: - Red zones = Highest density (80-10
SWING VOLUME PROFILE Swing-Based Volume Profile + Fibonacci + RSI -------------------------------------------------- Auto-detected swings. Volume profile. Fibonacci. RSI. All-in-one. -------------------------------------------------- WHAT THIS INDICATOR DOES Swing Volume Profile (SVP) automatically detects structural swings and displays a volume profile for the most recent completed swing — with Fibonacci retracement and RSI overlay. No manual range selection needed. The indicator finds
CONSOLIDATION INTELLIGENCE PRO Catch The Next Big Move!Stop Getting Chopped Up in Ranges. Map Institutional Order Density With 5-Tier Heatmaps. Up to 70% of retail losses happen inside messy consolidation ranges. Consolidation Intelligence Pro scans your charts for overlapping candle accumulation, measures body-to-wick density, and maps real-time 5-Tier Heatmaps directly over high-value consolidation zones. You instantly see where liquidity is stacked, where institutional orders are concentrate
DONCHIAN MARKET & TREND INTELLIGENCE The Only Donchian Tool That Tells You WHY the Market Is Moving — Not Just Where Most Donchian indicators draw three lines and call it a day. You get an upper band. A middle band. A lower band. And when price pokes above the upper band, you're supposed to just... buy? That's not analysis. That's guessing with extra steps. THE PROBLEM EVERY DONCHIAN TRADER KNOWS You've seen it a hundred times. Price finally breaks above the 20-period high after days of compress
VWAP SNIPER REVERSAL PRO Stop Catching Falling Knives. Trade Institutional Exhaustion With Zero Repaint Guesswork. Most mean-reversion indicators force you to guess where a market will turn. VWAP Sniper Reversal Pro waits for institutional buyers or sellers to completely exhaust themselves BEFORE firing a single signal arrow. You get the exact entry, the exact structural turn, and absolute non-repainting confidence. If you are tired of watching "overbought" signals keep climbing while your accou
Filtro:
Sem comentários
Responder ao comentário