Lot Pulse
- Индикаторы
- Версия: 1.10

LotPulse — Traded Lots Dashboard
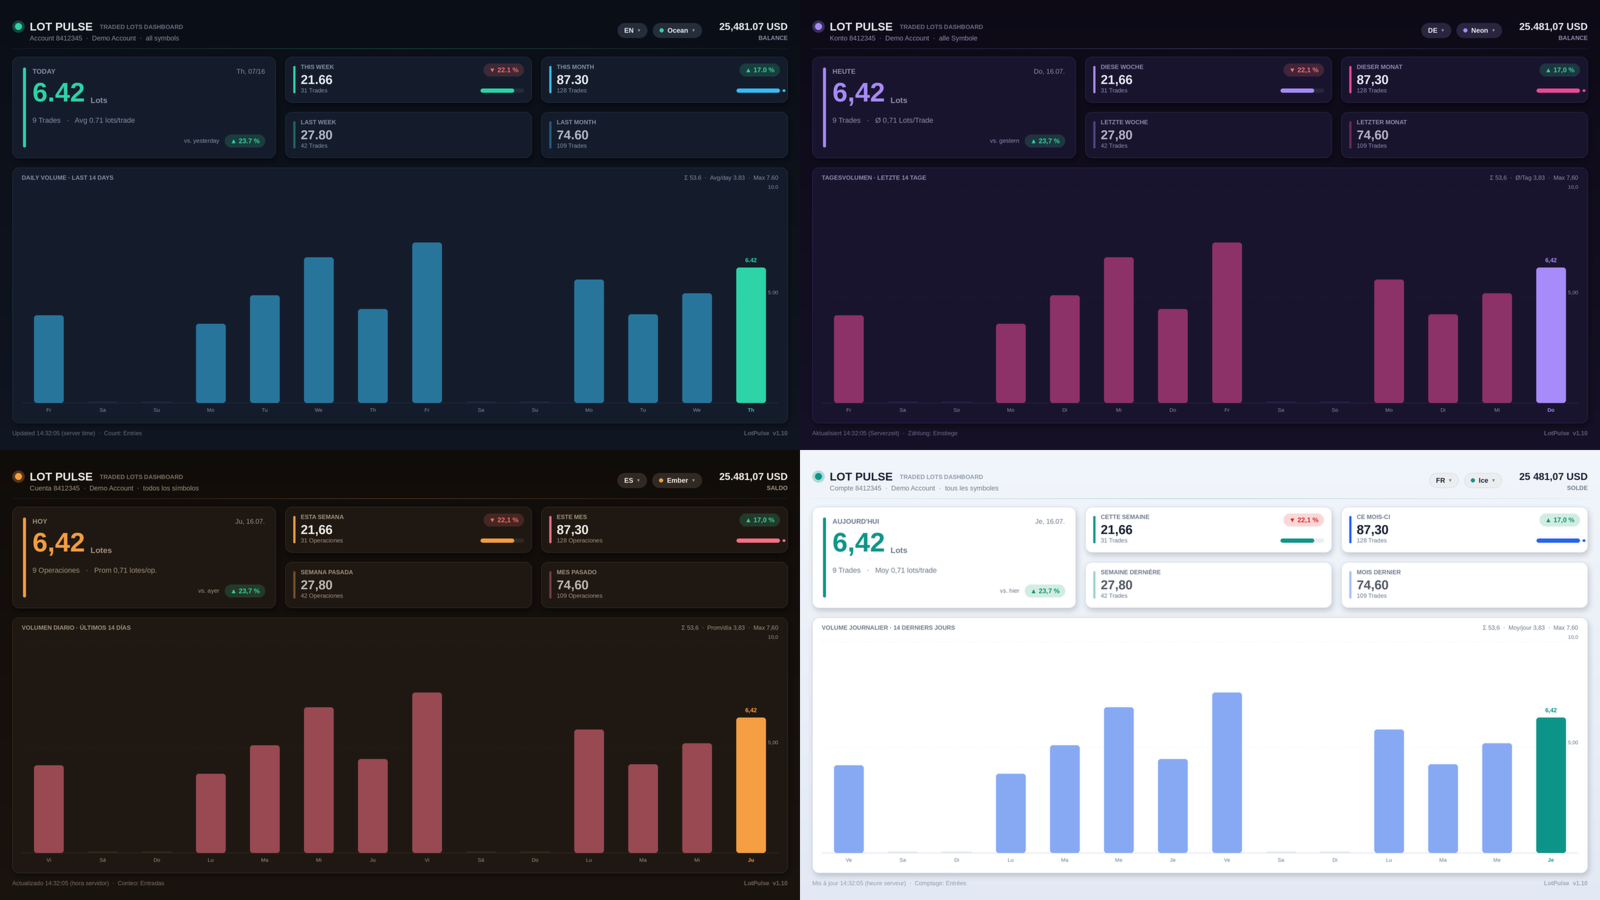
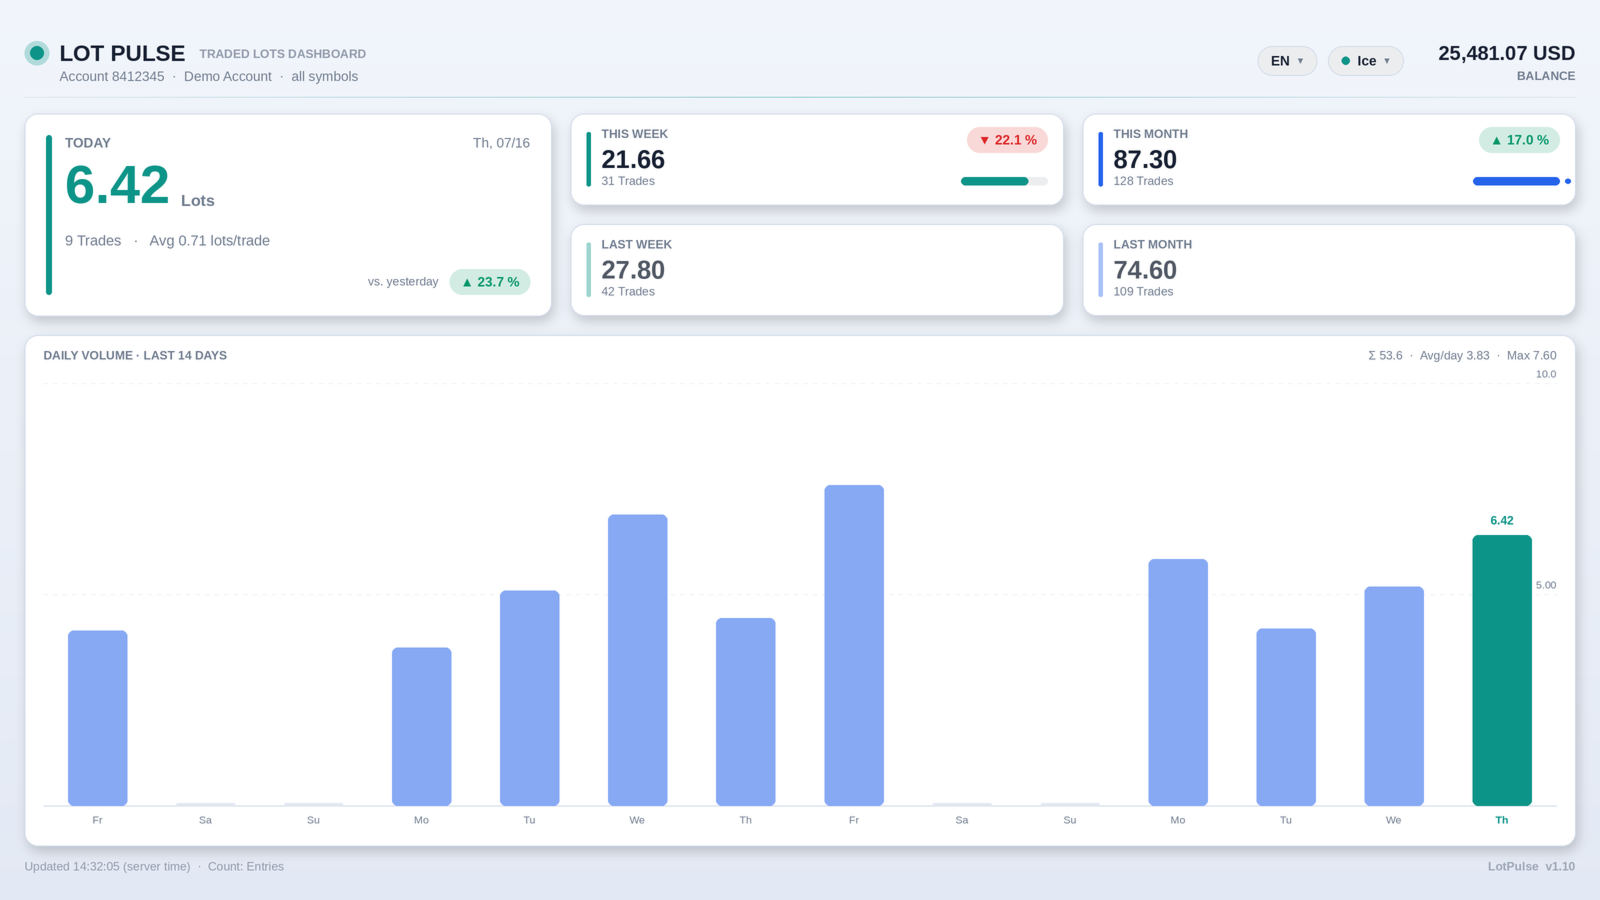
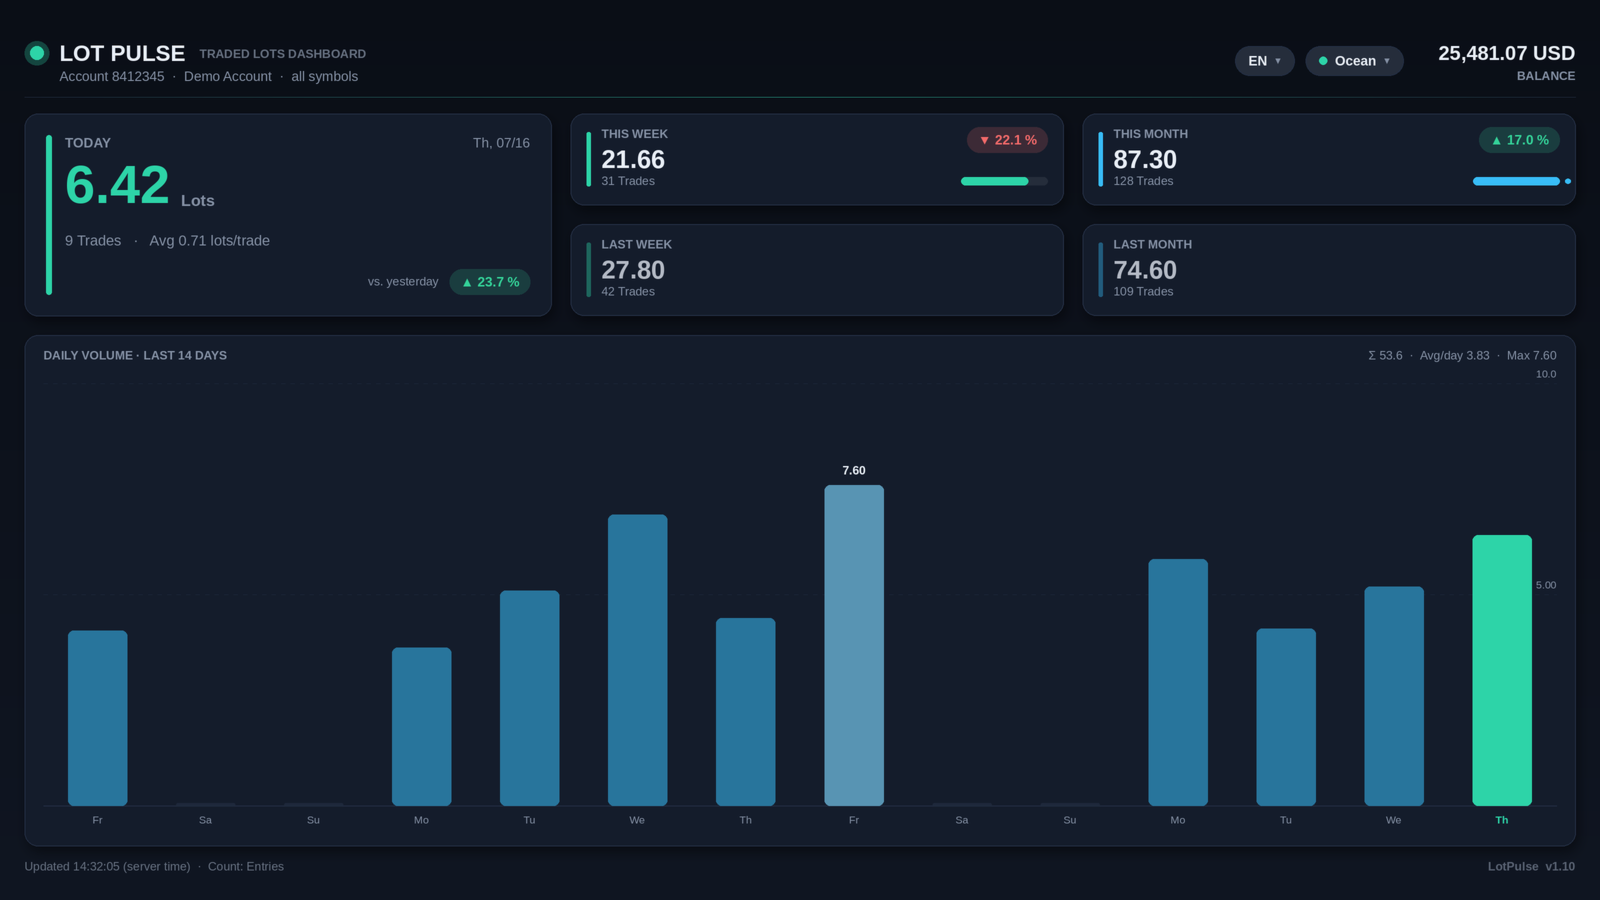
LotPulse turns your account's trading volume into a clean, modern on-chart dashboard. It shows how many lots you traded today, this week, this month, last week and last month — all symbols combined, updated about once per second.
While the indicator is running, the price chart behind the panel is hidden completely, so you get a calm, distraction-free statistics screen. When you remove the indicator, your chart settings are restored automatically.
📊 What it shows
• Traded lots for today, this week, this month, last week and last month
• Number of trades and average lot size per trade
• Change versus the previous period as colored arrow chips (vs. yesterday, vs. last week, vs. last month)
• Progress bars comparing the current week and month with the previous ones
• Daily volume bar chart for the last 5–31 days, with values on mouse hover
• Account number, balance and currency in the header
🎨 Design
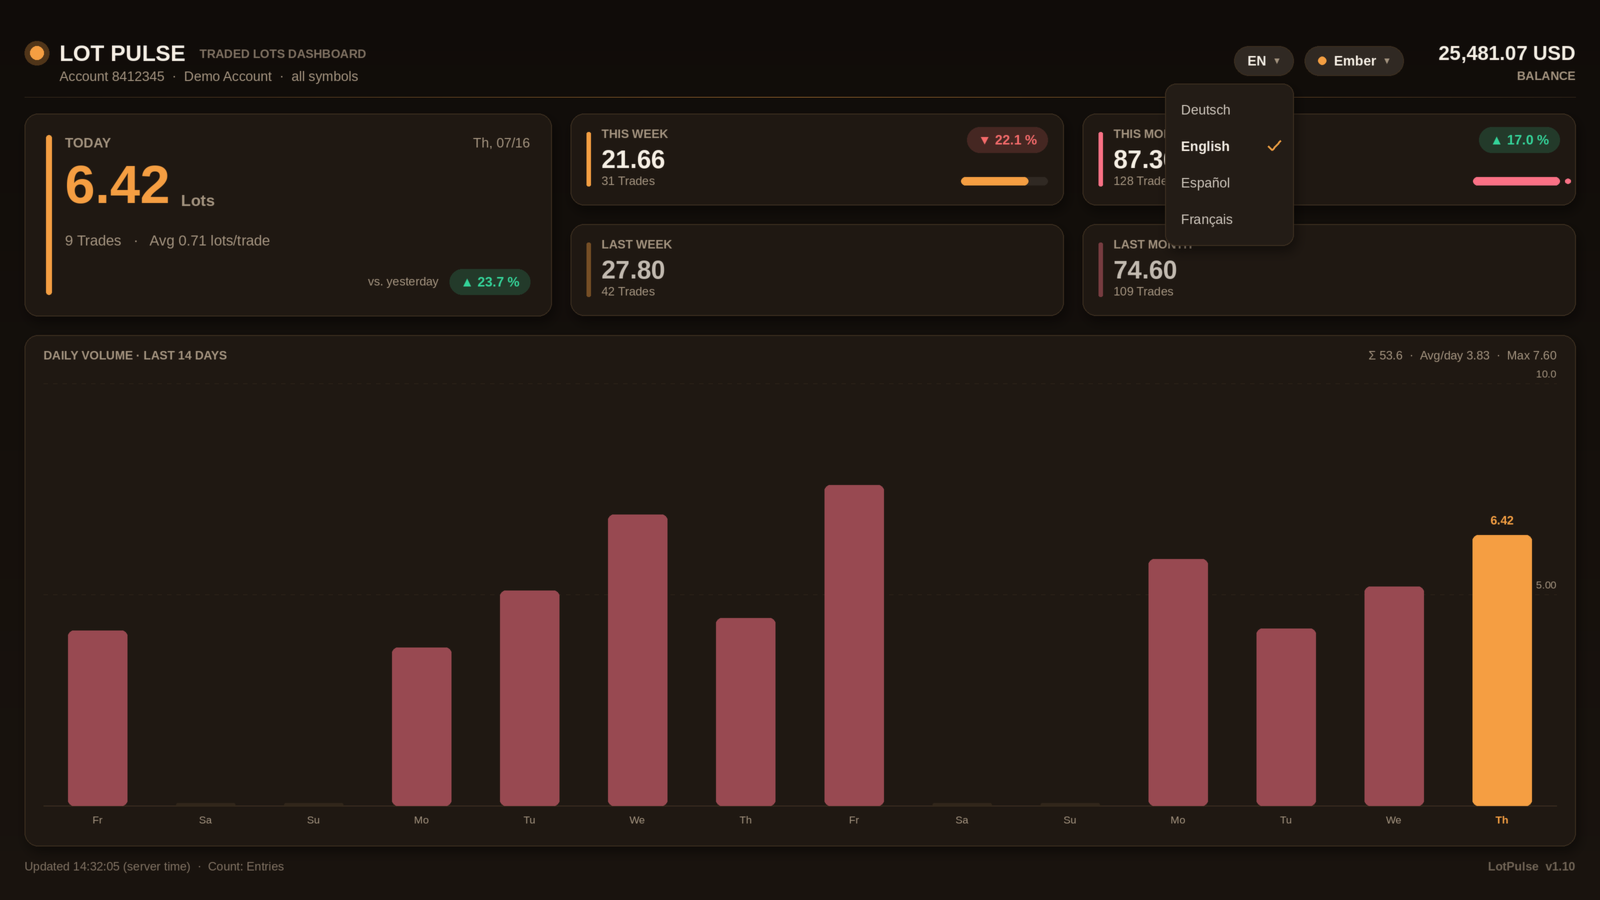
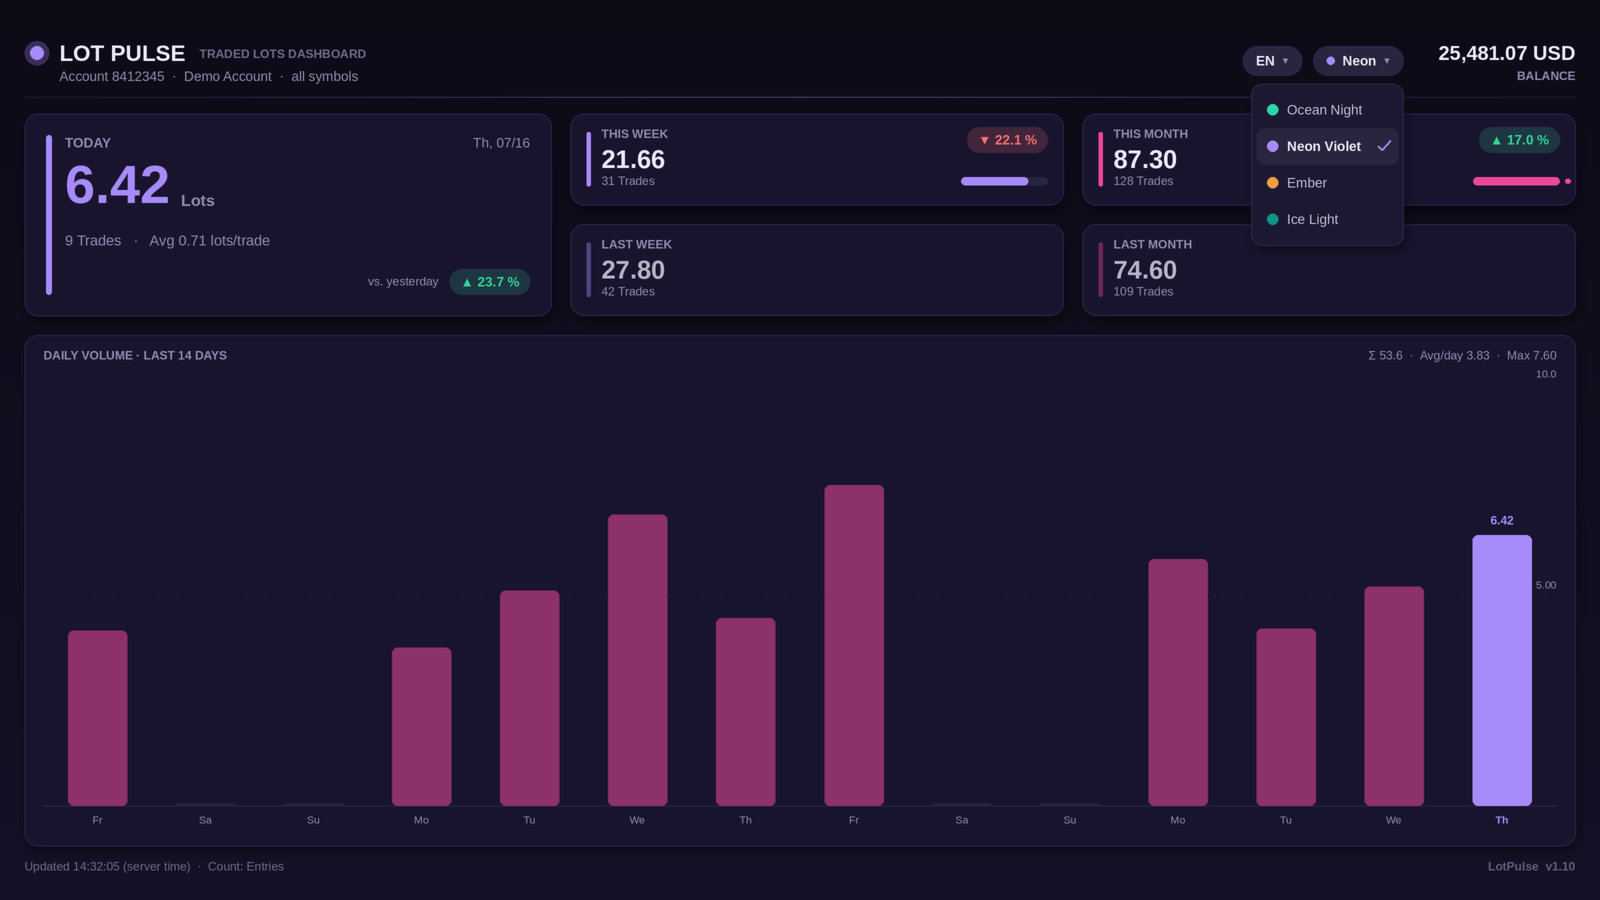
• Four color themes: Ocean Night, Neon Violet, Ember and Ice Light
• Theme switching via a dropdown directly on the chart — one click, no settings dialog
• High-DPI aware (4K monitors), plus an additional manual scale input
• Fully canvas-drawn interface: rounded cards, soft shadows, gradient background
🌍 Languages
• English, Deutsch, Español, Français — switchable via an on-chart dropdown
• Number and date formats follow the selected language
• Language and theme selection is saved and restored automatically
⚙️ How it works
• Reads closed deals from the account history (all symbols; hedging and netting accounts)
• Three counting modes: entries only (opened lots), exits only, or entries + exits (full deal volume)
• Refreshes about once per second, but recalculates only when a new deal appears or the day changes, so CPU load stays minimal
• Pure statistics tool: it does not open, modify or close trades, and it uses no DLLs
🛠️ Inputs
• Language (default) — initial language
• Color theme (default) — initial theme
• Lot counting — entries / exits / both
• Bar chart: number of days — 5 to 31
• Week starts Monday — disable for Sunday-based weeks
• Hide the price chart completely — on/off; restored on removal
• UI scale — extra scaling on top of automatic DPI detection
• Font — panel font
• Refresh (seconds) — update interval
📌 Notes
• Please apply the indicator to its own chart, since it hides the price chart while running.
• Make sure enough account history is loaded in the terminal (at least the previous month).
• The free demo runs in the Strategy Tester only, where no real account history and no mouse interaction are available, so the panel shows zero values there. This is a limitation of the Market demo system, not of the product.
• If you have a question or an idea for the next version, please post it in the Comments tab.
LotPulse turns your account's trading volume into a clean, modern on-chart dashboard. It shows how many lots you traded today, this week, this month, last week and last month — all symbols combined, updated about once per second.
While the indicator is running, the price chart behind the panel is hidden completely, so you get a calm, distraction-free statistics screen. When you remove the indicator, your chart settings are restored automatically.
📊 What it shows
• Traded lots for today, this week, this month, last week and last month
• Number of trades and average lot size per trade
• Change versus the previous period as colored arrow chips (vs. yesterday, vs. last week, vs. last month)
• Progress bars comparing the current week and month with the previous ones
• Daily volume bar chart for the last 5–31 days, with values on mouse hover
• Account number, balance and currency in the header
🎨 Design
• Four color themes: Ocean Night, Neon Violet, Ember and Ice Light
• Theme switching via a dropdown directly on the chart — one click, no settings dialog
• High-DPI aware (4K monitors), plus an additional manual scale input
• Fully canvas-drawn interface: rounded cards, soft shadows, gradient background
🌍 Languages
• English, Deutsch, Español, Français — switchable via an on-chart dropdown
• Number and date formats follow the selected language
• Language and theme selection is saved and restored automatically
⚙️ How it works
• Reads closed deals from the account history (all symbols; hedging and netting accounts)
• Three counting modes: entries only (opened lots), exits only, or entries + exits (full deal volume)
• Refreshes about once per second, but recalculates only when a new deal appears or the day changes, so CPU load stays minimal
• Pure statistics tool: it does not open, modify or close trades, and it uses no DLLs
🛠️ Inputs
• Language (default) — initial language
• Color theme (default) — initial theme
• Lot counting — entries / exits / both
• Bar chart: number of days — 5 to 31
• Week starts Monday — disable for Sunday-based weeks
• Hide the price chart completely — on/off; restored on removal
• UI scale — extra scaling on top of automatic DPI detection
• Font — panel font
• Refresh (seconds) — update interval
📌 Notes
• Please apply the indicator to its own chart, since it hides the price chart while running.
• Make sure enough account history is loaded in the terminal (at least the previous month).
• The free demo runs in the Strategy Tester only, where no real account history and no mouse interaction are available, so the panel shows zero values there. This is a limitation of the Market demo system, not of the product.
• If you have a question or an idea for the next version, please post it in the Comments tab.