FVG Multi TimeFrame Levels

FVG Multi TimeFrame Levels — Indicator Overview

What it is

A multi-timeframe Fair Value Gap detector and analysis tool for MetaTrader 5. It scans price action across up to four configurable timeframe "slots" simultaneously, identifies gaps that meet a configurable significance threshold, draws them as boxes on the current chart, and tracks how each gap behaves over its lifetime — whether it gets tested, how deeply, how often, and ultimately whether it gets filled or swept beyond.

It runs alongside live price action without interrupting it; nothing it draws is interactive or order-related. It is a read-only analytical tool — it tells you where the levels are and what state they're in. Trading decisions remain yours.

What a Fair Value Gap is, and why it matters

A Fair Value Gap (FVG) is a three-bar pattern where the body of an impulse move leaves a price range that no candle's wick fully overlaps. Strict definition: for three consecutive bars older → impulse → newer, the older bar's high sits below the newer bar's low (bullish FVG), or the older bar's low sits above the newer bar's high (bearish FVG). The "gap" is the unfilled price band between them.

These gaps matter because price often returns to them. The impulse move that created the gap was fast enough that no consensus price was established within that range; many participants didn't get to transact at those levels. When price drifts back, that range becomes a liquidity zone — an area where pending orders, stops, and re-entry interest concentrate. Traders who use the concept treat these zones as candidates for support/resistance, entry triggers, or stop-placement anchors.

Not every three-bar gap matters equally. A gap of half a pip on a quiet session is noise; a gap during an impulsive trend day is a level the market is likely to revisit. This indicator's purpose is to find the gaps that matter and track what happens to them.

The four-slot architecture

The indicator exposes four parallel detection slots. Each slot is independent and configurable: source timeframe, color, significance threshold, filter mode, depth-of-test sensitivity, label position. Slots are typically used in two complementary ways:

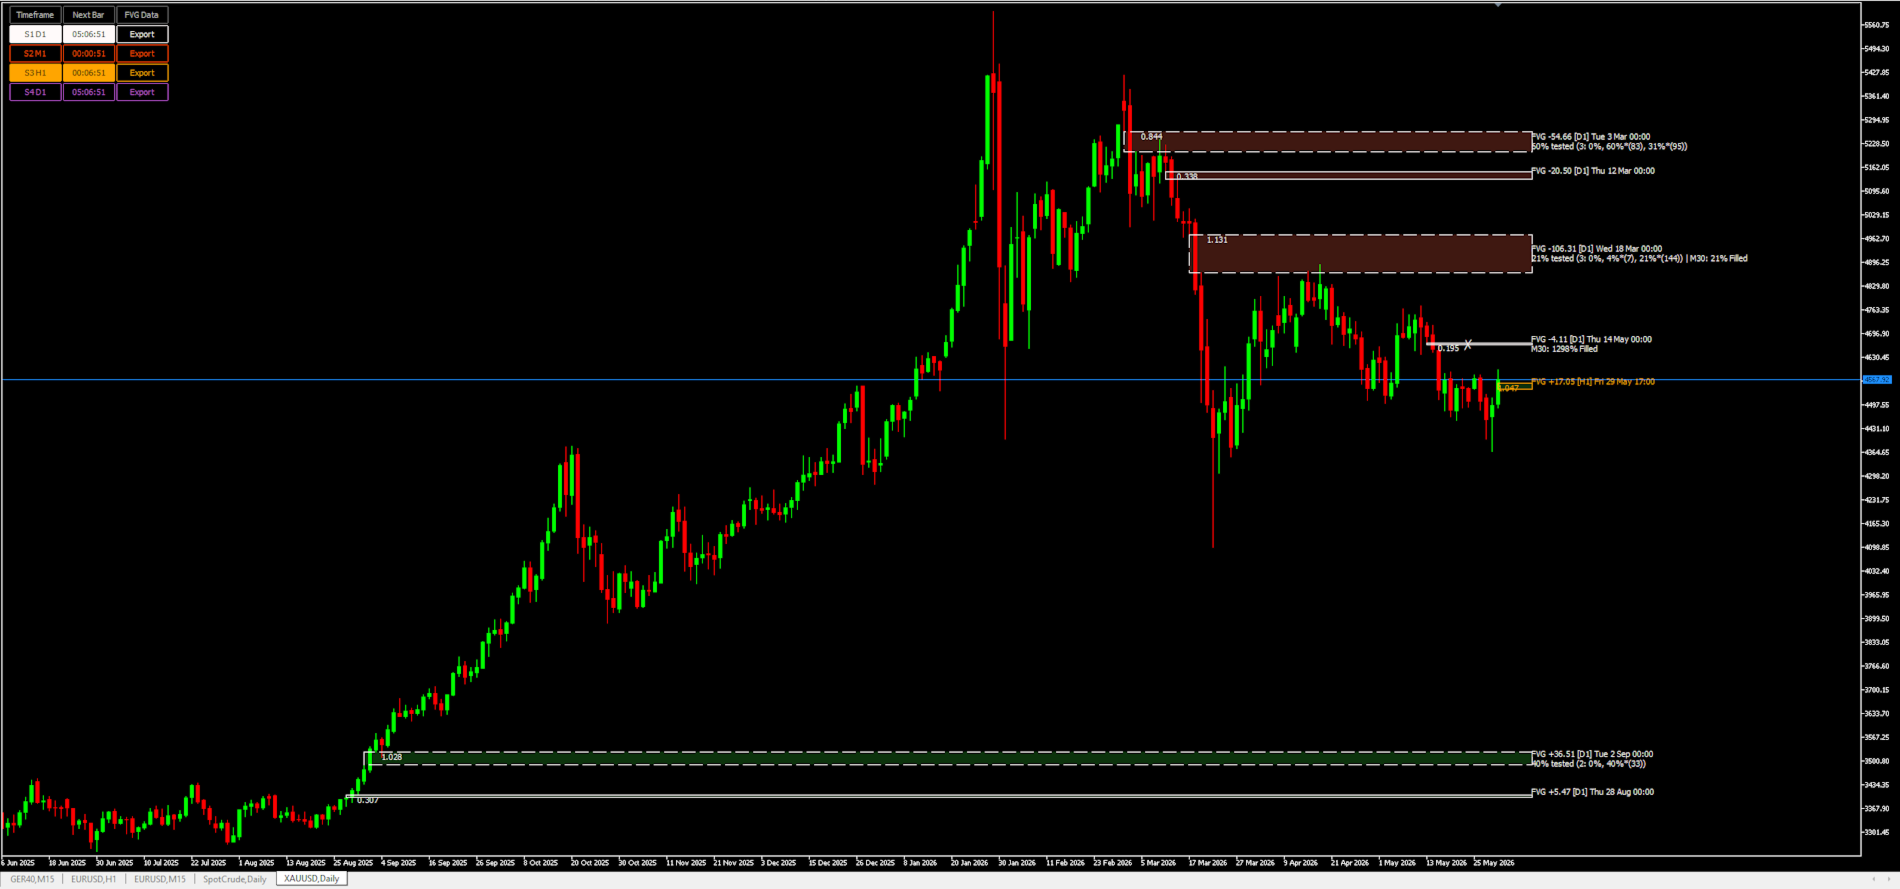
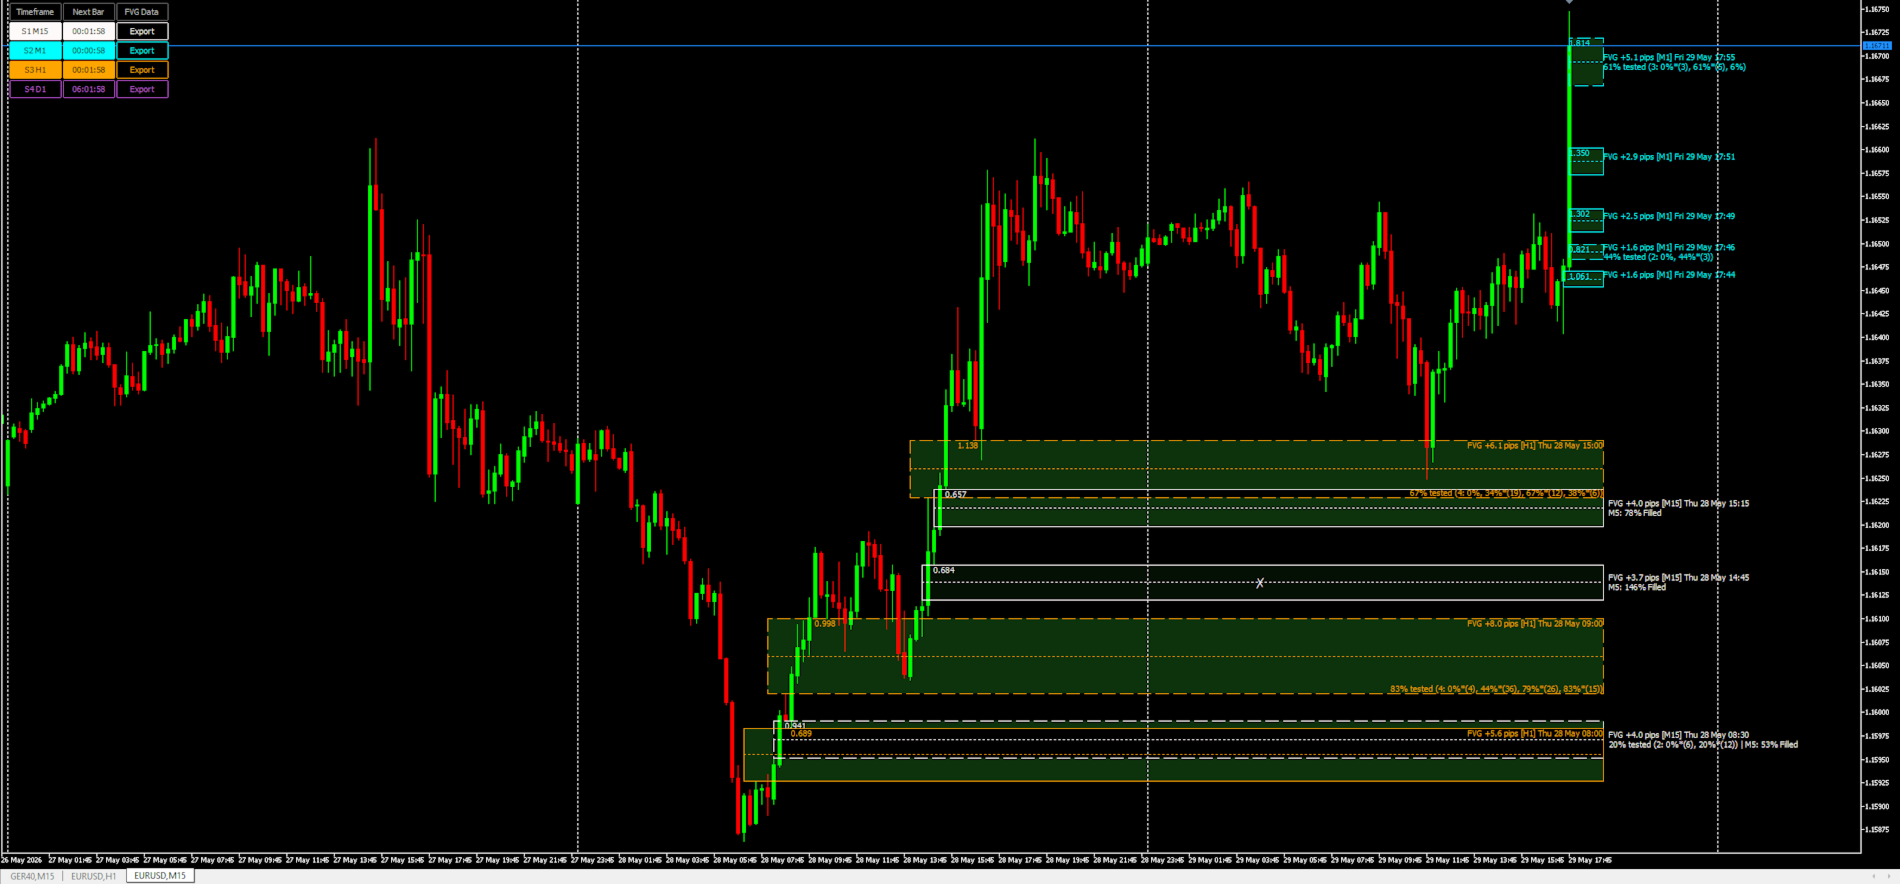
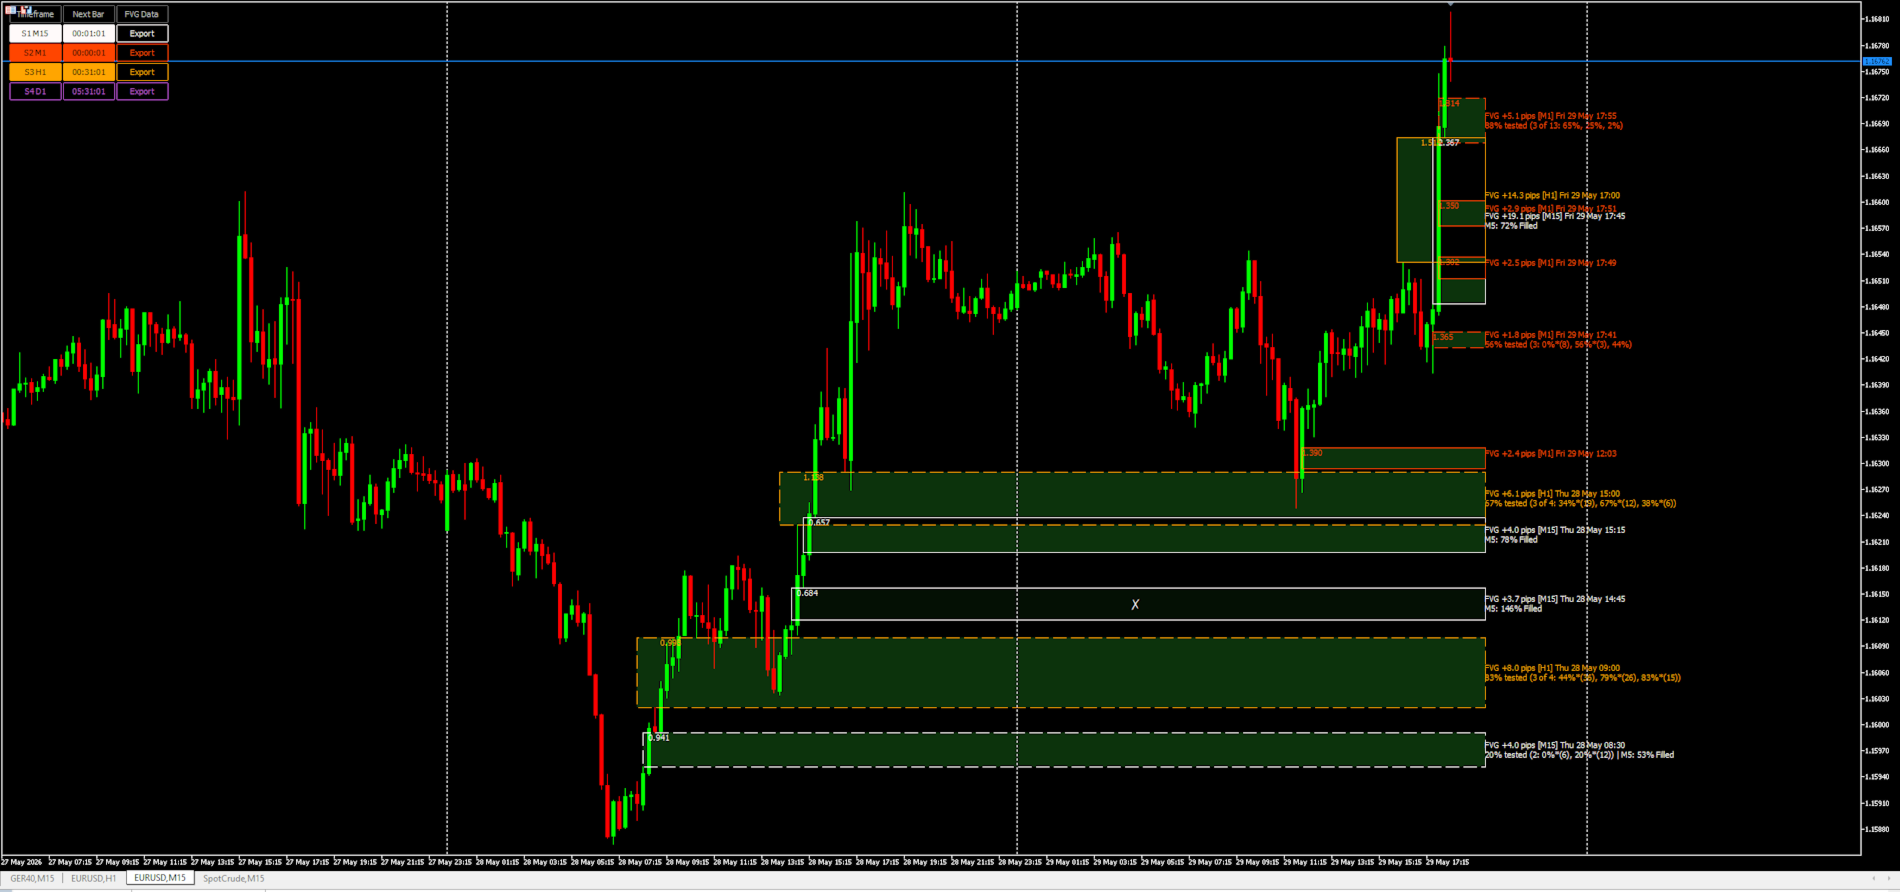
As different timeframes simultaneously. Slot 1 on the current chart's TF, slot 2 on H1, slot 3 on H4, slot 4 on D1. The chart then shows gaps from four time horizons at once, color-coded by slot. This is the canonical multi-timeframe view — you see the M15 gaps you might trade against, the H1 gaps that contextualize them, and the daily gaps that act as macro magnets.

As different significance horizons on the same timeframe. Four slots on H1, but each scoring gaps against a different volatility window (a "Sensitive" 8-bar ATR, a "Moderate" 21-bar, a "Conservative" 34-bar, and one manual). The same instrument is then judged against multiple time-scales of "what counts as a big move," and a gap that lights up in the Sensitive slot but stays dark in the Conservative one is telling you "significant relative to the last few hours, trivial against the broader regime."

These modes can mix. A slot is a configuration, not a fixed concept; the architecture is general.


How a gap is selected for display

A candidate gap goes through several gates before it appears on the chart:

1. Structural test. Three consecutive bars must form a strict, non-overlapping gap. If wicks overlap, no gap exists by definition, regardless of how the candles look to the eye. This is non-negotiable and tunes nothing.

2. Continuity check. The three bars must be temporally adjacent — no weekend gap, no session break. A "gap" between Friday's close and Monday's open isn't structural, it's calendar.

3. Significance score. Each candidate is given a score.

This normalizes the gap's size and the impulse candle's body against recent volatility. A score of 1.0 means the gap and body are roughly average for the prevailing volatility; 2.0+ means a clearly forceful move. The ATR window is configurable globally and per-slot.

4. Strictness gate. The score must clear a configurable threshold (0 = no filter, 100 = only the strongest gaps). The threshold maps linearly to a 0–2.5 score floor, so the slider directly controls what fraction of detected gaps survive.

5. Optional minimum-score post-filter. A second, absolute-score floor that layers on top of strictness. Where strictness is an abstract knob, this is in the same units as the visible per-box score — read the chart, decide where the noise sits, set the floor directly.

A gap that passes all five gates is added to the slot's display list, capped at a configurable maximum to prevent chart clutter.

What gets drawn for each gap

For each surviving gap, the indicator draws several elements:

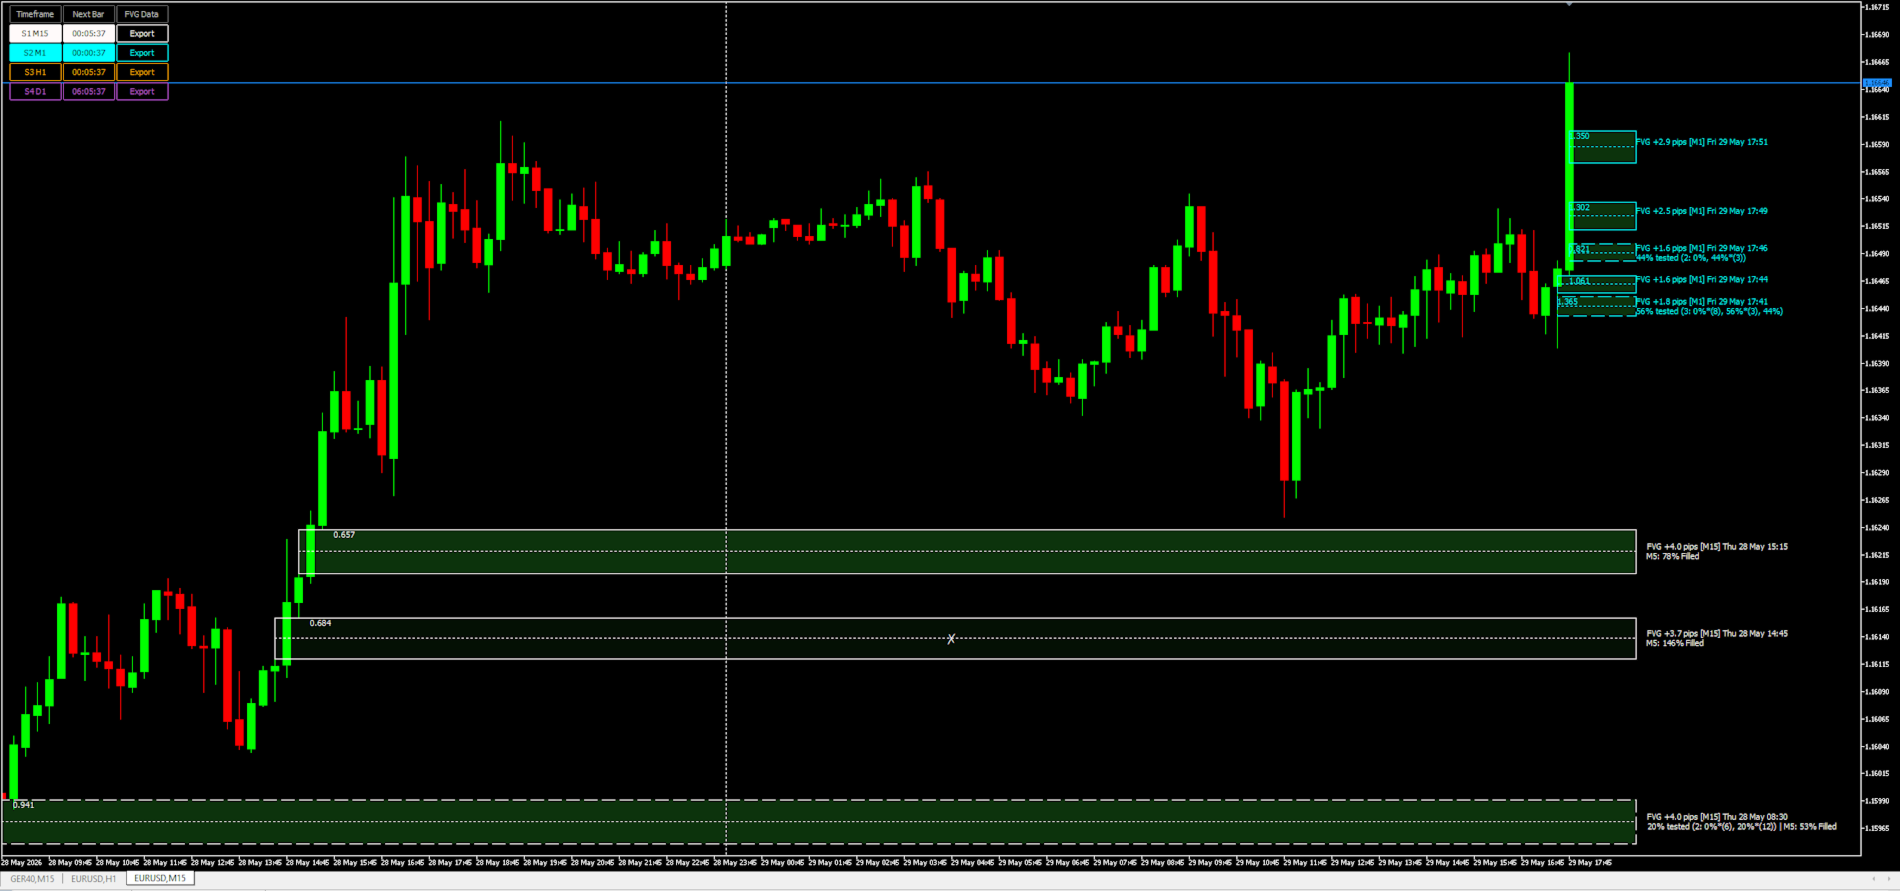
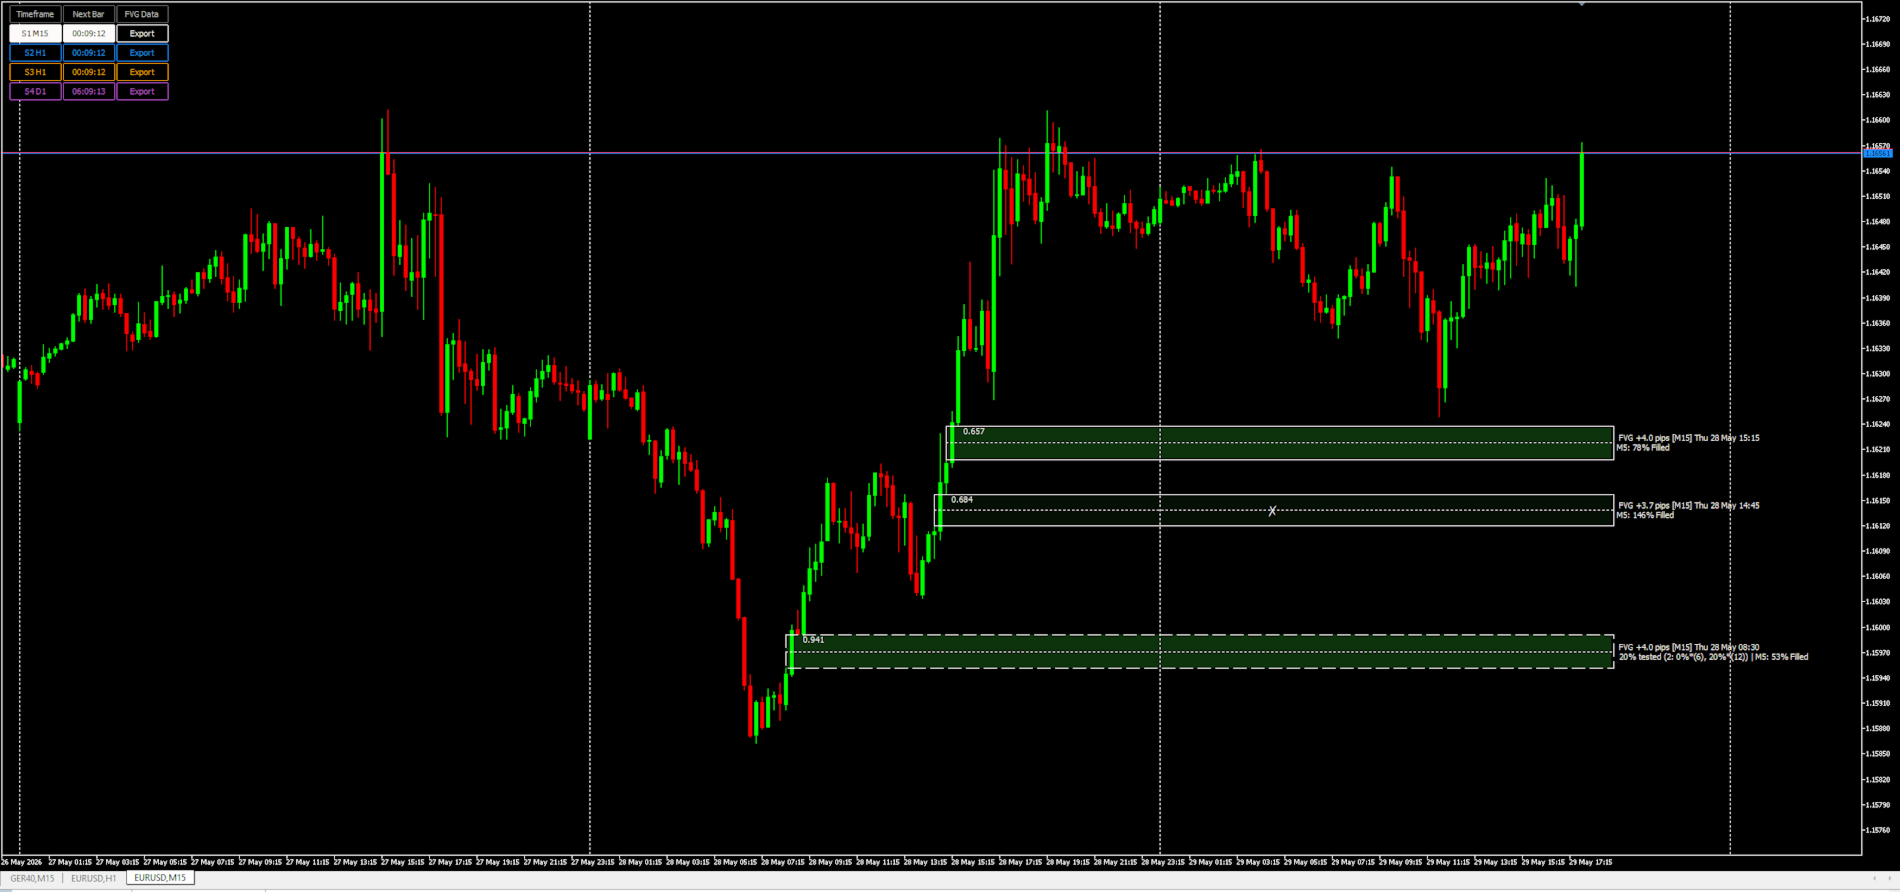
The box — a rectangle spanning the gap's price range (top to bottom) and time span (from the older bar's time, extending forward into current and future candles). The box border uses the slot's color; the border style indicates whether the gap has been tested (solid line) or remains untouched (dashed line, by convention).

An optional directional fill — a faint green or red tint inside the box marking bull/bear direction. Opacity is low so candles dominate the visual hierarchy.

An optional center line — a faint horizontal line at the gap's 50% midpoint, a common partial-fill target in some trading approaches.

An optional significance score — the gap's numeric score, drawn slot-colored inside the box at a configurable offset from the left edge. Reading this turns the abstract strictness control into a concrete per-gap readout.

The label — the gap's size in pips/price units, formation timestamp, the source timeframe tag, and (if any tests have happened) a test-history string showing how deeply each test penetrated and whether bars touched the gap multiple times within their span. Label position is configurable (next to, above, below, or stacked at multiple corners of the box).

A swept marker — when lower-timeframe analysis shows the gap has been filled past a configurable threshold, the box's fill fades sharply and a large centered symbol (default ✗) appears, telling the eye at a glance that this level is "spent."

How gap lifecycle is tracked

The indicator doesn't just detect gaps — it tracks them through their life:

Tested vs untested. Each new bar after a gap forms is checked for wick penetration. The first time a bar's wick crosses the touch-depth threshold (configurable from 1% — any penetration — to 110% — gap fully traversed and SL liquidity beyond it swept), the gap flips from untested to tested. The box style changes correspondingly. The test history label accumulates each touch event, showing depth and multiplicity.

Multi-touch detection. When a bar's range straddles the gap, the indicator does a tick-level scan (within the limits of MT5's tick history) to count how many distinct touches happened in that bar. A single bar can leave a * mark (touched once) or *(N) (touched N times) in the history. This catches bars that hammered a level repeatedly without it being obvious from the candle shape.

Lower-timeframe fill check. Optionally, each gap is checked against a lower timeframe — for example, an H1 slot can have its gaps re-examined on M5 across their full lifetime. This catches fills that the slot's own timeframe missed: an H1 gap that looks untouched on H1 might have been fully traversed by an M5 spike and an immediate reversion that didn't show in the H1 high/low. The deepest LTF penetration is recorded as a percentage; gaps past 100% are considered swept.

Fill removal. When a gap is fully filled (price closes through it on the slot's own timeframe), it's removed from the display list — the slot keeps a fixed quota of unfilled gaps visible, so the chart stays clean as new gaps form and old ones get consumed.

The HUD

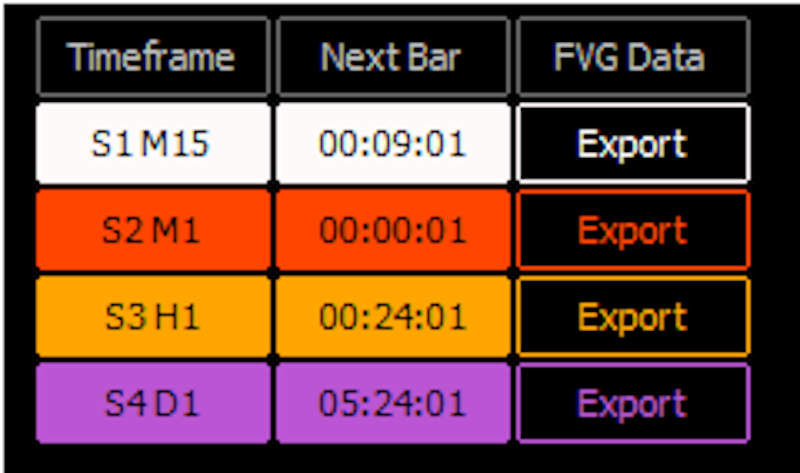
A small on-chart panel — anchored to a configurable corner — gives at-a-glance status and quick controls. Each slot has its own row showing:

Toggle button. Click to show/hide that slot's gaps without modifying input settings. The button shows the slot's source timeframe and reflects its current on/off state.

Countdown. Live countdown to the next bar close on the slot's timeframe. Useful when slots run different timeframes — tells you when each could next produce a new gap.

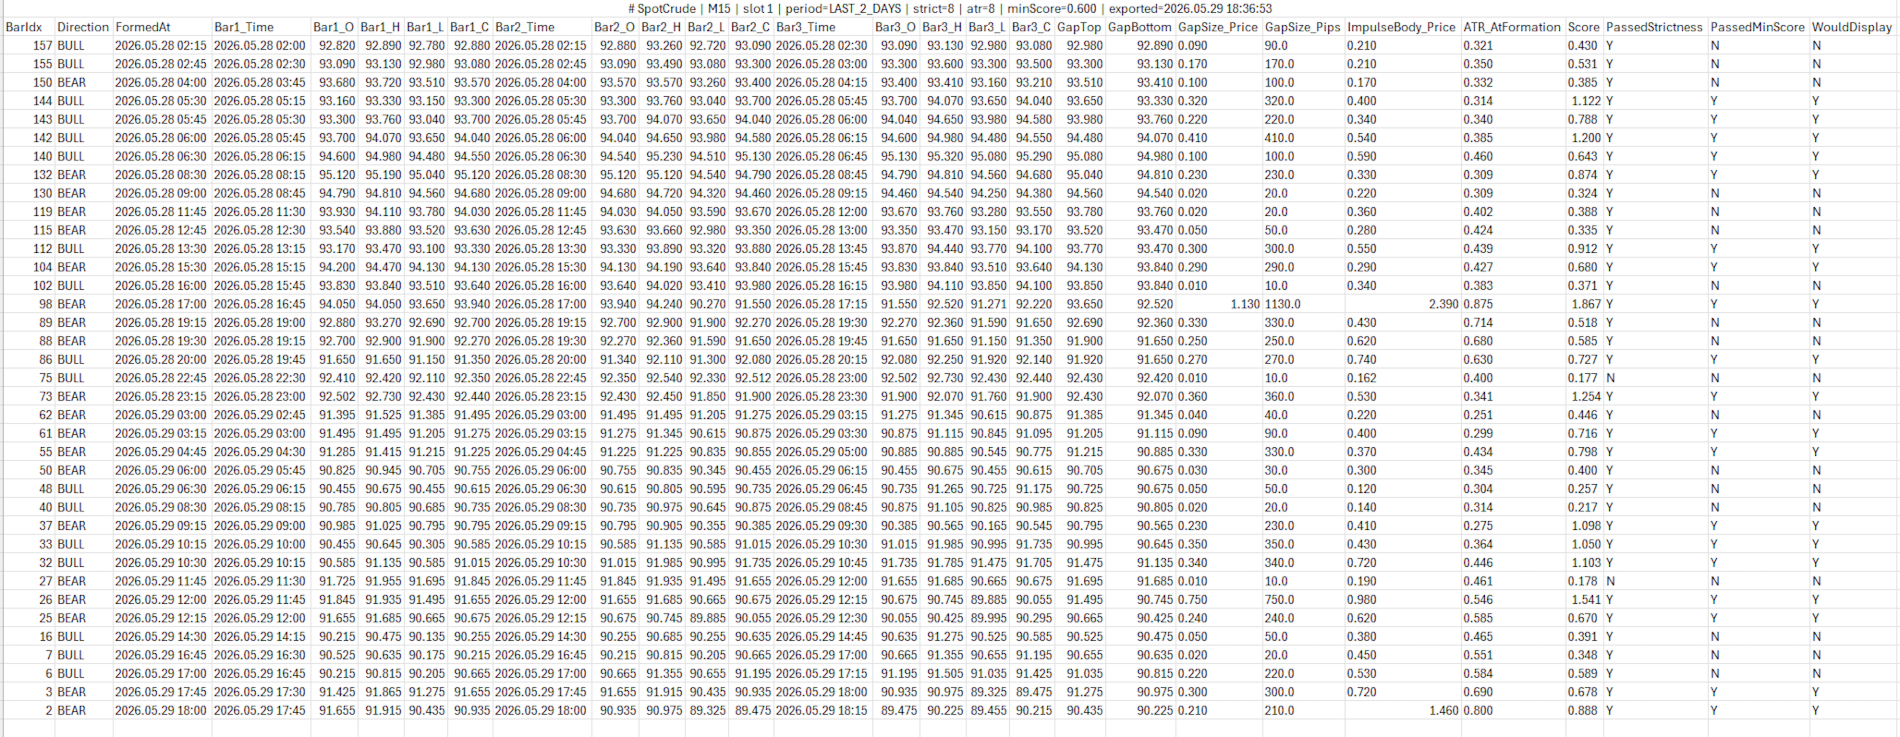
Export button. Triggers a one-shot deep re-scan over a configurable period (today / last 2 days / this week / last 2 weeks / this month / last N bars) and writes a CSV file containing every gap detected — including those filtered out by the current settings, with explicit flags for which gates each gap passed. Lets you analyze score distributions in Excel and choose filter thresholds from data rather than guesswork.

The HUD anchors cleanly to any of the four chart corners; column widths and offsets are configurable.

How the tool is intended to be used

The natural workflow has three phases:

1. Setup. Pick the timeframe arrangement that fits how you trade. Multi-TF if you analyze in layers; single-TF multi-horizon if you want one chart to show multiple interpretations of significance. Set colors, enable the in-box score display, pick a reasonable ATR mode.

2. Tuning. Run with the score visible. Watch how gaps score on the instruments and timeframes you actually trade. Set strictness loose at first to see the distribution; raise it (or set a minimum-score floor) once you can read the difference between meaningful gaps and noise. When you can't decide by eye, export to CSV and analyze the score distribution in Excel.

3. Daily use. With tuning settled, the indicator becomes background information. The boxes show you where levels are. The colors tell you which timeframe each level belongs to. Tested-vs-untested and swept markings tell you which levels are still potent and which are spent. The HUD lets you toggle slots in and out of view depending on what you're focused on.

The indicator does not generate signals, send notifications, or trade. It is a structural overlay; its value is making the FVG framework visible and tractable, so a trader who already uses the concept can use it more efficiently than they could by spotting gaps manually.

What the tool is not

  • It is not a strategy. The FVG concept does not work mechanically — a tested gap can hold or fail, and which one happens depends on context the indicator does not model (trend, session, news, higher-timeframe structure beyond what your slots capture).
  • It is not a real-time alerting system. There are no popups, sounds, or push notifications. The indicator's output is purely visual.
  • It is not predictive. The significance score reflects gap geometry at formation; it does not forecast whether a level will hold or fail. A high-scoring gap is more likely to matter in the statistical sense that it was a real volatility event — but high-scoring gaps fail regularly, and low-scoring gaps sometimes hold cleanly.
  • It is not a substitute for a trading framework. It assumes you already know how you want to use FVGs. Within that assumption, it removes the manual work of finding and tracking them.

Summary

The indicator detects FVGs across multiple configurable horizons, scores them against local volatility, tracks their tested/filled/swept state over their lifetime, and presents the result as a color-coded multi-layer overlay on the current chart. Significance is configurable along two orthogonal axes (volatility window and score threshold), and a per-gap score readout makes the filtering tunable from real numbers rather than abstract knobs. Lifecycle tracking — including lower-timeframe fill detection — distinguishes live levels from spent ones, and a CSV export supports data-driven tuning. The HUD provides quick visibility control and on-demand export without touching the settings dialog.


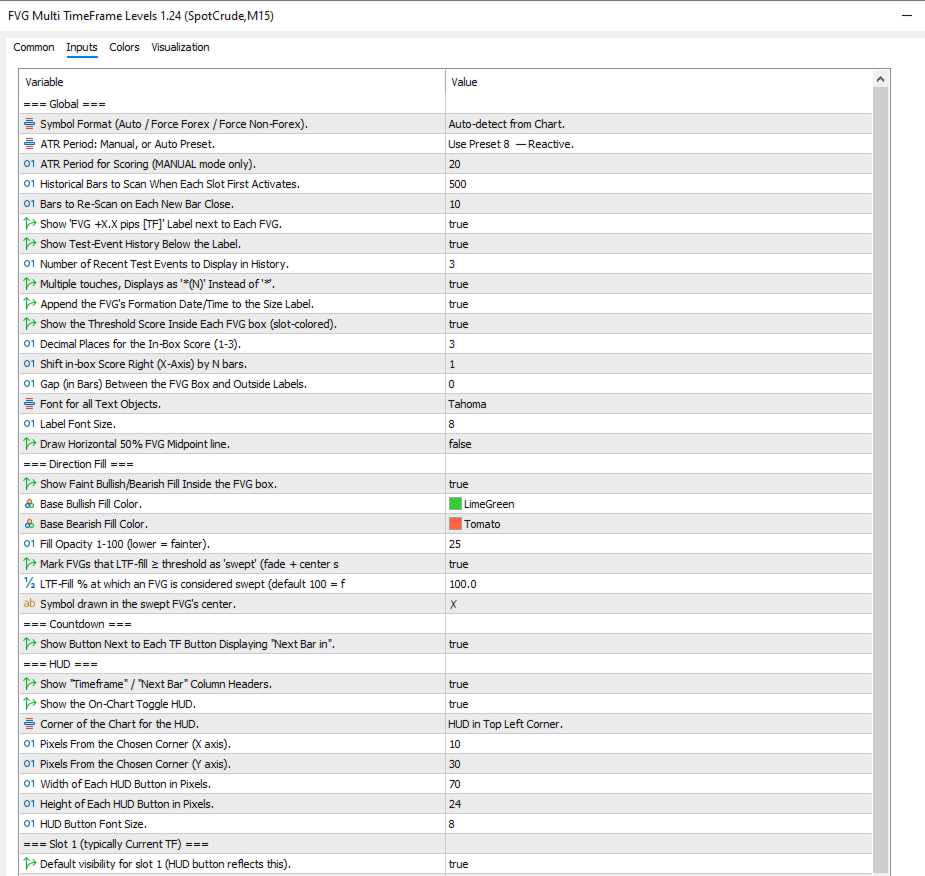
=== Global ===

Settings:

  • Symbol Format (Auto / Force Forex / Force Non-Forex). Controls whether sizes are shown as pips (forex) or raw price units (indices/metals). Auto picks based on the broker's calc mode. Leave on Auto unless an exotic instrument is mislabelled.
  • ATR Period: Manual, or Auto Preset. Global ATR mode used to score significance. Manual / Sensitive 8 / Moderate 21 / Conservative 34. Moderate is the safe default; with per-slot ATR you can leave this on Manual and let each slot pick its own horizon.
  • ATR Period for Scoring (MANUAL mode only). Manual ATR period; ignored unless the mode above is Manual. 10–25 is the useful range. 55+ is too long for intraday FVG.
  • Historical Bars to Scan When Each Slot First Activates. One-time deep scan size at attach / TF change. 500 is plenty for H1. Higher = slower attach and more old FVGs on the chart.
  • Bars to Re-Scan on Each New Bar Close. Sliding window re-checked every bar close, catches late formations. 10 is fine. Push to 20–30 only if you genuinely see real FVGs being missed.
  • Show 'FVG +X.X pips [TF]' Label next to Each FVG. The headline label next to the box (size + TF + formation time + test history). Where most of the textual info lives. Turning it off makes the chart cleaner but you lose those readouts.
  • Show Test-Event History Below the Label. Appends XX% tested (N: 0%*, 44%*, ...) showing how deeply each test penetrated. The * markers indicate multi-touch bars.
  • Number of Recent Test Events to Display in History. How many of the most recent tests are listed. 3–5 is the sweet spot. More may trigger the v1.19 auto-split.
  • Multiple touches, Displays as '(N)' Instead of ''. If a bar touches the FVG more than once, show the count. Off keeps things clean; on if you want to spot multi-touch bars.
  • Append the FVG's Formation Date/Time to the Size Label. Adds the formation timestamp to the size label. Useful for cross-referencing news.
  • Show the Threshold Score Inside Each FVG box (slot-colored). Draws the per-FVG significance score inside the box. The single most useful tuning aid. Keep on while tuning, turn off later for a cleaner chart.
  • Decimal Places for the In-Box Score (1-3). Precision of the in-box score. 2 is right for most charts. Drop to 1 if it crowds small boxes.
  • Shift in-box Score Right (X-Axis) by N bars. Slides the score off the pattern candles into the box's empty area. 3–4 is right for H1+. Bump to 5–6 on lower TFs with thicker candles.
  • Gap (in Bars) Between the FVG Box and Outside Labels. Small breathing space between the box border and outside-mode labels. 1 is right for most modes. Set to 0 to return to flush-against-the-box. Doesn't affect inside-the-box label modes.
  • Font for all Text Objects. Font used by labels and the in-box score. Consolas / Courier New (monospace) makes columns line up.
  • Label Font Size. Point size for all FVG text. 8 fits most charts. Bump to 9–10 on 4K.
  • Draw Horizontal 50% FVG Midpoint line. Faint horizontal line at each FVG's midpoint (applies to all slots). Off by default. Turn on if you trade off the midpoint.


=== Direction Fill ===

Settings:

  • Show Faint Bullish/Bearish Fill Inside the FVG box. Tints each FVG box green or red depending on direction. Makes direction readable at a glance without checking the candles.
  • Base Bullish Fill Color. Color used for the bullish tint. LimeGreen is high-contrast on dark themes.
  • Base Bearish Fill Color. Color used for the bearish tint. Same principle — Tomato is loud on dark themes.
  • Fill Opacity 1-100 (lower = fainter). How strong the tint is. 25 is the sweet spot. Above 50, the fill starts fighting the candles.
  • Mark FVGs that LTF-fill ≥ threshold as 'swept' (fade + center symbol). Toggles the v1.24 swept-FVG visual flag. Only does anything if the slot's Fill Check is on — the flag is driven by fillCheckMaxPct. Set Fill Check 1–2 steps below the slot's TF to populate it.
  • LTF-Fill % at which an FVG is considered swept (default 100 = fully filled). The fill% threshold above which a box gets the swept treatment. 100 = fully filled is the safe default. Drop to 80–90 if you want partially-filled boxes flagged too.
  • Symbol drawn in the swept FVG's center. Unicode character (or any text) placed at the box center when swept. ✗ is unambiguous. ⊘ or ◊ also read cleanly. Avoid long strings — it's font-sized larger than labels and a long string will overflow narrow boxes.


=== Countdown ===

Settings:

  • Show Button Next to Each TF Button Displaying "Next Bar in". Live countdown to the next bar close for each slot's TF. Useful when slots run different TFs.


=== HUD ===

Settings:

  • Show "Timeframe" / "Next Bar" Column Headers. Column headers above the per-slot button rows. Helpful early on; the third header "FVG Data" appears automatically above the Export column.
  • Show the On-Chart Toggle HUD. The HUD panel itself (with per-slot show/hide and export buttons). Turning the HUD off hides the buttons; slots are still configurable via inputs, just not toggleable from the chart.
  • Corner of the Chart for the HUD. Which corner the HUD anchors to. All four corners now align cleanly (v1.26 fix).
  • Pixels From the Chosen Corner (X axis). Horizontal offset from the chosen corner. In right-anchor modes, this is the gap between the HUD's right edge and the chart's right edge (v1.26 — was buggy in v1.22–1.25).
  • Pixels From the Chosen Corner (Y axis). Vertical offset from the chosen corner. Nudge to avoid overlap with chart edges.
  • Width of Each HUD Button in Pixels. Per-button width. 70 fits four short TF labels comfortably.
  • Height of Each HUD Button in Pixels. Per-button height. Make taller on 4K for tap-target sizing.
  • HUD Button Font Size. Font size used inside the HUD buttons. 8–9pt fits a 24px button cleanly.


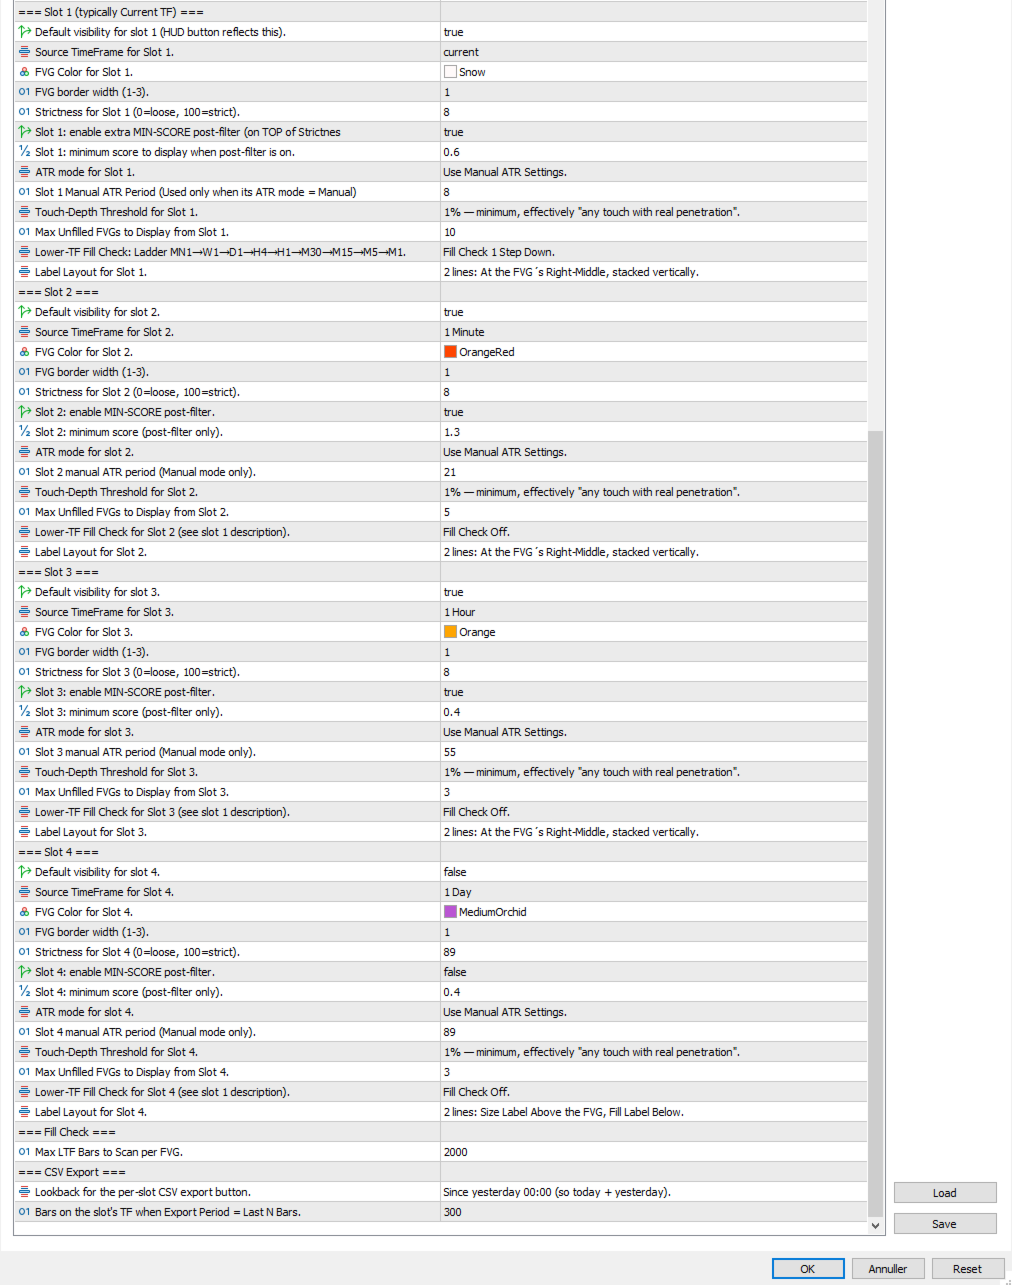
=== Slot 1 (typically Current TF) ===

Settings:

  • Default visibility for slot 1 (HUD button reflects this). Whether slot 1 is enabled on attach. Off is fine for slots you only need occasionally.
  • Source TimeFrame for Slot 1. Which TF this slot scans (use Current to follow the chart). Current follows the chart; pick an explicit TF for a fixed-horizon slot.
  • FVG Color for Slot 1. Color for the border, in-box score, swept symbol, and labels. Give each slot a distinct color — that's how you read which slot any box belongs to.
  • FVG border width (1-3). Box border thickness. Use width to encode importance (1 for noise, 2 for the slot you care about most).
  • Strictness for Slot 1 (0=loose, 100=strict). Minimum significance score a gap must reach to display. 0 = no filter, 50 = middle, 100 = extremely strict. A four-slot ladder of 0/30/55/80 on the same TF gives progressive filters.
  • Slot 1: enable extra MIN-SCORE post-filter (on TOP of Strictness). Toggles a second-stage absolute-score floor layered on top of strictness. Easier to tune than strictness because it's in the same units as the displayed in-box score. "I want nothing under 0.5" → set this on, type 0.5.
  • Slot 1: minimum score to display when post-filter is on. The absolute score floor for this slot. Read the in-box scores, decide where the noise sits, set this slightly above. Has no effect if the toggle above is off.
  • ATR mode for slot 1. Per-slot ATR mode (Inherit Global / Manual / Sensitive 8 / Moderate 21 / Conservative 34). Combined with per-slot strictness, lets the same TF be scored against multiple volatility horizons.
  • Slot 1 manual ATR period (Used only when its ATR mode = Manual). Slot-specific manual ATR period; ignored unless this slot's ATR mode = Manual. Useful if none of the three presets quite match.
  • Touch-Depth Threshold for Slot 1. How deeply price must penetrate to count as a touch: 1% / 10% / 30% / 50% / 90% / 110%. 110%. 30% is a balanced default. 110% flags potential reversals after stop hunts.
  • Max Unfilled FVGs to Display from Slot 1. Cap on how many unfilled FVGs from this slot draw at once. 3–5 keeps things readable.
  • Lower-TF Fill Check: Ladder MN1→W1→D1→H4→H1→M30→M15→M5→M1. Walks a lower TF across the FVG's lifetime to catch fills the slot's own TF can't see. Off is fastest. Required for the swept flag (v1.24) to do anything — drives fillCheckMaxPct. Set 1–2 steps below the slot's TF.
  • Label Layout for Slot 1. Where the size/history label sits: Line1_* (single-line, four positions) or (dual-line, 3 positions). The single-line modes auto-split when text gets too long.


=== Slot 2 / Slot 3 / Slot 4 ===

Same input set as Slot 1 — every row above repeats per slot (including the new min-score pair), with these defaults differing:

e.g.

Slot 1 Current Timeframe

Slot 2 H1

Slot 3 H4

Slot 4 D1


=== Fill Check ===

Settings:

  • Max LTF Bars to Scan per FVG. Global cap on the lower-TF scan length used when any slot's Fill Check is enabled. 2000 covers most cases. Lower to 500–1000 if you see lag on deep ladders.


=== CSV Export ===

Settings:

  • Lookback for the per-slot CSV export button. How far back to re-scan when an Export button is pressed. Today / Last 2 Days / This Week / Last 2 Weeks / This Month / Last N Bars.
  • Bars on the slot's TF when Export Period = Last N Bars. Lets you export an exact-length window when the calendar presets don't fit.
Рекомендуем также
My Products: View My Products My Profile / Support / Contact: Visit My Profile My Channel: Follow My Channel MA Ultra Trend is a professional technical indicator for MetaTrader 5 designed to help traders identify market trend, momentum shifts, pullback opportunities and potential reversal points through a combination of a configurable Moving Average and a normalized oscillator. Instead of relying on a single traditional indicator, MA Ultra Trend combines trend direction + oscillator momentu
FREE
Инструмент для создания индикаторов Билла Вильямса Наш инструмент предоставляет возможность по щелчку мыши установить индикаторы Билла Вильямса на график. - Индикатор Awesome Oscillator (AO) — помогает оценить движущую силу тренда и. - Индикатор Alligator — определяет текущее состояние тренда и возможные точки входа и выхода. - Индикатор Fractals — помогает идентифицировать значимые уровни  - Индикатор Accelerator Oscillator (AC) — показывает изменение ускорения тренда. - Индикатор Market Facil
FREE
Strength Radar2
Erick Guimaraes Dos Santos
Strength Radar 02 — Поднимите ваш трейдинг на новый уровень! Здравствуйте, трейдер! Если вы ищете инструмент, который выведет вашу работу на форекс на новый уровень, Strength Radar 02 — именно то, что вам нужно! Разработанный с энтузиазмом и профессионализмом, этот индикатор превращает анализ силы валют в простой и мощный процесс. Он показывает вам четкую картину в реальном времени по AUD, CAD, CHF, EUR, GBP, NZD, JPY и USD , используя такие индикаторы, как MA, MACD, RSI и другие — всё можно
MT5 Multiframe Signal is a sleek and powerful dashboard indicator built for MetaTrader 5. It instantly displays BUY/SELL direction across all major timeframes — M1, M5, M15, M30, H1, H4, D1 — using advanced EMA‑based trend analysis. The panel delivers real‑time, zero‑delay signals with precise strength measurement and clean visual layout. Works flawlessly on all instruments, including forex pairs (EURUSD, GBPUSD, USDJPY) and metals (XAUUSD) . Maximum clarity, maximum performance — ideal for s
News Bias Engine — Real-Time Economic Calendar with Post-News Directional Bias Most news indicators show you WHEN events happen. News Bias Engine tells you WHAT TO DO after they happen. THE PROBLEM WITH STANDARD NEWS INDICATORS Every economic calendar tool on the market does the same thing: displays upcoming events with countdown timers. That's useful, but it's only half the job. The real question after NFP, CPI, or an FOMC rel
Overview TriParity AfterShock PRO Scanner — это дискреционный индикатор-дашборд для MetaTrader 5. В данном описании триада означает взаимосвязь между тремя валютными парами или инструментами. Scanner просматривает несколько триад и таймфреймов в одной панели и помогает трейдеру более структурированно организовать список наблюдения. Его цель — уменьшить перегрузку графиками, сравнивать кандидатов бок о бок и выделять условия, которые могут заслуживать более пристального внимания. Этот продукт не
HA Metals Flow Chart is a visual MetaTrader 5 indicator designed to make the flow of gold and silver easier to read. It replaces the standard chart display with synthetic Heikin Ashi candles and combines flow classification, normalized momentum, confirmed market structure events and a compact dashboard in a single interface. The indicator is intended for discretionary chart analysis. It does not open, modify or close trades. MAIN FEATURES - Synthetic Heikin Ashi chart for a cleaner view of direc
FREE
Bollinger Bands Advanced Suite for MetaTrader 5 Take the classic power of Bollinger Bands and supercharge it with institutional-grade precision and a professional, multi-channel alert system. The Bollinger Bands Advanced Suite is not just another moving average envelope; it is a complete volatility analysis tool designed for the modern MetaTrader 5 trader. Whether you are a breakout trader, a mean-reversion specialist, or use bands for dynamic support and resistance, this suite provides the c
FREE
Market Ticker Pro MT5
John Louis Fernando Diamante
The only Market Ticker on the market! Add a professional novelty to your workspace, with built in mini-charts A scrolling Market Ticker that displays price changes from all symbols in the Market Watch list. Provides an easy snapshot of symbol prices, and keeps scrolling automatically while you trade and analyse the chart. The ticker color (+/- price changes) are based on either the current or completed candle, and the previous candle. Options include: - MTF, eg choose to show price changes of t
Знание о силе и слабости каждой из валют очень важно для каждого трейдера, торгующего на рынке форекс. Данный индикатор силы валют измеряет силу восьми основных валют (USD, EUR, GBP, CHF, JPY, CAD, AUD, NZD) на основе индикатора индекса относительной силы (Relative Strength Index, RSI). Индикатор PipTick Currency Strength в простой и доступной форме показывает, когда валюта находится в зоне перекупленности, перепроданности или в "нормальном состоянии". Так вы с легкостью можете определить, какая
Trade Info Lightweight Dashboard MT5 Trade Info Lightweight Dashboard MT5 is a modern and lightweight performance dashboard designed for MetaTrader 5 traders who want to monitor trading results clearly and efficiently directly from the chart. The indicator displays detailed daily, weekly, monthly, and yearly trading statistics in a clean and professional interface without slowing down the platform. It is optimized for low resource usage and suitable for manual traders, scalpers, swing traders, a
FREE
Candle Close Timer Matrix – MT5 Candle Countdown Indicator Candle Close Timer Matrix is a lightweight and powerful MetaTrader 5 (MT5) candle countdown indicator that shows exactly how many minutes and seconds are left before the current candle closes on any symbol and any timeframe. Download MT5 EA Products Whether you are a scalper , intraday trader or swing trader , knowing the exact candle close time helps you: Time your entries on candle close Avoid impulsive mid-candle decisions Sync your t
FREE
Title:FX-AIEA Supply and Demand Zone Indicator (MT5) — Technical Overview Version: 2.51 | Platform: MetaTrader 5 Introduction Supply and demand zones are considered a core manifestation of institutional order flow, providing a more direct reflection of buying and selling pressure than traditional support/resistance levels. This indicator attempts to automate the identification of high-probability supply and demand zones using an adaptive ZigZag algorithm, reducing the subjectivity and time asso
• Please test the product in the Strategy Tester before purchasing to understand how it works. • If you face any issues, contact me via private message—I’m always available to help. • After purchase, send me a screenshot of your order to receive a   FREE EA   as a gift. Introducing the Star Path Stochastic Cross Indicator Ready to explore your trading potential? The Star Path Stochastic Cross Indicator is here to guide your path. Designed for traders who love flexibility, this indicator is not
Индикатор Detector Fix. Валютные пары никогда не растут и не падают по прямой. Их подъемы и падения перемежаются откатами и разворотами. Каждый рост и каждое падение отражается и на вашем эмоциональном состоянии: надежда сменяется страхом, а когда он проходит, снова появляется надежда. Рынок использует ваш страх для того, чтобы не дать вам воспользоваться сильной позицией. В такие моменты вы наиболее уязвимы. Все изменится, если вы будете использовать индикатор Detector Fix.  Индикатор Detec
RSI Pro Ar Brain — classic RSI with a brain A standard RSI gives the same signals on every timeframe and every asset — and that is exactly why it often fails. On volatile crypto it always “screams” overbought; on calm gold it “falls asleep” in the neutral zone. RSI Pro Ar Brain rethinks the classic oscillator: the indicator automatically adjusts to the current timeframe and the real volatility of the instrument, filters out the noise and only gives signals where they actually make sense. Key
Испытайте повышенную точность торговли с CM Ultimate MA MTF MT5, сложным индикатором скользящей средней, разработанным исключительно для MetaTrader 5. Этот индикатор идеально подходит для трейдеров, стремящихся интегрировать многовременной анализ в свои стратегии, предоставляя ценные сведения о рыночных трендах и движениях цен. CM Ultimate MA MTF MT5 предлагает конкурентное преимущество, позволяя пользователям визуализировать ключевые рыночные сигналы через настраиваемые скользящие средние. Неза
Previous Candle Levels MT5
Wachinou Lionnel Pyrrhus Sovi Guidi
1 (1)
Previous Candle Levels MT5 shows the previous candle levels, it shows the previous candle Open High Low Close levels (OHLC Levels) in different time frame. It's designed to help the trader to analyse the market and pay attention to the previous candle levels in different time frame.  We all know that the OHLC Levels in Monthly, Weekly and Daily are really strong and must of the time, the price strongly reacts at those levels. In the technical analysis, the user can use them as a support and res
FREE
Trend Monitor VZ – Системный мониторинг рынка на основе структуры тренда. Если вы анализируете несколько инструментов, проверка направления тренда может занимать много времени. Trend Monitor VZ собирает всю эту информацию в одной панели и показывает направление тренда сразу по нескольким инструментам и таймфреймам. Весь рынок перед глазами На графике появляется монитор рынка, который показывает направление тренда по выбранным инструментам и таймфреймам. Направление определяется по структуре рын
BTC/USD  SCALPING スキャルピング型EA こちらは仮想通貨向け自動売買プログラムとなっております。 シグナル公開予定 通貨ペア :BTC/USDに最適なナンピン及び利確設定をしております ロット数:0.01~ パラメータ ・ロット数:最初の注文ロット数を入力してください。これを基準に、ナンピンに増加していきます。 ・ナンピン:ONにするとナンピンを行いますので、ONにしてご利用ください。 ポジション数: 最大21ポジション 時間足 :M1 注文条件 ・EA起動後、一定の値動きで逆張りを行います。 ・100BTC/USDごとにナンピンを行います。(ただし証拠金維持率が500%以上のあいだ) ・一定の利益にて全決済を行います。 その他 ・マーチングゲールではありませんが、ナンピンを行うため、ある程度のリスクがございます。 ・証拠金は1000USD以上を推奨しております。
ToolBox 360 is the swiss knife of all indicators. It is full packed with useful tools to help you with your trading. It can be used to find best entry and exit points and help you to decide if you should open a trade or not. It shows market trends, candlestick formations outside / inside bars and you can sett time based allerts. Main features: Time based Fibonacci lines Choose a start and end time and the indicator shows you Fibonacci lines within the selected time range including range high a
Vertex Structure Dashboard delivers a complete multi-timeframe market structure analysis in a single, compact panel. It monitors up to 9   timeframes simultaneously and displays trend bias, structural breaks, momentum, and value zones in real time — no tab-switching, no manual   tracking.   The panel is fully draggable and collapsible. Its position persists across timeframe changes through GlobalVariables, so your layout stays   exactly where you placed it.   How It Works   Each enabled tim
Уникальный индикатор, реализующий профессиональный и количественный подход к торговле на возврате к среднему. Он использует тот факт, что цена отклоняется и возвращается к среднему предсказуемым и измеримым образом, что позволяет использовать четкие правила входа и выхода, которые значительно превосходят неколичественные торговые стратегии. [ Installation Guide | Update Guide | Troubleshooting | FAQ | All Products ] Четкие торговые сигналы Удивительно легко торговать Настраиваемые цвета и разме
Overview SDZ Trend Pro is a professional Expert Advisor work for all symbol, recommend  XAUUSD (Gold) trading on the H1 timeframe . It combines dynamic price action patterns, EMA filters, and strict session-based trading logic to identify precise market entries with optimal risk control. This EA is ideal for traders who prefer structured, time-filtered trading during active market hours. ️ Core Features Dynamic Stop Loss (SL) logic Automatically sets SL based on candle pattern Chooses the
Индикатор Ultimate Boom and Crash Индикатор Ultimate Boom and Crash – это передовой инструмент, разработанный Coetsee Digital, предназначенный для выявления потенциальных всплесков на рынке. Создан для трейдеров, работающих с синтетическими рынками Deriv и Weltrade. Индикатор оптимизирован для работы исключительно на таймфреймах 3 минуты (M3), 5 минут (M5), 15 минут (M15), 30 минут (M30) и 1 час (H1) и поддерживает только следующие пары: PainX 1200, PainX 999, PainX 800, PainX 600, PainX 400, G
Xauusd Session Momentum is a quantitative day-trading Expert Advisor built specifically for Gold (XAUUSD) on the M5 timeframe. The EA captures high-velocity directional breakouts during the New York market open while utilizing dynamic ATR expansion filters to eliminate low-volatility consolidation chop. Core Strategy Features: Multi-Timeframe Trend Filter: Trades strictly in alignment with the higher-timeframe trend (H1 & M15 EMAs). Volatility Expansion Engine: Requires M5 ATR to expand 15% abov
Session Indicator — Forex Trading Sessions Visualizer Overview Session Indicator   is a professional MT5 indicator that displays the four major forex trading sessions (Sydney, Tokyo, London, New York) as colored horizontal bands on your chart. Never miss a trading session again! Free Product   |   Works on Any Broker   |   Auto-Detects Timezone Features Auto-Detects Broker GMT Offset Works automatically on any MT5 broker (XM, IC Markets, FXCM, etc.) No manual timezone configuration needed Label
FREE
Currency Strength Monitor is a professional multi-currency strength indicator for MetaTrader 5 that analyzes and displays the relative strength of 8 major currencies (USD, EUR, GBP, AUD, NZD, JPY, CHF, CAD) in real-time. The indicator calculates strength values by aggregating price movements across 28 currency pairs and normalizing them using ATR, providing traders with a clear visual representation of which currencies are strengthening or weakening. Key Features: Multi-Currency Analysis — Monit
Entry Points Pro — топ-1 индикатор по количеству отзывов (более 600 отзывов и более 28 000 скачиваний демо обеих версий). Индикатор даёт самые перспективные точки входа в сделки без перерисовки на любых инструментах. Индикатор покажет заранее стрелкой точку входа в сделку, укажет цену входа и нарисует на графике уровень входа и стопа, а так же рассчитает рабочий лот под твой депозит и риск, а панель статистики поможет выбрать самый перспективный инструмент и таймфрейм .  Тебе остаётся поставить
PBX US30 M1 Pro — это профессиональная технология скальпинга по индексу US30, разработанная для серьезных трейдеров, готовых к риску. Ее цель — достижение точного, строгого исполнения и профессионального управления. PBX US30 M1 Pro — это профессиональная автоматизированная торговая система, созданная специально для платформы MetaTrader 5 (MT5), ориентированная на внутридневной скальпинг по индексу US30 (индекс Доу Джонса). В основе системы лежит отработанная модель трендовой торговли PBX (Wat
С этим продуктом покупают
Trend Sniper X
Sarvarbek Abduvoxobov
4.86 (42)
Trend Sniper X — это трендовый индикатор для MetaTrader 5, работающий на нескольких таймфреймах, который помогает трейдерам точно и ясно определять направление тренда и потенциальные точки разворота. для MT4: https://www.mql5.com/en/market/product/193245 Информация о цене: Текущая цена является промо-ценой и может измениться по мере выхода предстоящих обновлений и новых функций. Бонусное предложение: Чтобы получить БЕСПЛАТНЫЙ авто-трейд советник Assistant EA для этого индикатора, пожалуйста, на
Новый король в городе — Индикатор + управление ордерами (TP1 + TP2 + TP3) + опциональный Telegram-сигнал-сендер ВКЛЮЧЁН (БЕСПЛАТНО) (ПОЛНОЦЕННАЯ ТОРГОВАЯ И СИГНАЛЬНАЯ СИСТЕМА) Gold Slayer EA Этот индикатор включает в себя продвинутую стратегию, торговую систему с настраиваемым управлением ордерами и систему mean reversion, которая сочетает расширения Envelope и поддерживается несколькими интеллектуальными фильтрами подтверждения, такими как RSI, для поиска высоковероятных точек разворота с сигн
Smart Trend Trading System — MetaTrader 5 После покупки напишите мне на MQL5, чтобы БЕСПЛАТНО получить Smart Universal Expert Advisor, а также доступ к онлайн-курсу, руководство в формате PDF и доступ к закрытой группе. STTS объединяет направление тренда, сигналы входа и выхода, зоны разворота и важные ценовые уровни прямо на графике. Торгуйте по системе вручную или подключите отдельный совместимый советник для автоматического исполнения с выбранными вами настройками. ОДНА СИСТЕМА. ЧЕТЫРЕ ТОРГОВ
Получите своё торговое преимущество в поле зрения! M5 Sniper — это новый индикатор от MeanFX. Он сочетает точные торговые сигналы с адаптивными уровнями TP/SL — в результате создавая лучшие возможные статистические сделки! Цена увеличивается каждые 5 покупок, следующая цена — 69$ Напишите мне после покупки, чтобы получить советы/руководство и бонусного EA Что выделяет его среди других? Проверенная статистическая эффективность на Gold XAUUSD ( работает практически на каждом активе , с акцентом н
SuperScalp Pro
Van Minh Nguyen
4.54 (37)
SuperScalp Pro - Professional Multi-Layer Confluence Scalping System SuperScalp Pro — это продвинутый индикатор для скальпинга, который расширяет возможности классического Supertrend с помощью нескольких интеллектуальных фильтров подтверждения. Он помогает выявлять торговые возможности Buy/Sell с более высокой вероятностью успеха и значительно сокращать количество ложных сигналов. Чёткие стрелки Buy и Sell отображаются непосредственно на графике вместе с автоматически рассчитываемыми в реальном
SMC Intraday Formula
VividMind Digital Solutions
5 (26)
Давайте сначала будем честны. Ни один индикатор сам по себе не сделает вас прибыльным. Если кто-то говорит вам обратное — он продаёт вам мечту. Любой индикатор, который показывает идеальные стрелки покупки/продажи, можно сделать безупречным — просто увеличьте нужный участок истории и сделайте скриншот успешных сделок. Мы так делать не будем. SMC Intraday Formula — это инструмент. Он считывает структуру рынка за вас, определяет зоны с наивысшей вероятностью движения цены и точно показывает, как
Auto Optimized SpeedAngle — это система векторизации импульса институционального уровня, которая исключает подгонку под исторические данные (curve-fitting) за счет непрерывной форвард-оптимизации (Walk-Forward Optimization, WFO). Вместо того чтобы полагаться на статические входные параметры, которые теряют эффективность при смене рыночных режимов, индикатор динамически перекалибрует свои настройки, используя валидацию на вневыборочных данных (Out-of-Sample, OOS). Это гарантирует, что отображаемы
Gann Made Easy   - это профессиональная, но при этом очень простая в применении Форекс система, основанная на лучших принципах торговли по методам господина У.Д. Ганна. Индикатор дает точные BUY/SELL сигналы, включающие в себя уровни Stop Loss и Take Profit. ПОЖАЛУЙСТА, СВЯЖИТЕСЬ СО МНОЙ ПОСЛЕ ПОКУПКИ, ЧТОБЫ ПОЛУЧИТЬ ТОРГОВЫЕ ИНСТРУКЦИИ И ОТЛИЧНЫЕ ДОПОЛНИТЕЛЬНЫЕ ИНДИКАТОРЫ БЕСПЛАТНО! Вероятно вы уже не раз слышали о торговли по методам Ганна. Как правило теория Ганна отпугивает от себя не только
ARIPoint
Temirlan Kdyrkhan
1 (4)
ARIBot is a powerful trading companion designed to generate high-probability entry signals with dynamic TP/SL/DP levels based on volatility. Built-in performance tracking shows win/loss stats, PP1/PP2 hits, and success rates — all updated live. Key Features: Buy/Sell signals with adaptive volatility bands Real-time TP/SL/DP levels based on ATR Built-in MA Filter with optional ATR/StdDev volatility Performance stats panel (Success, Profit/Loss, PP1/PP2) Alerts via popup, sound, push, or email Cus
Adaptive Price Action Engine Купи индикатор — получи советник (EA) к нему бесплатно Самооптимизирующийся мульти-таймфреймовый анализ тренда и свечных моделей Рынок постоянно меняется — и не каждая модель Price Action имеет одинаковую ценность в разных рыночных режимах. Adaptive Price Action Engine создан для адаптации к изменяющимся рыночным условиям, объединяя трендовую структуру, мульти-таймфреймовый анализ, свечные модели и статистическую оптимизацию в единой аналитической системе. Два адапти
M1 SNIPER   — это простая в использовании торговая система. Это стрелочный индикатор, разработанный для тайм фрейма M1. Индикатор можно использовать как отдельную систему для скальпинга на тайм фрейме M1, а также как часть вашей существующей торговой системы. Хотя эта торговая система была разработана специально для торговли на M1, ее можно использовать и с другими тайм фреймами. Первоначально я разработал этот метод для торговли XAUUSD и BTCUSD. Но я считаю этот метод полезным и для торговли на
Следующее обновление — версия 2.52 уже скоро! [НОВОЕ] Приготовьтесь к 4 новым важным функциям, призванным улучшить ваш анализ рынка и торговый процесс. Мы выводим анализ рынка на новый уровень с помощью 4 новых функций, разработанных с учётом ваших потребностей в трейдинге. Представляем: 1. TRADE OVERVIEW DASHBOARD 2. CONFLUENCE AT ZONE 3. STRONG & WEAK HIGH/LOW 4. OTE 1. TRADE OVERVIEW DASHBOARD Панель, которая помогает легче понимать общую картину рынка, предоставляя рекомендации для поддержк
Boba Analysis Suite
Trade Ready Solutions LLC
5 (2)
Boba Analysis Suite Boba Analysis Suite — аналитический индикатор для MetaTrader 5. Он объединяет структуру рынка, значимые ценовые зоны и общий рыночный контекст в одном представлении на графике. Индикатор разработан на основе практического опыта трейдера и наставника по трейдингу. Он помогает выстроить последовательный процесс анализа: оценивать направление рынка, определять важные уровни и рассматривать несколько таймфреймов в совокупности. Анализ с учётом контекста Значение отдельных сигнало
FiboSniper Pro – Multi-Filter Fibonacci System with Auto SL/TP and Control Panel FiboSniper Pro — это технический индикатор, который объединяет динамические Fibonacci Envelopes с несколькими фильтрами подтверждения для формирования отборных сигналов Buy и Sell. Уровни Fibonacci рассчитываются на основе Moving Average и ATR, а затем фильтруются с помощью ADX, EMA, RSI, ATR, Volume, Time и структуры свечи. Индикатор отображает на графике автоматические уровни Stop Loss и Take Profit на основе ATR,
Break and Retest Hunter is a powerful MetaTrader 5 indicator designed to automatically identify support and resistance levels, breakout structures, and potential retest opportunities in real time. Bonus Indicator: After purchasing Break and Retest Hunter , contact me to receive Trade Indicator Assistant EA completely free as a bonus utility. $65 for the next 10 copies . Next price is $120.  Combining adaptive market analysis, clear BUY/SELL signals, Fibonacci-based profit targets, and a premiu
Trend Catcher   анализирует движения рыночных цен, используя комбинацию собственных и индивидуально разработанных адаптивных индикаторов анализа тренда. Он определяет истинное направление рынка, отфильтровывая краткосрочные шумы и фокусируясь на силе импульса, расширении волатильности и поведении ценовой структуры. Он также использует комбинацию сглаживающих и фильтрующих тренд индикаторов, таких как скользящие средние, RSI и фильтры волатильности. Мониторинг реальных операций, а также другие
Power Candles V3 — самооптимизирующийся индикатор силы Power Candles V3 преобразует силу валюты и инструмента в готовый к использованию торговый план на каждом графике, к которому он прикреплен. Вместо того, чтобы просто раскрашивать свечи, он выполняет автоматическую оптимизацию в режиме реального времени в фоновом режиме и предоставляет вам оптимальные значения Stop Loss, Take Profit и порог сигнала для выбранного вами символа. Один клик — и все готово для реальной торговли: на графике появляю
Neuro Poseidon - новый индикатор от Дарьи Резуевой. Он сочетает точные торговые сигналы с адаптивными уровнями TP/SL , в результате создавая максимально выгодные сделки! TO SWITCH TO   ENG   PLEASE CHOOSE IT IN THE UPPER-RIGHT CORNER OF THE WEBSITE Напишите мне и получите  Neuro Poseidon Assistant  в подарок для автоматизации вашей торговли! Что отличает его от других индикаторов? 1. Доказанная прибыльность на всех активах и таймфреймах 2. На графике присутствуют только подтвержденные сигналы н
Unix Scalper — MetaTrader 5 После покупки напишите мне на MQL5, чтобы БЕСПЛАТНО получить Smart Universal Expert Advisor, а также доступ к онлайн-курсу, руководство в формате PDF и доступ к закрытой группе. Найдите торговую ситуацию. Оцените план. Выберите способ торговли. UNIX Scalper объединяет анализ рынка, решения BUY/SELL/WAIT и уровни Entry, Stop Loss, TP1 и TP2 в одной удобной панели. УВИДЬТЕ СИГНАЛ И ТОРГОВЫЙ ПЛАН • Понятные решения: BUY, SELL или WAIT. • Определённые уровни: Entry, Stop
Представляем       Quantum Breakout PRO   , новаторский индикатор MQL5, который меняет ваш способ торговли в зонах прорыва! Разработан командой опытных трейдеров со стажем торговли более 13 лет,       Квантовый прорыв PRO       разработан, чтобы поднять ваше торговое путешествие к новым высотам с его инновационной и динамичной стратегией зоны прорыва. Quantum Breakout Indicator покажет вам сигнальные стрелки на зонах прорыва с 5 целевыми зонами прибыли и предложением стоп-лосса на основе поля
FX Trend NG: Следующее поколение интеллектуального анализа трендов на разных рынках Обзор FX Trend NG — это профессиональный инструмент анализа трендов и мониторинга рынка с поддержкой нескольких таймфреймов. Он позволяет за секунды получить полное структурное понимание текущего состояния рынка. Вместо переключения между десятками графиков вы мгновенно видите, какие инструменты находятся в тренде, где импульс ослабевает и где наблюдается сильная синхронизация между таймфреймами. Специальное пр
Мультивалютный индикатор силы и импульса MT5 Dynamic Forex28 Navigator — это развитие наших давних популярных индикаторов, объединяющее силу трёх в одном: Advanced Currency Strength28 Indicator (700 отзывов) Advanced Currency IMPULSE with ALERT (530 отзывов) CS28 Combo Signals (недавний бонус) Оба индикатора-предшественника вместе получили более 1,200 отзывов на MQL5 Market и с 2016 года являются неотъемлемой частью сообщества MT4. Dynamic Forex28 Navigator MT5 переносит ту же проверенную логику
Scalper Vault — это мощная, полноценная торговая система, созданная для трейдеров, которые стремятся к стабильным результатам в внутридневной торговле. Этот высокоточный индикатор представляет собой комплексное, самостоятельное торговое решение, обеспечивающее аналитику профессионального (институционального) уровня как для торговли на рынке Forex, так и для работы с бинарными опционами. Пожалуйста, свяжитесь со мной после покупки, чтобы получить мои торговые советы, а также отличный бонус! Исклю
Volatility Master for MetaTrader is a real-time dashboard tool that scans up to  50 symbols  to identify high-volatility , trending markets instantly. With bullish/bearish signals, customizable alerts, and a user-friendly interface, it helps you avoid range-bound conditions and focus on high-probability trades. Clarity leads to confidence. Trade confidently and protect your capital effectively with this powerful dashboard. We don't offer free or bonus indicators in exchange of reviews from you.
Apex Patterns PRO Купите индикатор — получите Expert Advisor на его основе БЕСПЛАТНО. Самооптимизирующаяся система анализа графических паттернов и пробоев Традиционные сканеры паттернов полагаются на фиксированные входные параметры, что часто приводит к снижению их эффективности при изменении рыночной волатильности и структуры. Apex Patterns PRO разработан для адаптации к меняющимся рыночным условиям, объединяя распознавание структурных графических паттернов, фильтрацию по моментуму и статистич
SR Liquidity   — это торговый индикатор, предназначенный для выявления скрытых зон, где концентрируется рыночная ликвидность и наблюдается наиболее сильная реакция цены. Эти особые зоны ликвидности выступают в качестве мощных уровней поддержки и сопротивления, предоставляя вам четкую картину того, где с наибольшей вероятностью произойдет разворот рынка. Вместо построения стандартных линий поддержки и сопротивления, индикатор SR Liquidity анализирует реальное поведение цены, выявляя зоны концентр
OrderFlux – Индикатор Order Flow Footprint Chart, Volume Profile и Market Profile для MetaTrader 5 OrderFlux — это индикатор Order Flow Footprint для MetaTrader 5, который наглядно показывает, что происходит внутри каждой свечи. Он раскрывает отдельную свечу и отображает объём торгов на каждом ценовом уровне, разделяя агрессивные покупки и агрессивные продажи. На основе тиковых данных в реальном времени строится полноценный Footprint Chart с Delta, Imbalance, Absorption, Volume Profile, Market P
Этот индикатор является уникальным, качественным и доступным инструментом для торговли, включающим в себя наши собственные разработки и новую формулу. В обновленной версии появилась возможность отображать зоны двух таймфреймов. Это означает, что вам будут доступны зоны не только на старшем ТФ, а сразу с двух таймфреймов - таймфрейма графика и старшего: отображение вложенных зон. Обновление обязательно понравится всем трейдерам, торгующим по зонам спроса и предложения. Важная информация Для макс
Precision Spike Detector
Francisco Mandomo Simbine
5 (2)
Precision Spike Detector V3 – Institutional-Grade AI Trading System Attention: The price increases by US$50 for every 10 purchases.  Final price: US$599 Precision Spike Detector V3   is a   state-of-the-art, institutional-grade market analysis system   for   MetaTrader 5 , designed to detect   high-probability market movements   in synthetic indices such as   Boom, Crash, GainX, and PainX . After purchase, send me a private message to receive the optimized configuration files,  the installation
Matreshka
Dimitr Trifonov
5 (2)
Самотестируемый и самооптимизируемый и ндикатор Matreshka: 1. Я вляется интерпретацией Теории Волнового Анализа Элиотта. 2. За основу взят принцип индикатора типа ZigZag, а волны строятся на принципе интерпретации теории ДеМарка. 3. Фильтрует волны по длине и высоте. 4. Рисует до шести уровней ZigZag одновременно , отслеживая волны разных порядков. 5. Отмечает Импульсные и Откатные волны. 6. Рисует стрелки для открытия позиций 7. Рисует три канала. 8. Отмечает уровни поддержки и сопротивления. 9
Другие продукты этого автора
The primary function of this script, Tick Data Exporter , is to efficiently extract historical tick data. Tick data represents the most granular level of market data, capturing every single price change. The script downloads this data from a broker and formats it into CSV files for external quantitative analysis. Five things tick data shows that bars permanently hide: Spread microstructure: Bars give you one spread number per period (typically the spread at bar close). Ticks show you the sprea
News Markers Description Version: 1.13Type: MetaTrader 5 indicator (chart window) Purpose: Plots economic-calendar news events as color-coded vertical lines on the chart, with optional currency tags and an upcoming-news HUD panel. Before you start — three things that always apply Live connection required. The data comes from MT5's built-in economic calendar via your broker's feed. It returns nothing in the Strategy Tester, and nothing if your broker doesn't serve calendar data. If no lines appe
FREE
What Is Fibonacci Pilot Mini? Fibonacci Pilot Mini is a semi-automatic Expert Advisor for MetaTrader 5. It assists the trader in placing Fibonacci-based trades by automating the mechanical steps after the trader has identified the swing. The trader performs the analysis; the EA handles lot sizing, entry price calculation, stop loss, take profit levels, and order placement. Mini is the streamlined single-setup edition of Fibonacci Pilot Pro. It runs one trade setup at a time with a clean, minima
FREE
The Simple Manual Trading Panel (v2.11) Is a professional trade management tool designed with a clean, movable UI to streamline manual execution and automated exit strategies. Core Features Dynamic Visual Interface: A movable GUI panel that provides real-time information including a bar countdown timer, live spread, and advanced volume analysis. Flexible Lot Size setting, with 2 decimals (If broker supports it). Multi-Stage Take Profit: Supports three distinct Take Profit (TP) levels in either
Trend Matrix Panel is a multi-timeframe technical indicator for MetaTrader 5 that compresses an entire trading session's structural picture into a single panel. Rather than flipping between charts to read M1, M15, H1, and D1 separately, the panel shows the trend state of three configurable moving averages across twelve timeframes simultaneously, with a heatmap that draws your eye to the genuinely strong signals and away from noise. The core idea is simple: every cell in the matrix tells you how
This script is an Intelligence Gathering Utility designed to give you full control over your data exports from MetaTrader 5. It allows you to synchronize up to three different symbols into a single file with precise timestamping. 1. Setting the Data Range (Range) You can define exactly which historical period you want to capture: Date Mode : If Last N bars (0 = use date range above) is set to 0 , the script will export all data between your chosen start and end dates. Bar Mode : By entering a nu
Fibonacci Pilot Pro Overview The EA functions as a comprehensive, panel-driven Fibonacci trading ecosystem designed to bridge the gap between manual chart analysis and fully automated algorithmic execution. Dual Execution Modes: It operates as both a visual trade assistant for manual trading and a fully autonomous robot. In manual mode, you plot Point A and Point B on the chart to instantly visualize risk/reward zones and limit entries before executing. In auto mode, it scans for market struc
Фильтр:
Нет отзывов
Ответ на отзыв