FVG Multi TimeFrame Levels

FVG Multi TimeFrame Levels — Indicator Overview

What it is

A multi-timeframe Fair Value Gap detector and analysis tool for MetaTrader 5. It scans price action across up to four configurable timeframe "slots" simultaneously, identifies gaps that meet a configurable significance threshold, draws them as boxes on the current chart, and tracks how each gap behaves over its lifetime — whether it gets tested, how deeply, how often, and ultimately whether it gets filled or swept beyond.

It runs alongside live price action without interrupting it; nothing it draws is interactive or order-related. It is a read-only analytical tool — it tells you where the levels are and what state they're in. Trading decisions remain yours.

What a Fair Value Gap is, and why it matters

A Fair Value Gap (FVG) is a three-bar pattern where the body of an impulse move leaves a price range that no candle's wick fully overlaps. Strict definition: for three consecutive bars older → impulse → newer, the older bar's high sits below the newer bar's low (bullish FVG), or the older bar's low sits above the newer bar's high (bearish FVG). The "gap" is the unfilled price band between them.

These gaps matter because price often returns to them. The impulse move that created the gap was fast enough that no consensus price was established within that range; many participants didn't get to transact at those levels. When price drifts back, that range becomes a liquidity zone — an area where pending orders, stops, and re-entry interest concentrate. Traders who use the concept treat these zones as candidates for support/resistance, entry triggers, or stop-placement anchors.

Not every three-bar gap matters equally. A gap of half a pip on a quiet session is noise; a gap during an impulsive trend day is a level the market is likely to revisit. This indicator's purpose is to find the gaps that matter and track what happens to them.

The four-slot architecture

The indicator exposes four parallel detection slots. Each slot is independent and configurable: source timeframe, color, significance threshold, filter mode, depth-of-test sensitivity, label position. Slots are typically used in two complementary ways:

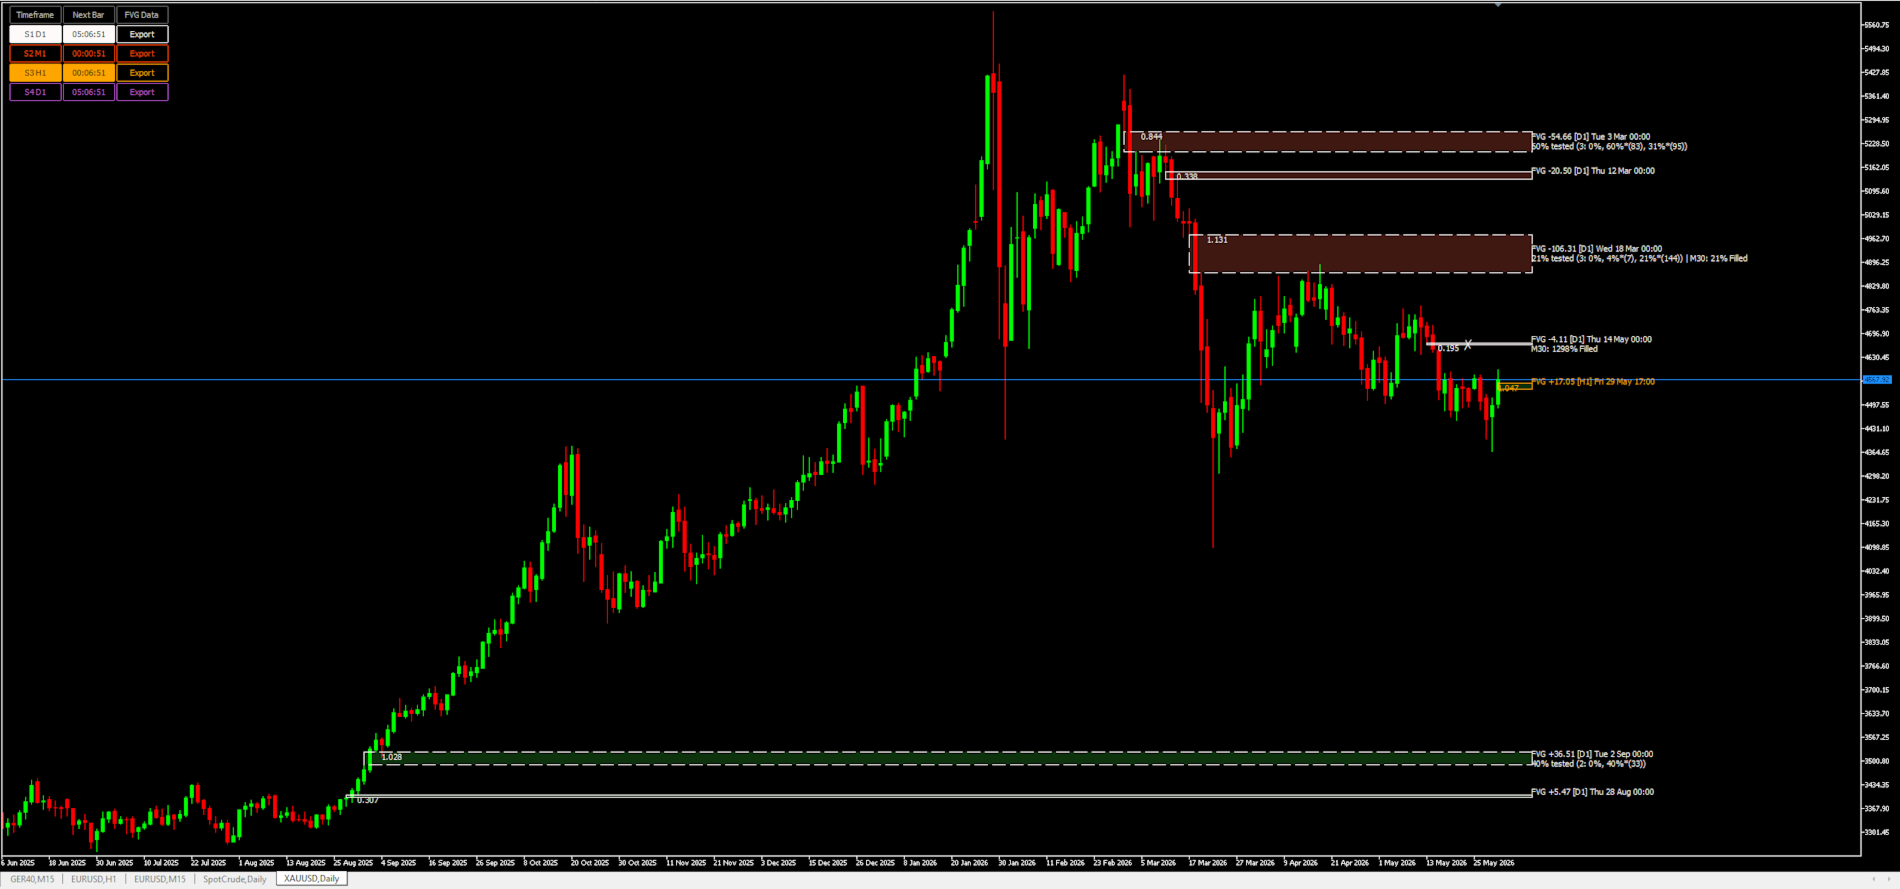
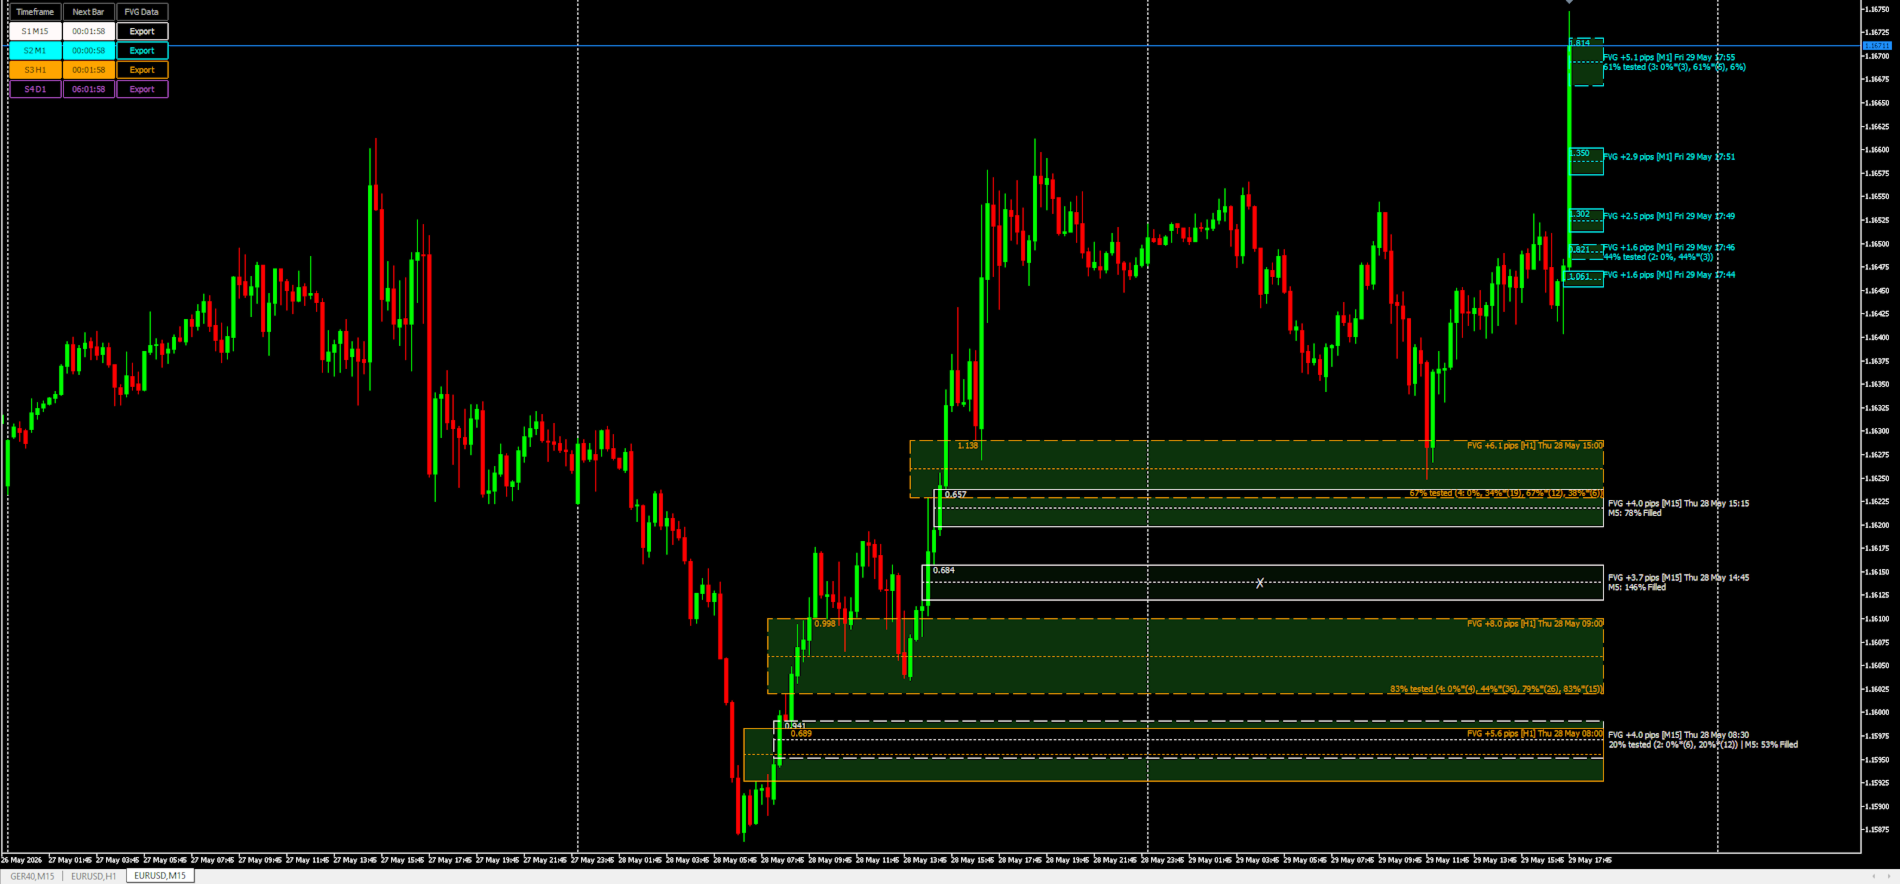
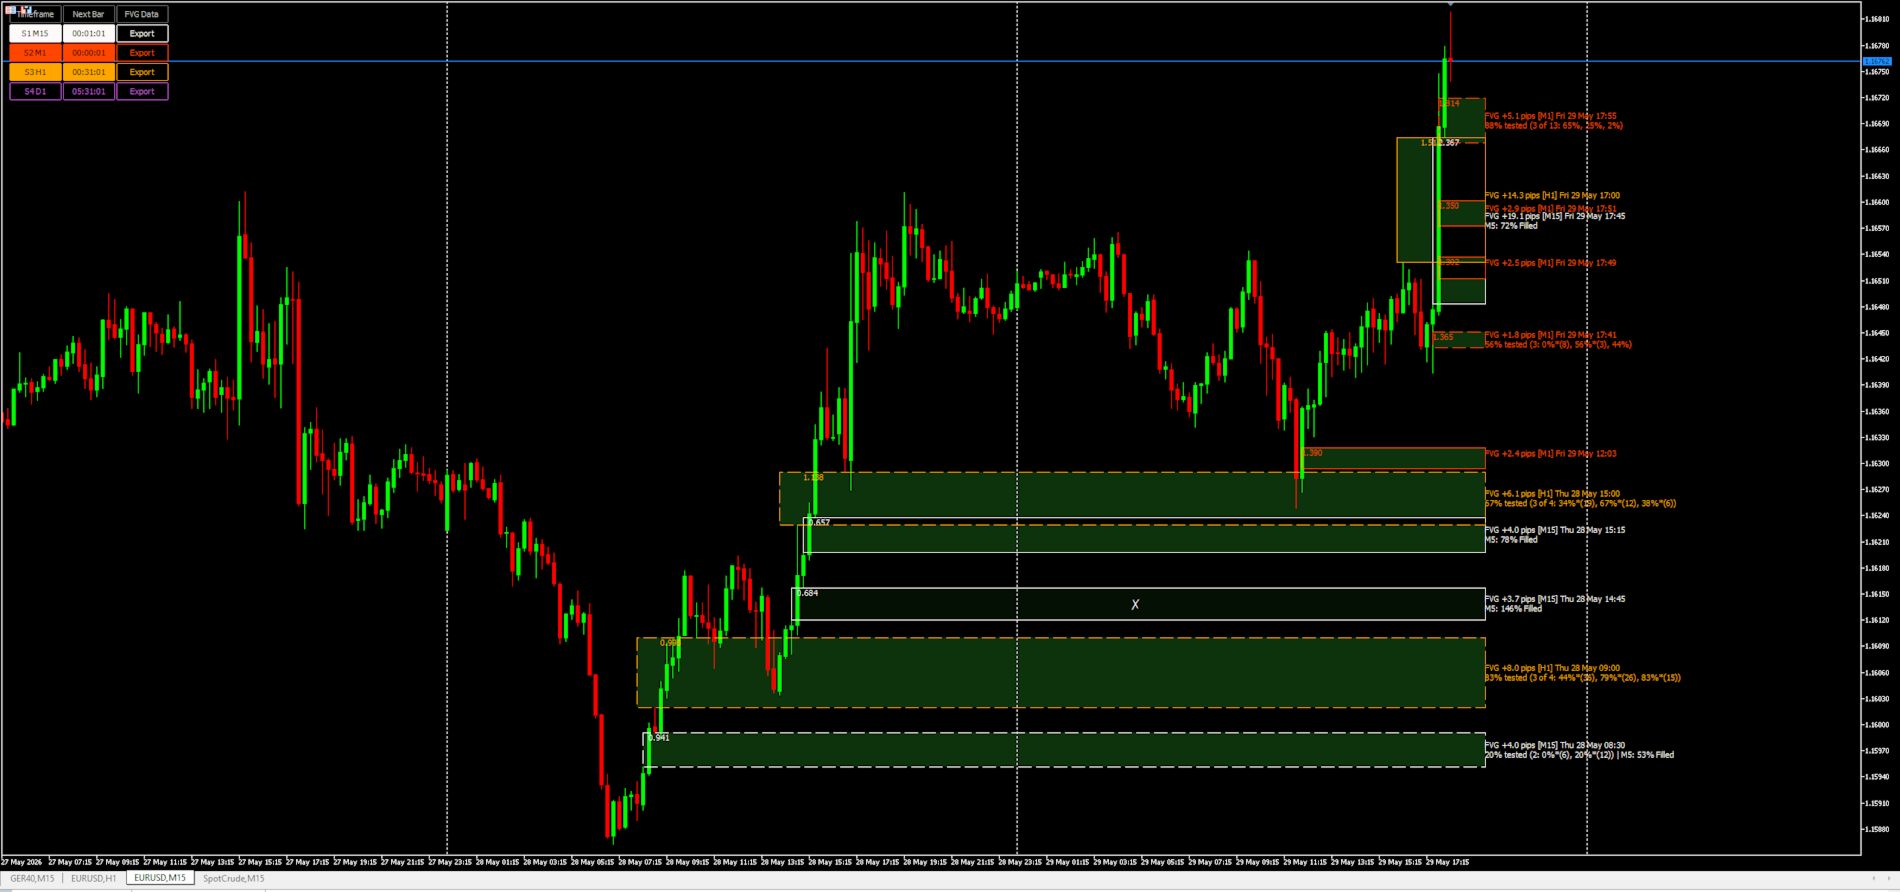
As different timeframes simultaneously. Slot 1 on the current chart's TF, slot 2 on H1, slot 3 on H4, slot 4 on D1. The chart then shows gaps from four time horizons at once, color-coded by slot. This is the canonical multi-timeframe view — you see the M15 gaps you might trade against, the H1 gaps that contextualize them, and the daily gaps that act as macro magnets.

As different significance horizons on the same timeframe. Four slots on H1, but each scoring gaps against a different volatility window (a "Sensitive" 8-bar ATR, a "Moderate" 21-bar, a "Conservative" 34-bar, and one manual). The same instrument is then judged against multiple time-scales of "what counts as a big move," and a gap that lights up in the Sensitive slot but stays dark in the Conservative one is telling you "significant relative to the last few hours, trivial against the broader regime."

These modes can mix. A slot is a configuration, not a fixed concept; the architecture is general.


How a gap is selected for display

A candidate gap goes through several gates before it appears on the chart:

1. Structural test. Three consecutive bars must form a strict, non-overlapping gap. If wicks overlap, no gap exists by definition, regardless of how the candles look to the eye. This is non-negotiable and tunes nothing.

2. Continuity check. The three bars must be temporally adjacent — no weekend gap, no session break. A "gap" between Friday's close and Monday's open isn't structural, it's calendar.

3. Significance score. Each candidate is given a score.

This normalizes the gap's size and the impulse candle's body against recent volatility. A score of 1.0 means the gap and body are roughly average for the prevailing volatility; 2.0+ means a clearly forceful move. The ATR window is configurable globally and per-slot.

4. Strictness gate. The score must clear a configurable threshold (0 = no filter, 100 = only the strongest gaps). The threshold maps linearly to a 0–2.5 score floor, so the slider directly controls what fraction of detected gaps survive.

5. Optional minimum-score post-filter. A second, absolute-score floor that layers on top of strictness. Where strictness is an abstract knob, this is in the same units as the visible per-box score — read the chart, decide where the noise sits, set the floor directly.

A gap that passes all five gates is added to the slot's display list, capped at a configurable maximum to prevent chart clutter.

What gets drawn for each gap

For each surviving gap, the indicator draws several elements:

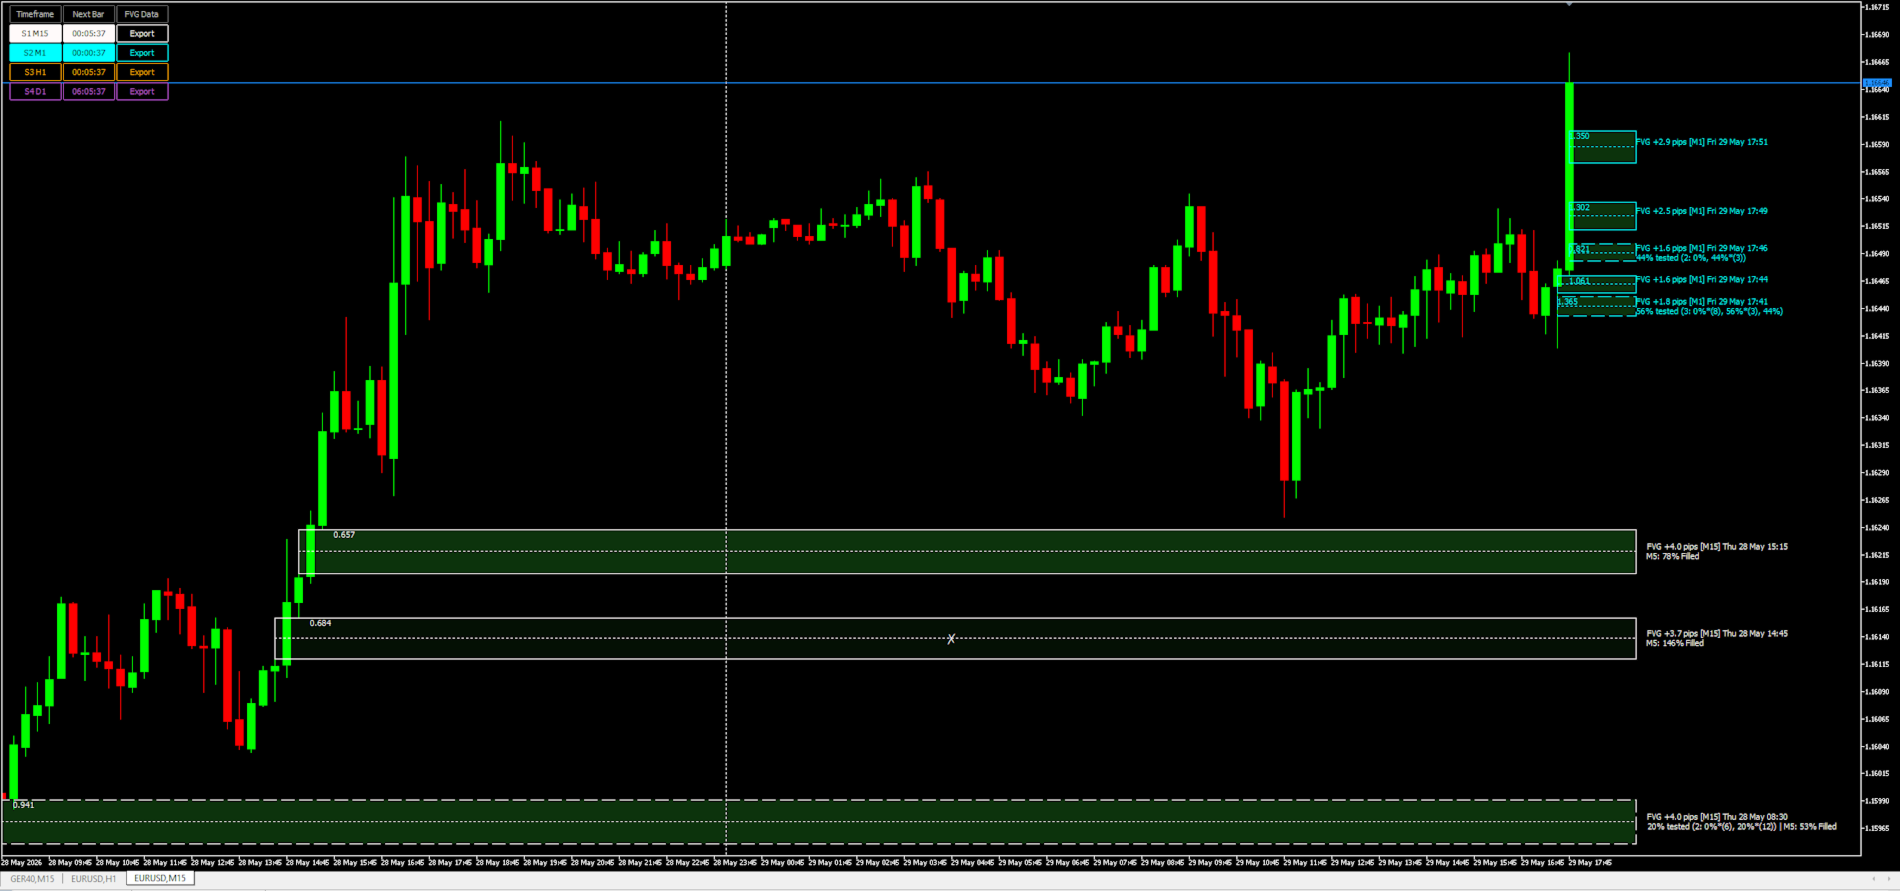
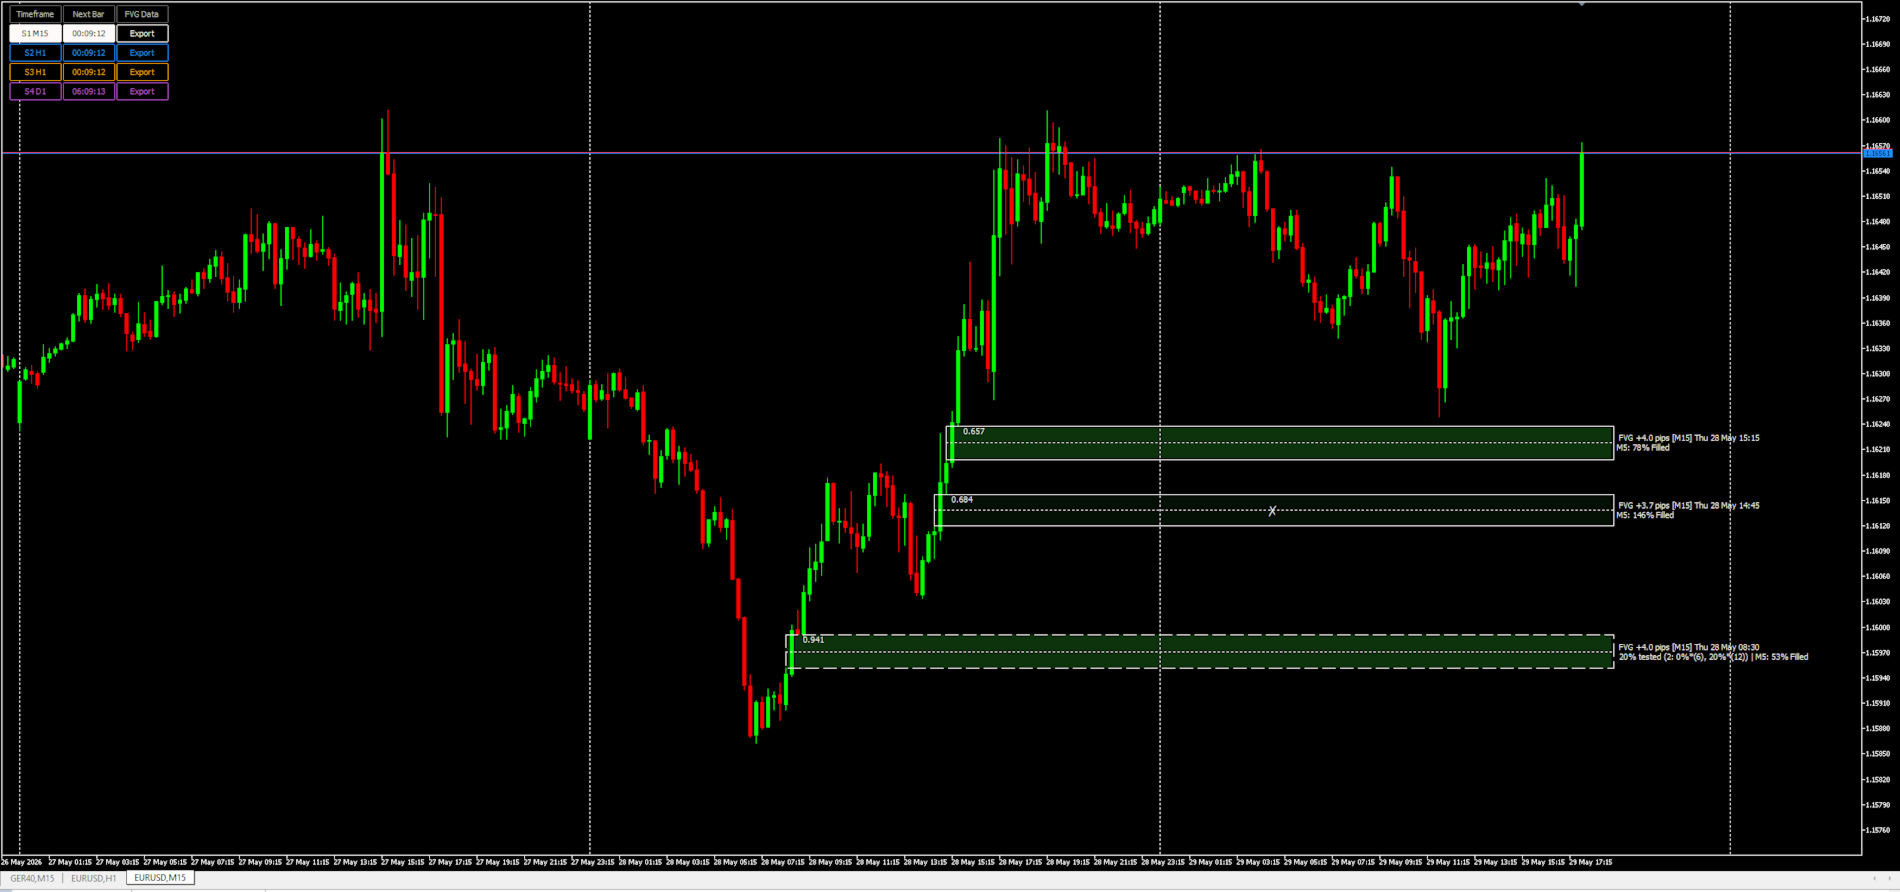
The box — a rectangle spanning the gap's price range (top to bottom) and time span (from the older bar's time, extending forward into current and future candles). The box border uses the slot's color; the border style indicates whether the gap has been tested (solid line) or remains untouched (dashed line, by convention).

An optional directional fill — a faint green or red tint inside the box marking bull/bear direction. Opacity is low so candles dominate the visual hierarchy.

An optional center line — a faint horizontal line at the gap's 50% midpoint, a common partial-fill target in some trading approaches.

An optional significance score — the gap's numeric score, drawn slot-colored inside the box at a configurable offset from the left edge. Reading this turns the abstract strictness control into a concrete per-gap readout.

The label — the gap's size in pips/price units, formation timestamp, the source timeframe tag, and (if any tests have happened) a test-history string showing how deeply each test penetrated and whether bars touched the gap multiple times within their span. Label position is configurable (next to, above, below, or stacked at multiple corners of the box).

A swept marker — when lower-timeframe analysis shows the gap has been filled past a configurable threshold, the box's fill fades sharply and a large centered symbol (default ✗) appears, telling the eye at a glance that this level is "spent."

How gap lifecycle is tracked

The indicator doesn't just detect gaps — it tracks them through their life:

Tested vs untested. Each new bar after a gap forms is checked for wick penetration. The first time a bar's wick crosses the touch-depth threshold (configurable from 1% — any penetration — to 110% — gap fully traversed and SL liquidity beyond it swept), the gap flips from untested to tested. The box style changes correspondingly. The test history label accumulates each touch event, showing depth and multiplicity.

Multi-touch detection. When a bar's range straddles the gap, the indicator does a tick-level scan (within the limits of MT5's tick history) to count how many distinct touches happened in that bar. A single bar can leave a * mark (touched once) or *(N) (touched N times) in the history. This catches bars that hammered a level repeatedly without it being obvious from the candle shape.

Lower-timeframe fill check. Optionally, each gap is checked against a lower timeframe — for example, an H1 slot can have its gaps re-examined on M5 across their full lifetime. This catches fills that the slot's own timeframe missed: an H1 gap that looks untouched on H1 might have been fully traversed by an M5 spike and an immediate reversion that didn't show in the H1 high/low. The deepest LTF penetration is recorded as a percentage; gaps past 100% are considered swept.

Fill removal. When a gap is fully filled (price closes through it on the slot's own timeframe), it's removed from the display list — the slot keeps a fixed quota of unfilled gaps visible, so the chart stays clean as new gaps form and old ones get consumed.

The HUD

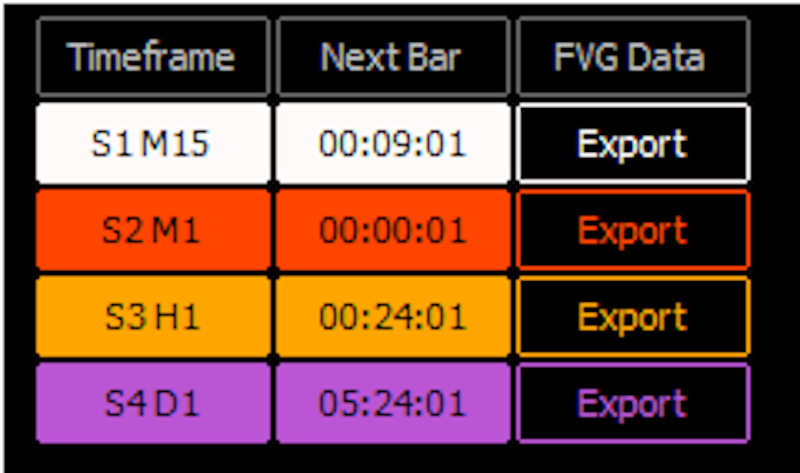
A small on-chart panel — anchored to a configurable corner — gives at-a-glance status and quick controls. Each slot has its own row showing:

Toggle button. Click to show/hide that slot's gaps without modifying input settings. The button shows the slot's source timeframe and reflects its current on/off state.

Countdown. Live countdown to the next bar close on the slot's timeframe. Useful when slots run different timeframes — tells you when each could next produce a new gap.

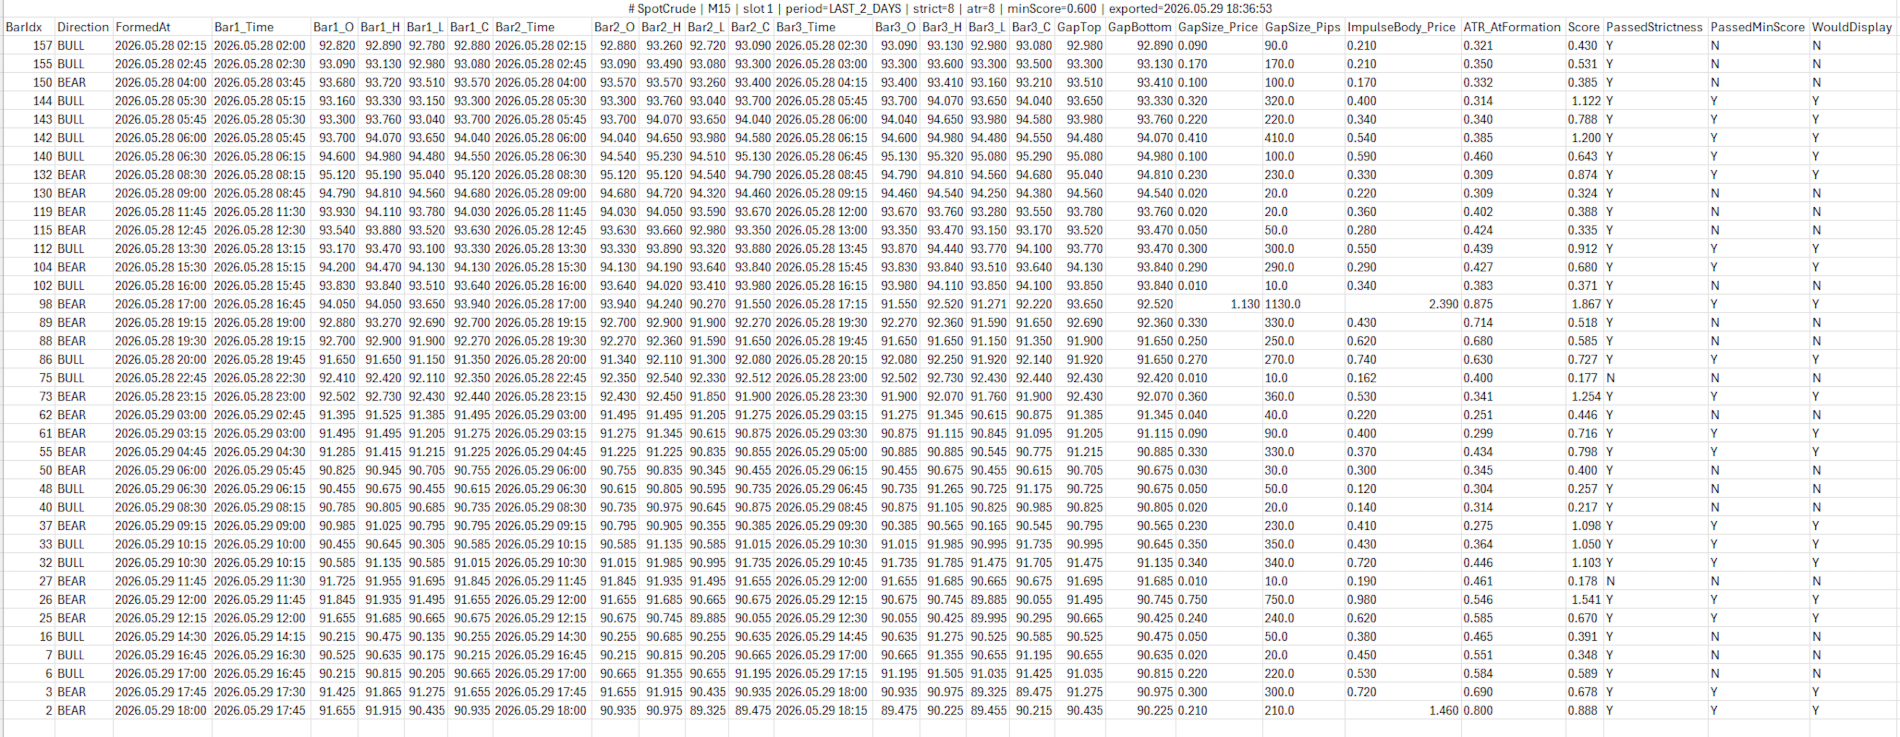
Export button. Triggers a one-shot deep re-scan over a configurable period (today / last 2 days / this week / last 2 weeks / this month / last N bars) and writes a CSV file containing every gap detected — including those filtered out by the current settings, with explicit flags for which gates each gap passed. Lets you analyze score distributions in Excel and choose filter thresholds from data rather than guesswork.

The HUD anchors cleanly to any of the four chart corners; column widths and offsets are configurable.

How the tool is intended to be used

The natural workflow has three phases:

1. Setup. Pick the timeframe arrangement that fits how you trade. Multi-TF if you analyze in layers; single-TF multi-horizon if you want one chart to show multiple interpretations of significance. Set colors, enable the in-box score display, pick a reasonable ATR mode.

2. Tuning. Run with the score visible. Watch how gaps score on the instruments and timeframes you actually trade. Set strictness loose at first to see the distribution; raise it (or set a minimum-score floor) once you can read the difference between meaningful gaps and noise. When you can't decide by eye, export to CSV and analyze the score distribution in Excel.

3. Daily use. With tuning settled, the indicator becomes background information. The boxes show you where levels are. The colors tell you which timeframe each level belongs to. Tested-vs-untested and swept markings tell you which levels are still potent and which are spent. The HUD lets you toggle slots in and out of view depending on what you're focused on.

The indicator does not generate signals, send notifications, or trade. It is a structural overlay; its value is making the FVG framework visible and tractable, so a trader who already uses the concept can use it more efficiently than they could by spotting gaps manually.

What the tool is not

  • It is not a strategy. The FVG concept does not work mechanically — a tested gap can hold or fail, and which one happens depends on context the indicator does not model (trend, session, news, higher-timeframe structure beyond what your slots capture).
  • It is not a real-time alerting system. There are no popups, sounds, or push notifications. The indicator's output is purely visual.
  • It is not predictive. The significance score reflects gap geometry at formation; it does not forecast whether a level will hold or fail. A high-scoring gap is more likely to matter in the statistical sense that it was a real volatility event — but high-scoring gaps fail regularly, and low-scoring gaps sometimes hold cleanly.
  • It is not a substitute for a trading framework. It assumes you already know how you want to use FVGs. Within that assumption, it removes the manual work of finding and tracking them.

Summary

The indicator detects FVGs across multiple configurable horizons, scores them against local volatility, tracks their tested/filled/swept state over their lifetime, and presents the result as a color-coded multi-layer overlay on the current chart. Significance is configurable along two orthogonal axes (volatility window and score threshold), and a per-gap score readout makes the filtering tunable from real numbers rather than abstract knobs. Lifecycle tracking — including lower-timeframe fill detection — distinguishes live levels from spent ones, and a CSV export supports data-driven tuning. The HUD provides quick visibility control and on-demand export without touching the settings dialog.


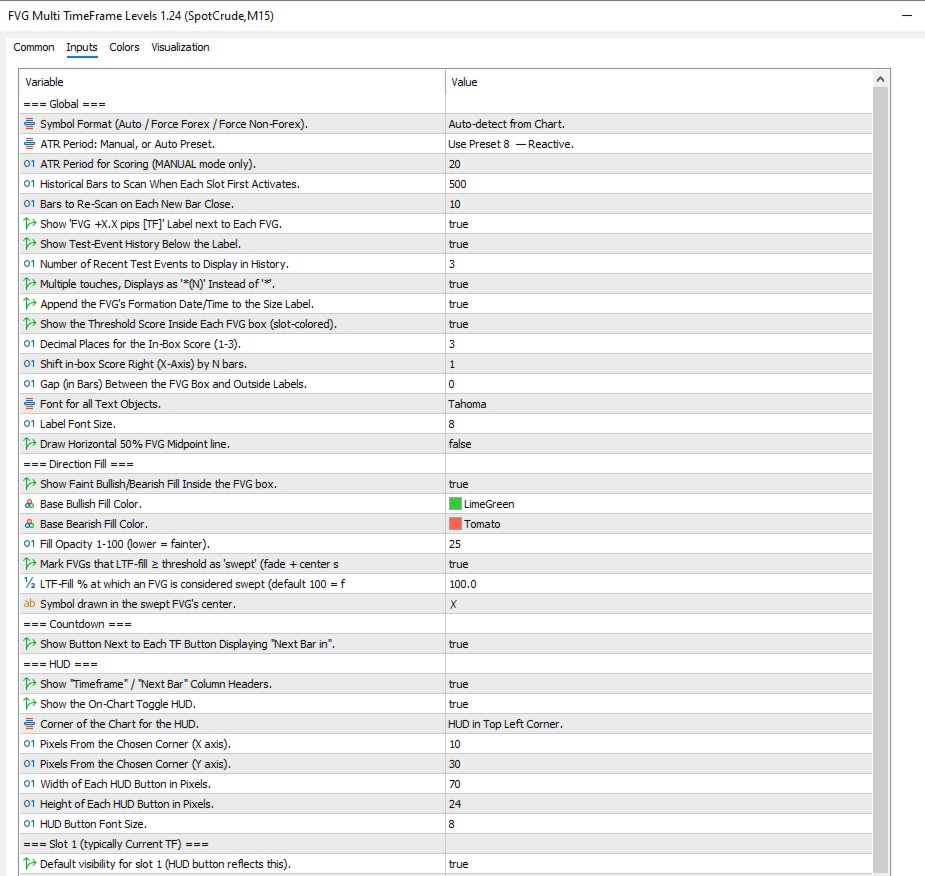
=== Global ===

Settings:

  • Symbol Format (Auto / Force Forex / Force Non-Forex). Controls whether sizes are shown as pips (forex) or raw price units (indices/metals). Auto picks based on the broker's calc mode. Leave on Auto unless an exotic instrument is mislabelled.
  • ATR Period: Manual, or Auto Preset. Global ATR mode used to score significance. Manual / Sensitive 8 / Moderate 21 / Conservative 34. Moderate is the safe default; with per-slot ATR you can leave this on Manual and let each slot pick its own horizon.
  • ATR Period for Scoring (MANUAL mode only). Manual ATR period; ignored unless the mode above is Manual. 10–25 is the useful range. 55+ is too long for intraday FVG.
  • Historical Bars to Scan When Each Slot First Activates. One-time deep scan size at attach / TF change. 500 is plenty for H1. Higher = slower attach and more old FVGs on the chart.
  • Bars to Re-Scan on Each New Bar Close. Sliding window re-checked every bar close, catches late formations. 10 is fine. Push to 20–30 only if you genuinely see real FVGs being missed.
  • Show 'FVG +X.X pips [TF]' Label next to Each FVG. The headline label next to the box (size + TF + formation time + test history). Where most of the textual info lives. Turning it off makes the chart cleaner but you lose those readouts.
  • Show Test-Event History Below the Label. Appends XX% tested (N: 0%*, 44%*, ...) showing how deeply each test penetrated. The * markers indicate multi-touch bars.
  • Number of Recent Test Events to Display in History. How many of the most recent tests are listed. 3–5 is the sweet spot. More may trigger the v1.19 auto-split.
  • Multiple touches, Displays as '(N)' Instead of ''. If a bar touches the FVG more than once, show the count. Off keeps things clean; on if you want to spot multi-touch bars.
  • Append the FVG's Formation Date/Time to the Size Label. Adds the formation timestamp to the size label. Useful for cross-referencing news.
  • Show the Threshold Score Inside Each FVG box (slot-colored). Draws the per-FVG significance score inside the box. The single most useful tuning aid. Keep on while tuning, turn off later for a cleaner chart.
  • Decimal Places for the In-Box Score (1-3). Precision of the in-box score. 2 is right for most charts. Drop to 1 if it crowds small boxes.
  • Shift in-box Score Right (X-Axis) by N bars. Slides the score off the pattern candles into the box's empty area. 3–4 is right for H1+. Bump to 5–6 on lower TFs with thicker candles.
  • Gap (in Bars) Between the FVG Box and Outside Labels. Small breathing space between the box border and outside-mode labels. 1 is right for most modes. Set to 0 to return to flush-against-the-box. Doesn't affect inside-the-box label modes.
  • Font for all Text Objects. Font used by labels and the in-box score. Consolas / Courier New (monospace) makes columns line up.
  • Label Font Size. Point size for all FVG text. 8 fits most charts. Bump to 9–10 on 4K.
  • Draw Horizontal 50% FVG Midpoint line. Faint horizontal line at each FVG's midpoint (applies to all slots). Off by default. Turn on if you trade off the midpoint.


=== Direction Fill ===

Settings:

  • Show Faint Bullish/Bearish Fill Inside the FVG box. Tints each FVG box green or red depending on direction. Makes direction readable at a glance without checking the candles.
  • Base Bullish Fill Color. Color used for the bullish tint. LimeGreen is high-contrast on dark themes.
  • Base Bearish Fill Color. Color used for the bearish tint. Same principle — Tomato is loud on dark themes.
  • Fill Opacity 1-100 (lower = fainter). How strong the tint is. 25 is the sweet spot. Above 50, the fill starts fighting the candles.
  • Mark FVGs that LTF-fill ≥ threshold as 'swept' (fade + center symbol). Toggles the v1.24 swept-FVG visual flag. Only does anything if the slot's Fill Check is on — the flag is driven by fillCheckMaxPct. Set Fill Check 1–2 steps below the slot's TF to populate it.
  • LTF-Fill % at which an FVG is considered swept (default 100 = fully filled). The fill% threshold above which a box gets the swept treatment. 100 = fully filled is the safe default. Drop to 80–90 if you want partially-filled boxes flagged too.
  • Symbol drawn in the swept FVG's center. Unicode character (or any text) placed at the box center when swept. ✗ is unambiguous. ⊘ or ◊ also read cleanly. Avoid long strings — it's font-sized larger than labels and a long string will overflow narrow boxes.


=== Countdown ===

Settings:

  • Show Button Next to Each TF Button Displaying "Next Bar in". Live countdown to the next bar close for each slot's TF. Useful when slots run different TFs.


=== HUD ===

Settings:

  • Show "Timeframe" / "Next Bar" Column Headers. Column headers above the per-slot button rows. Helpful early on; the third header "FVG Data" appears automatically above the Export column.
  • Show the On-Chart Toggle HUD. The HUD panel itself (with per-slot show/hide and export buttons). Turning the HUD off hides the buttons; slots are still configurable via inputs, just not toggleable from the chart.
  • Corner of the Chart for the HUD. Which corner the HUD anchors to. All four corners now align cleanly (v1.26 fix).
  • Pixels From the Chosen Corner (X axis). Horizontal offset from the chosen corner. In right-anchor modes, this is the gap between the HUD's right edge and the chart's right edge (v1.26 — was buggy in v1.22–1.25).
  • Pixels From the Chosen Corner (Y axis). Vertical offset from the chosen corner. Nudge to avoid overlap with chart edges.
  • Width of Each HUD Button in Pixels. Per-button width. 70 fits four short TF labels comfortably.
  • Height of Each HUD Button in Pixels. Per-button height. Make taller on 4K for tap-target sizing.
  • HUD Button Font Size. Font size used inside the HUD buttons. 8–9pt fits a 24px button cleanly.


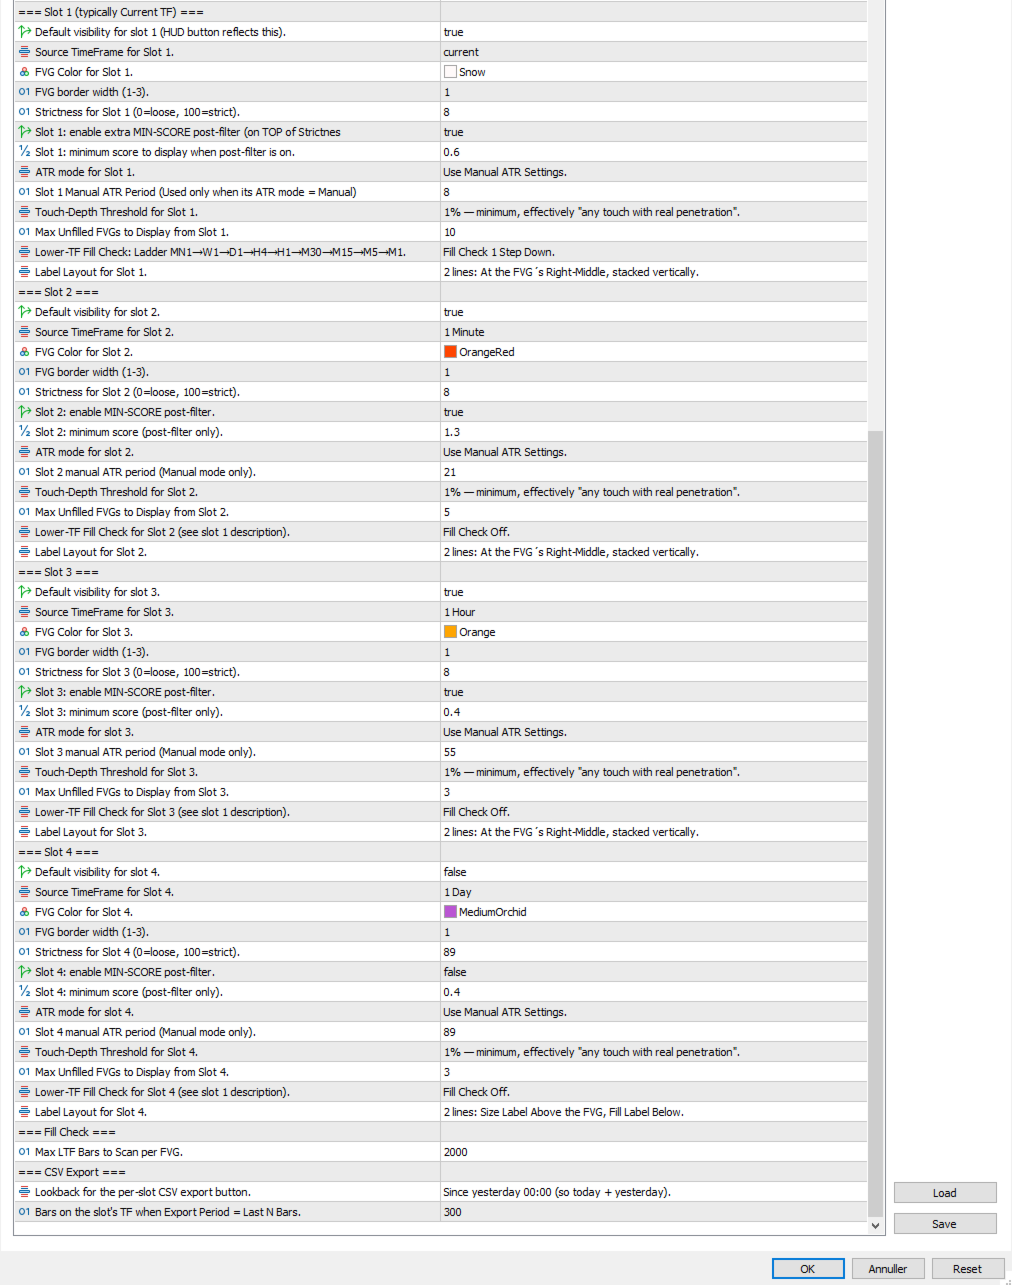
=== Slot 1 (typically Current TF) ===

Settings:

  • Default visibility for slot 1 (HUD button reflects this). Whether slot 1 is enabled on attach. Off is fine for slots you only need occasionally.
  • Source TimeFrame for Slot 1. Which TF this slot scans (use Current to follow the chart). Current follows the chart; pick an explicit TF for a fixed-horizon slot.
  • FVG Color for Slot 1. Color for the border, in-box score, swept symbol, and labels. Give each slot a distinct color — that's how you read which slot any box belongs to.
  • FVG border width (1-3). Box border thickness. Use width to encode importance (1 for noise, 2 for the slot you care about most).
  • Strictness for Slot 1 (0=loose, 100=strict). Minimum significance score a gap must reach to display. 0 = no filter, 50 = middle, 100 = extremely strict. A four-slot ladder of 0/30/55/80 on the same TF gives progressive filters.
  • Slot 1: enable extra MIN-SCORE post-filter (on TOP of Strictness). Toggles a second-stage absolute-score floor layered on top of strictness. Easier to tune than strictness because it's in the same units as the displayed in-box score. "I want nothing under 0.5" → set this on, type 0.5.
  • Slot 1: minimum score to display when post-filter is on. The absolute score floor for this slot. Read the in-box scores, decide where the noise sits, set this slightly above. Has no effect if the toggle above is off.
  • ATR mode for slot 1. Per-slot ATR mode (Inherit Global / Manual / Sensitive 8 / Moderate 21 / Conservative 34). Combined with per-slot strictness, lets the same TF be scored against multiple volatility horizons.
  • Slot 1 manual ATR period (Used only when its ATR mode = Manual). Slot-specific manual ATR period; ignored unless this slot's ATR mode = Manual. Useful if none of the three presets quite match.
  • Touch-Depth Threshold for Slot 1. How deeply price must penetrate to count as a touch: 1% / 10% / 30% / 50% / 90% / 110%. 110%. 30% is a balanced default. 110% flags potential reversals after stop hunts.
  • Max Unfilled FVGs to Display from Slot 1. Cap on how many unfilled FVGs from this slot draw at once. 3–5 keeps things readable.
  • Lower-TF Fill Check: Ladder MN1→W1→D1→H4→H1→M30→M15→M5→M1. Walks a lower TF across the FVG's lifetime to catch fills the slot's own TF can't see. Off is fastest. Required for the swept flag (v1.24) to do anything — drives fillCheckMaxPct. Set 1–2 steps below the slot's TF.
  • Label Layout for Slot 1. Where the size/history label sits: Line1_* (single-line, four positions) or (dual-line, 3 positions). The single-line modes auto-split when text gets too long.


=== Slot 2 / Slot 3 / Slot 4 ===

Same input set as Slot 1 — every row above repeats per slot (including the new min-score pair), with these defaults differing:

e.g.

Slot 1 Current Timeframe

Slot 2 H1

Slot 3 H4

Slot 4 D1


=== Fill Check ===

Settings:

  • Max LTF Bars to Scan per FVG. Global cap on the lower-TF scan length used when any slot's Fill Check is enabled. 2000 covers most cases. Lower to 500–1000 if you see lag on deep ladders.


=== CSV Export ===

Settings:

  • Lookback for the per-slot CSV export button. How far back to re-scan when an Export button is pressed. Today / Last 2 Days / This Week / Last 2 Weeks / This Month / Last N Bars.
  • Bars on the slot's TF when Export Period = Last N Bars. Lets you export an exact-length window when the calendar presets don't fit.
Prodotti consigliati
A tool for creating Bill Williams indicators Our tool provides the ability to set Bill Williams indicators on a chart with a mouse click. - The Awesome Oscillator (AO) indicator helps to assess the driving force of the trend. - Alligator indicator — determines the current state of the trend and possible entry and exit points. - Fractals indicator — helps to identify significant levels  - Accelerator Oscillator (AC) indicator — shows the change in trend acceleration. - Market Facilitation Index
FREE
News Bias Engine
Leonardo Andriulli
News Bias Engine — Real-Time Economic Calendar with Post-News Directional Bias Most news indicators show you WHEN events happen. News Bias Engine tells you WHAT TO DO after they happen. THE PROBLEM WITH STANDARD NEWS INDICATORS Every economic calendar tool on the market does the same thing: displays upcoming events with countdown timers. That's useful, but it's only half the job. The real question after NFP, CPI, or an FOMC rel
Strength Radar2
Erick Guimaraes Dos Santos
Strength Radar 02 – Take Your Trading to the Next Level! Hello, trader! If you're looking for a tool to level up your game in forex, Strength Radar 02 is exactly what you need! Developed with passion and expertise, this indicator turns currency strength analysis into something simple and powerful. With it, you'll have a clear view of the real-time performance of AUD, CAD, CHF, EUR, GBP, NZD, JPY, and USD , using indicators like MA, MACD, RSI , and more — all fully customizable your way! Ima
MT5 Multiframe Signal is a sleek and powerful dashboard indicator built for MetaTrader 5. It instantly displays BUY/SELL direction across all major timeframes — M1, M5, M15, M30, H1, H4, D1 — using advanced EMA‑based trend analysis. The panel delivers real‑time, zero‑delay signals with precise strength measurement and clean visual layout. Works flawlessly on all instruments, including forex pairs (EURUSD, GBPUSD, USDJPY) and metals (XAUUSD) . Maximum clarity, maximum performance — ideal for s
Trend Monitor VZ MT5
Sergey Ermolov
5 (1)
Trend Monitor VZ – Monitoraggio del mercato basato sulla struttura del trend. Se analizzi più strumenti, verificare la direzione del trend può richiedere molto tempo. Trend Monitor VZ raccoglie tutte queste informazioni in un unico pannello e mostra contemporaneamente la direzione del trend su più strumenti e timeframe. L'intero mercato a colpo d'occhio Sul grafico viene visualizzato un monitor di mercato che mostra la direzione del trend per gli strumenti e i timeframe selezionati. La direzion
Momentum Breakout Envelope MT5 is an advanced momentum structure indicator designed to detect breakout pressure, trend acceleration, and potential reversal zones through the interaction between a dynamic envelope and a proprietary Momentum Core. The indicator creates adaptive upper and lower momentum boundaries while continuously tracking internal market strength to highlight periods of imbalance and expansion. A key way to use the indicator is by monitoring how the Momentum Core reacts around
Overview TriParity AfterShock PRO Scanner è un indicatore dashboard discrezionale per MetaTrader 5. In questa descrizione, una triade indica la relazione tra tre coppie valutarie o strumenti. Lo Scanner esamina più triadi e timeframe in un unico pannello e aiuta il trader a organizzare una watchlist in modo più strutturato. Il suo scopo è ridurre il sovraccarico dei grafici, confrontare i candidati affiancati ed evidenziare condizioni che possono meritare un’analisi più attenta. Questo prodotto
Market Ticker Pro MT5
John Louis Fernando Diamante
The only Market Ticker on the market! Add a professional novelty to your workspace, with built in mini-charts A scrolling Market Ticker that displays price changes from all symbols in the Market Watch list. Provides an easy snapshot of symbol prices, and keeps scrolling automatically while you trade and analyse the chart. The ticker color (+/- price changes) are based on either the current or completed candle, and the previous candle. Options include: - MTF, eg choose to show price changes of t
Knowledge of the strength and weakness of each currency is vital for every forex trader. Our   Currency Strength Meter indicator   measures the strength of eight major currencies (USD, EUR, GBP, CHF, JPY, CAD, AUD, NZD) by using the Relative Strength Index indicator, also known as RSI. The Currency Strength Meter indicator shows you, simply and quickly, when a currency is oversold, overbought, or in "normal area". This way, you can identify which currency is the strongest and the weakest. Our
Trade Info Lightweight Dashboard MT5 Trade Info Lightweight Dashboard MT5 is a modern and lightweight performance dashboard designed for MetaTrader 5 traders who want to monitor trading results clearly and efficiently directly from the chart. The indicator displays detailed daily, weekly, monthly, and yearly trading statistics in a clean and professional interface without slowing down the platform. It is optimized for low resource usage and suitable for manual traders, scalpers, swing traders, a
FREE
Candle Close Timer Matrix – MT5 Candle Countdown Indicator Candle Close Timer Matrix is a lightweight and powerful MetaTrader 5 (MT5) candle countdown indicator that shows exactly how many minutes and seconds are left before the current candle closes on any symbol and any timeframe. Live Signals & Products Whether you are a scalper , intraday trader or swing trader , knowing the exact candle close time helps you: Time your entries on candle close Avoid impulsive mid-candle decisions Sync your tr
FREE
• Please test the product in the Strategy Tester before purchasing to understand how it works. • If you face any issues, contact me via private message—I’m always available to help. • After purchase, send me a screenshot of your order to receive a   FREE EA   as a gift. Introducing the Star Path Stochastic Cross Indicator Ready to explore your trading potential? The Star Path Stochastic Cross Indicator is here to guide your path. Designed for traders who love flexibility, this indicator is not
Detector Fix
Vitalii Zakharuk
Detector Fix indicator. Currency pairs never rise or fall in a straight line. Their ups and downs are interspersed with rollbacks and reversals. Every rise and fall is reflected in your emotional state: hope is replaced by fear, and when it passes, hope appears again. The market uses your fear to prevent you from taking advantage of a strong position. At such moments you are most vulnerable. Everything will change if you use the Detector Fix indicator. The Detector indicator was created to n
Market Makers Major Moves
Tshidiso Sydwell Moiloa
The Market Makers Major Moves  is a professional-grade institutional tracking tool designed to bridge the gap between retail price action and "Smart Money" movements. It treats the market not as a series of random candles, but as a price geodesic functional, where price is a "projectile" moving toward the highest density of liquidity (Retail Stops). Core Functionality & Purpose The system’s primary goal is to help traders "ride the wave" of institutional volume while avoiding common retail traps
Cm Ultimate Ma Mtf MT5
Biswarup Banerjee
4 (1)
Scopri una maggiore precisione nel trading con il CM Ultimate MA MTF MT5, un indicatore di media mobile sofisticato progettato esclusivamente per MetaTrader 5. Questo indicatore è perfetto per i trader che cercano di integrare l'analisi multi-timeframe nelle loro strategie, fornendo preziose informazioni sulle tendenze di mercato e sui movimenti dei prezzi. Il CM Ultimate MA MTF MT5 offre un vantaggio competitivo consentendo agli utenti di visualizzare segnali di mercato chiave attraverso medie
MT5 Session Indicator: Track Global Market Hours with Precision Boost your trading strategy with this FREE Session Indicator for MetaTrader 5 , designed to help you effortlessly identify active trading sessions across global markets. Perfect for forex, stocks, and commodities traders, this tool highlights key market hours (Asian, European, North American, and overlaps) directly on your chart, ensuring you never miss high-liquidity periods. Key Features: Visual Session Overlays : Clear color-c
FREE
BB Trend Pro Monitor — The Ultimate Bollinger Bands Trend Analysis Tool For MT4 version :  https://www.mql5.com/en/market/product/165648 BB Trend Pro Monitor transforms the classic Bollinger Bands indicator into a powerful, institutional-grade trend detection system. This is NOT just another Bollinger Bands overlay — it is a complete Trend Intelligence Dashboard that tells you exactly what the market is doing across multiple timeframes, in real-time. Whether you're a scalper, swing trader,
Previous Candle Levels MT5
Wachinou Lionnel Pyrrhus Sovi Guidi
1 (1)
Previous Candle Levels MT5 shows the previous candle levels, it shows the previous candle Open High Low Close levels (OHLC Levels) in different time frame. It's designed to help the trader to analyse the market and pay attention to the previous candle levels in different time frame.  We all know that the OHLC Levels in Monthly, Weekly and Daily are really strong and must of the time, the price strongly reacts at those levels. In the technical analysis, the user can use them as a support and res
FREE
Upper and Lower Reversal - Sistema per la previsione anticipata dei momenti di inversione. Ti consente di trovare punti di svolta dei prezzi ai confini dei canali di movimento dei prezzi superiore e inferiore. L'indicatore non si ricolorerà né cambierà mai la posizione delle frecce del segnale. Le frecce rosse sono un segnale di acquisto, le frecce blu sono un segnale di vendita. Si adatta a qualsiasi intervallo temporale e strumento di trading L'indicatore non si ridisegna, funziona solo quan
Tempesta
貴 広 井 上
BTC/USD  SCALPING スキャルピング型EA こちらは仮想通貨向け自動売買プログラムとなっております。 シグナル公開予定 通貨ペア :BTC/USDに最適なナンピン及び利確設定をしております ロット数:0.01~ パラメータ ・ロット数:最初の注文ロット数を入力してください。これを基準に、ナンピンに増加していきます。 ・ナンピン:ONにするとナンピンを行いますので、ONにしてご利用ください。 ポジション数: 最大21ポジション 時間足 :M1 注文条件 ・EA起動後、一定の値動きで逆張りを行います。 ・100BTC/USDごとにナンピンを行います。(ただし証拠金維持率が500%以上のあいだ) ・一定の利益にて全決済を行います。 その他 ・マーチングゲールではありませんが、ナンピンを行うため、ある程度のリスクがございます。 ・証拠金は1000USD以上を推奨しております。
ToolBox 360 is the swiss knife of all indicators. It is full packed with useful tools to help you with your trading. It can be used to find best entry and exit points and help you to decide if you should open a trade or not. It shows market trends, candlestick formations outside / inside bars and you can sett time based allerts. Main features: Time based Fibonacci lines Choose a start and end time and the indicator shows you Fibonacci lines within the selected time range including range high a
PZ Mean Reversion MT5
PZ TRADING SLU
3 (2)
Indicatore unico che implementa un approccio professionale e quantitativo al trading di reversione. Sfrutta il fatto che il prezzo devia e ritorna alla media in modo prevedibile e misurabile, il che consente regole di entrata e uscita chiare che superano di gran lunga le strategie di trading non quantitative. [ Installation Guide | Update Guide | Troubleshooting | FAQ | All Products ] Segnali di trading chiari Incredibilmente facile da scambiare Colori e dimensioni personalizzabili Implementa l
SDZ Trend Pro
Van Toan Nguyen
Overview SDZ Trend Pro is a professional Expert Advisor work for all symbol, recommend  XAUUSD (Gold) trading on the H1 timeframe . It combines dynamic price action patterns, EMA filters, and strict session-based trading logic to identify precise market entries with optimal risk control. This EA is ideal for traders who prefer structured, time-filtered trading during active market hours. ️ Core Features Dynamic Stop Loss (SL) logic Automatically sets SL based on candle pattern Chooses the
Ultimate Boom and Crash Indicator The Ultimate Boom and Crash Indicator is a cutting-edge tool developed by  Coetsee Digital , designed to identify potential spike opportunities in the market. Crafted for traders focusing on Deriv and Weltrade synthetic markets, this indicator is optimized to operate exclusively on the 3-minute (M3), 5-minute (M5), 15-minute (M15), 30-minute (M30), and 1-hour (H1) timeframes and supports only the following pairs: PainX 1200, PainX 999, PainX 800, PainX 600, Pai
Session Indicator — Forex Trading Sessions Visualizer Overview Session Indicator   is a professional MT5 indicator that displays the four major forex trading sessions (Sydney, Tokyo, London, New York) as colored horizontal bands on your chart. Never miss a trading session again! Free Product   |   Works on Any Broker   |   Auto-Detects Timezone Features Auto-Detects Broker GMT Offset Works automatically on any MT5 broker (XM, IC Markets, FXCM, etc.) No manual timezone configuration needed Label
FREE
Currency Strength Monitor is a professional multi-currency strength indicator for MetaTrader 5 that analyzes and displays the relative strength of 8 major currencies (USD, EUR, GBP, AUD, NZD, JPY, CHF, CAD) in real-time. The indicator calculates strength values by aggregating price movements across 28 currency pairs and normalizing them using ATR, providing traders with a clear visual representation of which currencies are strengthening or weakening. Key Features: Multi-Currency Analysis — Monit
Candle Body Power — Real-Time Candle Body Strength Classifier | Juravvlik Trading Tools | CVET System Candle Body Power is a price action quality indicator that measures the body-to-range ratio of each candle and classifies its strength into three power levels in real time. Instead of just showing direction, it reveals how clean and dominant the current candle movement really is — giving you an instant read on candle body strength before the bar closes. CLASSIFICATION — THREE POWER LEVELS The
FREE
Impulse System MTF – Multi-Timeframe Trend and Momentum Filter The Impulse System MTF is a professional technical indicator designed to identify the confluence of trend and momentum across multiple timeframes. By combining an Exponential Moving Average (EMA) and the MACD Histogram, it provides a color-coded visual system that helps traders stay on the right side of market volatility. The Three Pillars of Signal Logic The indicator analyzes the relationship between trend (EMA) and momentum (MACD)
FREE
Liquid Sniper Pro è un indicatore di tendenza e momentum di livello professionale per MetaTrader 5, progettato per offrire precisione di livello istituzionale ai trader retail. Basato su un'estetica "Cyber-Gold", utilizza un framework di momentum a doppio strato per filtrare il rumore del mercato e identificare le fasi di espansione ad alta velocità. La Strategia: Il Corridoio di Momentum Liquido Liquid Sniper Pro opera sul principio dell'identificazione delle "Zone di Valore" rispetto alle "Zon
This multi-currency annual dashboard analyzes the nearest high and low to the current price for a chosen number of recent years. It displays how many pips away the price is from the nearest high or low. You can set a pip threshold, and the alert will notify you when the price gets close to the specified levels. In real-time, the dashboard also provides an overview of the closest high or low values for each specific year, helping you make informed trading decisions.
Gli utenti di questo prodotto hanno anche acquistato
Neuro Poseidon MT5
Daria Rezueva
5 (9)
The price increases every 30 purchases, the next price is $169 Neuro Poseidon is a new indicator by Daria Rezueva. It combines precise trading signals with adaptive TP/SL levels - creating best possible trades as a result! Message me and get  Neuro Poseidon Assistant  as a gift to automize your trading process! What makes it stand out? 1. Proven profitability on all assets and timeframes 2. Only confirmed BUY and SELL signals present on the chart 3. Adaptive TP & SL levels generated by the
SuperScalp Pro
Van Minh Nguyen
4.65 (26)
SuperScalp Pro – Sistema avanzato di indicatore scalping multi-filtro SuperScalp Pro è un indicatore di scalping avanzato che combina il classico Supertrend con molteplici filtri intelligenti di conferma per aiutare a identificare opportunità di trading. Funziona in modo efficiente su diversi timeframe da M1 a H4, con prestazioni ottimizzate su XAUUSD, BTCUSD e principali coppie Forex. L’indicatore fornisce chiari segnali Buy e Sell, insieme a livelli di ingresso, stop loss e take profit calcola
SMC Intraday Formula
Kareem Abbas
4.92 (12)
Cominciamo con la verità. Nessun indicatore da solo ti renderà profittevole. Se qualcuno ti dice il contrario, ti sta vendendo un sogno. Qualsiasi indicatore che mostra frecce perfette di acquisto/vendita può essere reso impeccabile — basta ingrandire la giusta sezione della storia e catturare solo i trade vincenti. Noi non lo facciamo.  SMC Intraday Formula è uno strumento. Legge la struttura del mercato per te, identifica le zone a più alta probabilità e ti mostra esattamente come appare la t
Entry In The Zone and SMC Multi Timeframe is a real-time 2-in-1 market analysis tool that combines market structure analysis and a No Repaint BUY / SELL signal system into a single indicator, built on Smart Money Concepts (SMC) — a widely adopted framework used by professional traders to understand market structure. This indicator helps you see the market more clearly, make decisions based on structure rather than guesswork, and focus on high-probability zones where price is more likely to react
Divergence Bomber
Ihor Otkydach
4.9 (89)
Ogni acquirente dell’indicatore riceverà inoltre gratuitamente: L’utilità esclusiva “Bomber Utility”, che gestisce automaticamente ogni operazione, imposta i livelli di Stop Loss e Take Profit e chiude le posizioni secondo le regole della strategia I file di configurazione (set file) per adattare l’indicatore a diversi asset I set file per configurare il Bomber Utility in tre modalità: “Rischio Minimo”, “Rischio Bilanciato” e “Strategia di Attesa” Una guida video passo-passo per installare, conf
Power Candles MT5
Daniel Stein
5 (8)
Power Candles V3 - Indicatore di forza ad ottimizzazione automatica Power Candles V3 trasforma la forza delle valute e degli strumenti in un piano di trading attuabile su ogni grafico a cui è collegato. Invece di limitarsi a colorare le candele, esegue un'auto-ottimizzazione in tempo reale in background e ti fornisce i migliori valori di Stop Loss, Take Profit e soglia di segnale per il simbolo che hai davanti. Basta un clic per adottarlo nel trading live: i raggi di ingresso, Stop Loss e Take P
SignalTech MT5 is an unique fully rule based trading system for EURUSD, USDCHF, USDJPY, AUDUSD, NZDUSD, EURJPY, AUDJPY, NZDJPY, CADJPY.  All the winning trades with chart setups are published on the comments page. 2026-05 3690 Pips (Until 05-26 NY Closed) 2026-04 2243 Pips 2026-03 2165 Pips 2026-02 2937 Pips 2026-01 2624 Pips 2025-12 1174 Pips It can generate signals with Buy/Sell Arrows and Pop-Up/Sound Alerts. Each signal has clear Entry and Stop Loss levels, which should be automatically flag
Atomic Analyst MT5
Issam Kassas
4.19 (32)
Innanzitutto, vale la pena sottolineare che questo indicatore di trading non è repaint, non è ridisegno e non presenta ritardi, il che lo rende ideale sia per il trading manuale che per quello automatico. Manuale utente: impostazioni, input e strategia. L'Analista Atomico è un indicatore di azione del prezzo PA che utilizza la forza e il momentum del prezzo per trovare un miglior vantaggio sul mercato. Dotato di filtri avanzati che aiutano a rimuovere rumori e segnali falsi, e aumentare il pote
Azimuth Pro
Ottaviano De Cicco
5 (7)
Azimuth Pro V2: Synthetic Fractal Structure and Confirmed Entries for MT5 Overview Azimuth Pro is a multi-level swing structure indicator by Merkava Labs . Four nested swing layers, swing-anchored VWAP, ABC pattern detection, three-timeframe structural filtering, and closed-bar confirmed entries — one chart, one workflow from micro-swings to macro-cycles. This is not a blind signal product. It is a structure-first workflow for traders who care about location, context, and timing. V2 Launch Offe
Presentazione       Quantum Breakout PRO   , l'innovativo indicatore MQL5 che sta trasformando il modo in cui scambi le zone di breakout! Sviluppato da un team di trader esperti con un'esperienza di trading di oltre 13 anni,       Quantum Breakout PRO       è progettato per spingere il tuo viaggio di trading a nuovi livelli con la sua strategia innovativa e dinamica della zona di breakout. Quantum Breakout Indicator ti fornirà frecce di segnalazione sulle zone di breakout con 5 zone target di
Se acquisti questo indicatore, riceverai il mio Trade Manager Professionale + EA  GRATUITAMENTE. Innanzitutto è importante sottolineare che questo sistema di trading è un indicatore Non-Repainting, Non-Redrawing e Non-Lagging, il che lo rende ideale sia per il trading manuale che per quello automatico. Corso online, manuale e download di preset. Il "Sistema di Trading Smart Trend MT5" è una soluzione completa pensata sia per i trader principianti che per quelli esperti. Combina oltre 10 indicat
Trend Catcher ind mt5
Ramil Minniakhmetov
5 (3)
INDICATORE TREND CATCHER L'indicatore Trend Catcher analizza i movimenti dei prezzi di mercato, utilizzando una combinazione di indicatori di analisi del trend proprietari dell'autore e personalizzati. Identifica la vera direzione del mercato filtrando il rumore a breve termine e concentrandosi sulla forza del momentum sottostante, sull'espansione della volatilità e sul comportamento della struttura dei prezzi. Utilizza inoltre una combinazione di indicatori personalizzati di smoothing e filtr
Gann Made Easy è un sistema di trading Forex professionale e facile da usare che si basa sui migliori principi del trading utilizzando la teoria di mr. WD Gann. L'indicatore fornisce segnali ACQUISTA e VENDI accurati, inclusi i livelli di Stop Loss e Take Profit. Puoi fare trading anche in movimento utilizzando le notifiche PUSH. CONTATTAMI DOPO L'ACQUISTO PER RICEVERE GRATUITAMENTE LE ISTRUZIONI DI TRADING E OTTIMI INDICATORI EXTRA! Probabilmente hai già sentito parlare molte volte dei metodi d
FX Trend MT5 NG
Daniel Stein
5 (6)
FX Trend NG: La Nuova Generazione di Intelligenza di Trend Multi-Mercato Panoramica FX Trend NG è uno strumento professionale di analisi del trend multi-timeframe e monitoraggio dei mercati. Ti consente di comprendere la struttura completa del mercato in pochi secondi. Invece di passare tra numerosi grafici, puoi identificare immediatamente quali strumenti sono in trend, dove il momentum sta diminuendo e dove esiste un forte allineamento tra i timeframe. Offerta di Lancio – Ottieni FX Trend NG
ARIPoint
Temirlan Kdyrkhan
1 (1)
ARIPoint is a powerful trading companion designed to generate high-probability entry signals with dynamic TP/SL/DP levels based on volatility. Built-in performance tracking shows win/loss stats, PP1/PP2 hits, and success rates all updated live. Key Features: Buy/Sell signals with adaptive volatility bands Real-time TP/SL/DP levels based on ATR Built-in MA Filter with optional ATR/StdDev volatility Performance stats panel (Success, Profit/Loss, PP1/PP2) Alerts via popup, sound, push, or email Cu
Quantum TrendPulse
Bogdan Ion Puscasu
5 (25)
Ecco   Quantum TrendPulse   , lo strumento di trading definitivo che combina la potenza di   SuperTrend   ,   RSI   e   Stocastico   in un unico indicatore completo per massimizzare il tuo potenziale di trading. Progettato per i trader che cercano precisione ed efficienza, questo indicatore ti aiuta a identificare con sicurezza le tendenze di mercato, i cambiamenti di momentum e i punti di entrata e uscita ottimali. Caratteristiche principali: Integrazione SuperTrend:   segui facilmente l'andame
Crystal Heikin Ashi Signals
Muhammad Jawad Shabir
5 (2)
Crystal Heikin Ashi Signals - Professional Trend & Signal Detection Indicator Advanced Heikin Ashi Visualization with Intelligent Signal System for Manual & Automated Trading Final Price: $149 ---------> Price goes up $10 after every 10 sales . Limited slots available — act fast . Overview Crystal Heikin Ashi Signals is a professional-grade MetaTrader 5 indicator that combines pure Heikin Ashi candle visualization with an advanced momentum-shift detection system. Designed for both manual traders
Versione Swing M30/H1/H4 disponibile Vuoi catturare i grandi movimenti? Gold Signal Swing Pro (M30/H1/H4). Obiettivo: $20-$80+ per trade. https://www.mql5.com/en/market/product/177643 KURAMA GOLD SIGNAL PRO (MT5) — Sistema di Trading XAUUSD Completo a 7 Strati di Filtri Nessun repaint. Nessun ridisegno. Nessun ritardo. Ogni segnale rimane fissato una volta confermato. Bonus acquirente: Chiunque acquisti la licenza di acquisto riceve AI Zone Radar (v
Trend Forecaster
Alexey Minkov
5 (7)
Trend Forecaster – Since 2023. The Trend Forecaster indicator utilizes a unique proprietary algorithm to determine entry points for a breakout trading strategy. The indicator identifies price clusters, analyzes price movement near levels, and provides a signal when the price breaks through a level. The Trend Forecaster indicator is suitable for all financial assets, including currencies (Forex), metals, stocks, indices, and cryptocurrencies. You can also adjust the indicator to work on any time
Innanzitutto, vale la pena sottolineare che questo Strumento di Trading è un Indicatore Non-Ridipingente, Non-Ridisegnante e Non-Laggante, il che lo rende ideale per il trading professionale. Corso online, manuale utente e demo. L'Indicatore Smart Price Action Concepts è uno strumento molto potente sia per i nuovi che per i trader esperti. Racchiude più di 20 utili indicatori in uno solo, combinando idee di trading avanzate come l'Analisi del Trader del Circolo Interno e le Strategie di Tradin
Meridian Pro
Ottaviano De Cicco
5 (2)
Meridian Pro 2.00: Professional Multi-Timeframe Trend Matrix for MT5 Meridian Pro 2.00 is a professional adaptive trend matrix for MetaTrader 5. It combines the original Meridian trend engine, a clean chart ribbon, closed-bar signal arrows, an 8-timeframe dashboard, Fuel momentum, weighted consensus, synthetic HTF processing and chart-native higher-timeframe context lines. The goal is simple: read current trend, multi-timeframe structure, strength, momentum and EA-ready state from one discipline
FX Power MT5 NG
Daniel Stein
5 (32)
FX Power: Analizza la Forza delle Valute per Decisioni di Trading Più Intelligenti Panoramica FX Power è lo strumento essenziale per comprendere la reale forza delle principali valute e dell'oro in qualsiasi condizione di mercato. Identificando le valute forti da comprare e quelle deboli da vendere, FX Power semplifica le decisioni di trading e rivela opportunità ad alta probabilità. Che tu segua le tendenze o anticipi inversioni utilizzando valori estremi di Delta, questo strumento si adatta
Btmm state engine pro
Garry James Goodchild
5 (5)
BTMM State Engine Pro is a MetaTrader 5 indicator for traders who use the Beat The Market Maker approach: Asian session context, kill zone timing, level progression, peak formation detection, and a multi-pair scanner from a single chart. It combines cycle state logic with a built-in scanner dashboard so you do not need the same tool on many charts at once. What it does Draws the Asian session range; session times can follow broker server offset or be set in inputs. Tracks level progression (L
PZ Trend Trading MT5
PZ TRADING SLU
3.8 (5)
Capture every opportunity: your go-to indicator for profitable trend trading Trend Trading is an indicator designed to profit as much as possible from trends taking place in the market, by timing pullbacks and breakouts. It finds trading opportunities by analyzing what the price is doing during established trends. [ Installation Guide | Update Guide | Troubleshooting | FAQ | All Products ] Trade financial markets with confidence and efficiency Profit from established trends without getting whips
RelicusRoad Pro MT5
Relicus LLC
4.96 (24)
RelicusRoad Pro: Sistema Operativo Quantitativo di Mercato 70% DI SCONTO ACCESSO A VITA (TEMPO LIMITATO) - UNISCITI A 2.000+ TRADER Perché la maggior parte dei trader fallisce anche con indicatori "perfetti"? Perché operano su Singoli Concetti isolati. Un segnale senza contesto è una scommessa. Per vincere serve CONFLUENZA . RelicusRoad Pro non è un semplice indicatore. È un Ecosistema Quantitativo completo . Mappa la "Fair Value Road", distinguendo tra rumore e rotture strutturali. Smetti di in
KT Alpha Hunter Arrows MT5
KEENBASE SOFTWARE SOLUTIONS
La maggior parte degli indicatori a frecce ti dà un segnale e poi ti lascia capire da solo tutto il resto. KT Alpha Hunter Arrows ti offre un piano di trading completo. Ogni freccia di segnale appare con un piano completo già disegnato: linea di ingresso, stop loss, quattro livelli di take profit e un verdetto live sull’edge, che ti indica se quel simbolo e quel timeframe meritano davvero di essere tradati in quel momento. Il Trade Manager EA incluso gestisce l’esecuzione dopo il tuo ingresso, c
PZ Support Resistance MT5
PZ TRADING SLU
3.71 (7)
Unlock key market insights with automated support and resistance lines Tired of plotting support and resistance lines? This is a multi-timeframe indicator that detects and plots supports and resistance lines in the chart with the same precision as a human eye would. As price levels are tested over time and its importance increases, the lines become thicker and darker, making price leves easy to glance and evaluate. [ Installation Guide | Update Guide | Troubleshooting | FAQ | All Products  ] Boo
PZ Swing Trading MT5
PZ TRADING SLU
5 (5)
Protect against whipsaws: revolutionize your swing trading approach Swing Trading is the first indicator designed to detect swings in the direction of the trend and possible reversal swings. It uses the baseline swing trading approach, widely described in trading literature. The indicator studies several price and time vectors to track the aggregate trend direction and detects situations in which the market is oversold or overbought and ready to correct. [ Installation Guide | Update Guide | Tro
Rilevatore intelligente multistrato di breakout e pullback per MetaTrader 5 "Intelligente. Semplice. Veloce!" Sei stanco di perdere entrate su breakout ad alta probabilità? Passi ore a scansionare più grafici, cercando di allineare i breakout con la direzione del trend e il momentum delle valute — solo per perdere il movimento? Break Pullback risolve tutto questo con un solo indicatore. Cos'è Break Pullback? Break Pullback è un indicatore MetaTrader 5 di livello professionale, progettato speci
PZ Divergence Trading MT5
PZ TRADING SLU
3.71 (7)
Unlock hidden profits: accurate divergence trading for all markets Tricky to find and scarce in frequency, divergences are one of the most reliable trading scenarios. This indicator finds and scans for regular and hidden divergences automatically using your favourite oscillator. [ Installation Guide | Update Guide | Troubleshooting | FAQ | All Products  ] Easy to trade Finds regular and hidden divergences Supports many well known oscillators Implements trading signals based on breakouts Displays
Altri dall’autore
News Marker
Kenneth Weleh
News Markers Description Version: 1.13Type: MetaTrader 5 indicator (chart window) Purpose: Plots economic-calendar news events as color-coded vertical lines on the chart, with optional currency tags and an upcoming-news HUD panel. Before you start — three things that always apply Live connection required. The data comes from MT5's built-in economic calendar via your broker's feed. It returns nothing in the Strategy Tester, and nothing if your broker doesn't serve calendar data. If no lines appe
FREE
The Simple Manual Trading Panel (v2.11) Is a professional trade management tool designed with a clean, movable UI to streamline manual execution and automated exit strategies. Core Features Dynamic Visual Interface: A movable GUI panel that provides real-time information including a bar countdown timer, live spread, and advanced volume analysis. Flexible Lot Size setting, with 2 decimals (If broker supports it). Multi-Stage Take Profit: Supports three distinct Take Profit (TP) levels in either
Trend Matrix Panel is a multi-timeframe technical indicator for MetaTrader 5 that compresses an entire trading session's structural picture into a single panel. Rather than flipping between charts to read M1, M15, H1, and D1 separately, the panel shows the trend state of three configurable moving averages across twelve timeframes simultaneously, with a heatmap that draws your eye to the genuinely strong signals and away from noise. The core idea is simple: every cell in the matrix tells you how
This script is an Intelligence Gathering Utility designed to give you full control over your data exports from MetaTrader 5. It allows you to synchronize up to three different symbols into a single file with precise timestamping. 1. Setting the Data Range (Range) You can define exactly which historical period you want to capture: Date Mode : If Last N bars (0 = use date range above) is set to 0 , the script will export all data between your chosen start and end dates. Bar Mode : By entering a nu
The primary function of this script, Tick Data Exporter , is to efficiently extract historical tick data. Tick data represents the most granular level of market data, capturing every single price change. The script downloads this data from a broker and formats it into CSV files for external quantitative analysis. Five things tick data shows that bars permanently hide: Spread microstructure: Bars give you one spread number per period (typically the spread at bar close). Ticks show you the sprea
Filtro:
Nessuna recensione
Rispondi alla recensione