FVG Multi TimeFrame Levels

FVG Multi TimeFrame Levels — Indicator Overview

What it is

A multi-timeframe Fair Value Gap detector and analysis tool for MetaTrader 5. It scans price action across up to four configurable timeframe "slots" simultaneously, identifies gaps that meet a configurable significance threshold, draws them as boxes on the current chart, and tracks how each gap behaves over its lifetime — whether it gets tested, how deeply, how often, and ultimately whether it gets filled or swept beyond.

It runs alongside live price action without interrupting it; nothing it draws is interactive or order-related. It is a read-only analytical tool — it tells you where the levels are and what state they're in. Trading decisions remain yours.

What a Fair Value Gap is, and why it matters

A Fair Value Gap (FVG) is a three-bar pattern where the body of an impulse move leaves a price range that no candle's wick fully overlaps. Strict definition: for three consecutive bars older → impulse → newer, the older bar's high sits below the newer bar's low (bullish FVG), or the older bar's low sits above the newer bar's high (bearish FVG). The "gap" is the unfilled price band between them.

These gaps matter because price often returns to them. The impulse move that created the gap was fast enough that no consensus price was established within that range; many participants didn't get to transact at those levels. When price drifts back, that range becomes a liquidity zone — an area where pending orders, stops, and re-entry interest concentrate. Traders who use the concept treat these zones as candidates for support/resistance, entry triggers, or stop-placement anchors.

Not every three-bar gap matters equally. A gap of half a pip on a quiet session is noise; a gap during an impulsive trend day is a level the market is likely to revisit. This indicator's purpose is to find the gaps that matter and track what happens to them.

The four-slot architecture

The indicator exposes four parallel detection slots. Each slot is independent and configurable: source timeframe, color, significance threshold, filter mode, depth-of-test sensitivity, label position. Slots are typically used in two complementary ways:

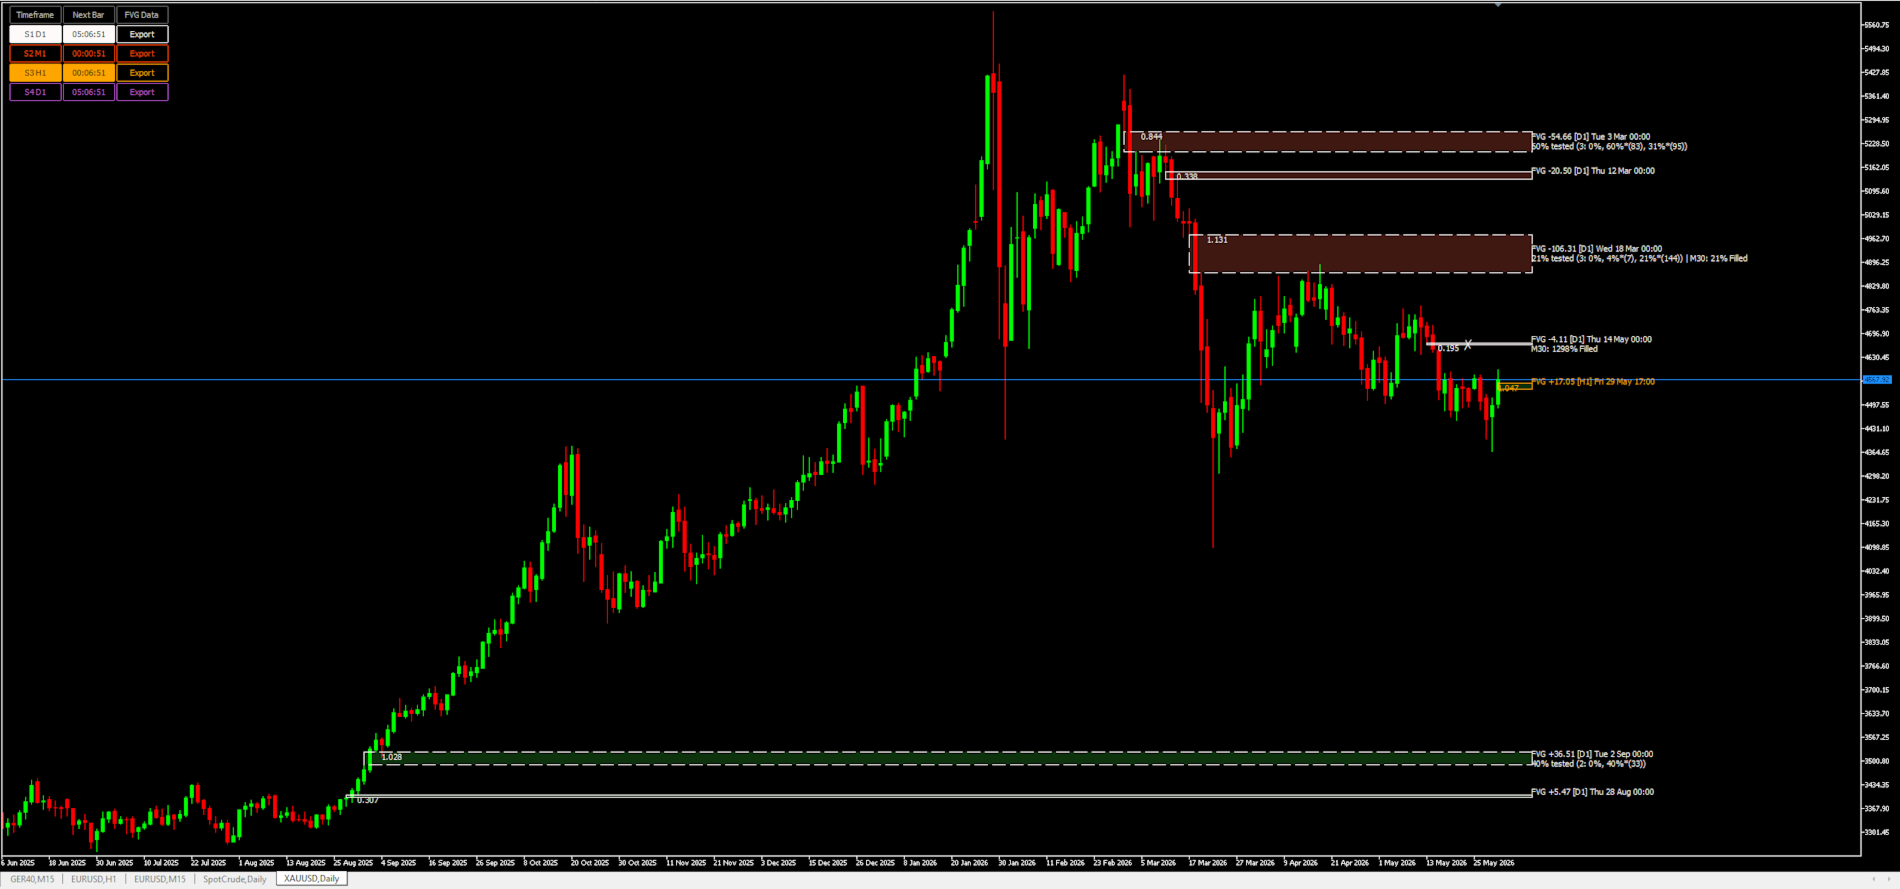
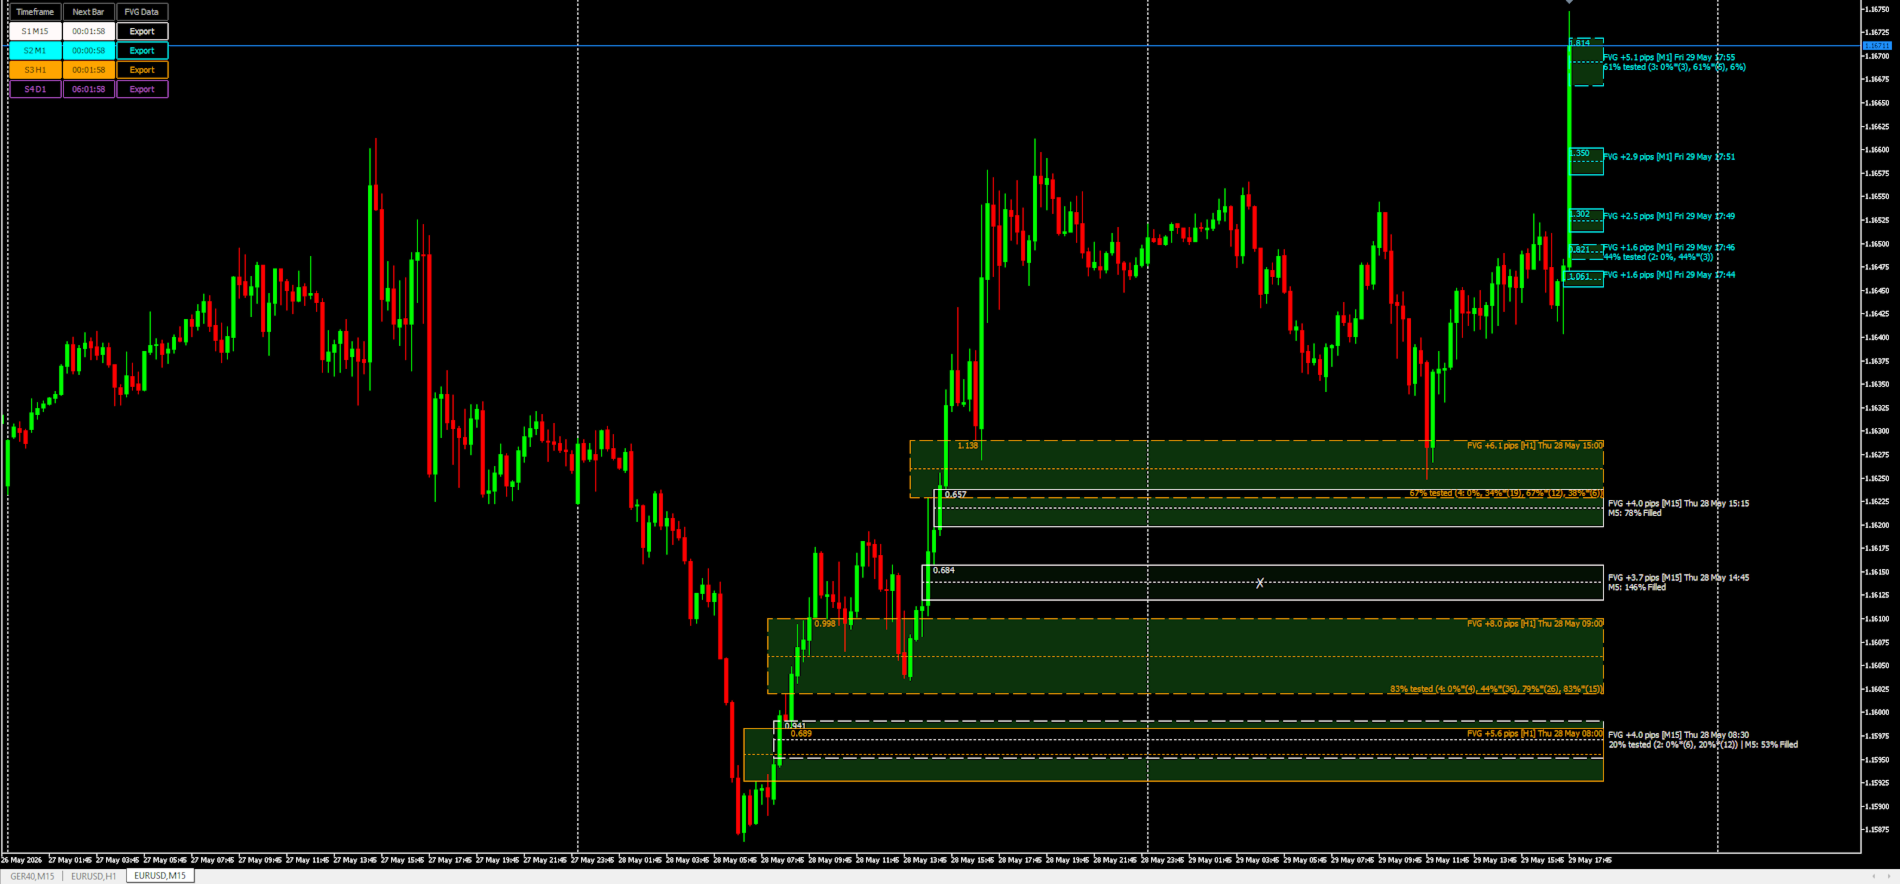
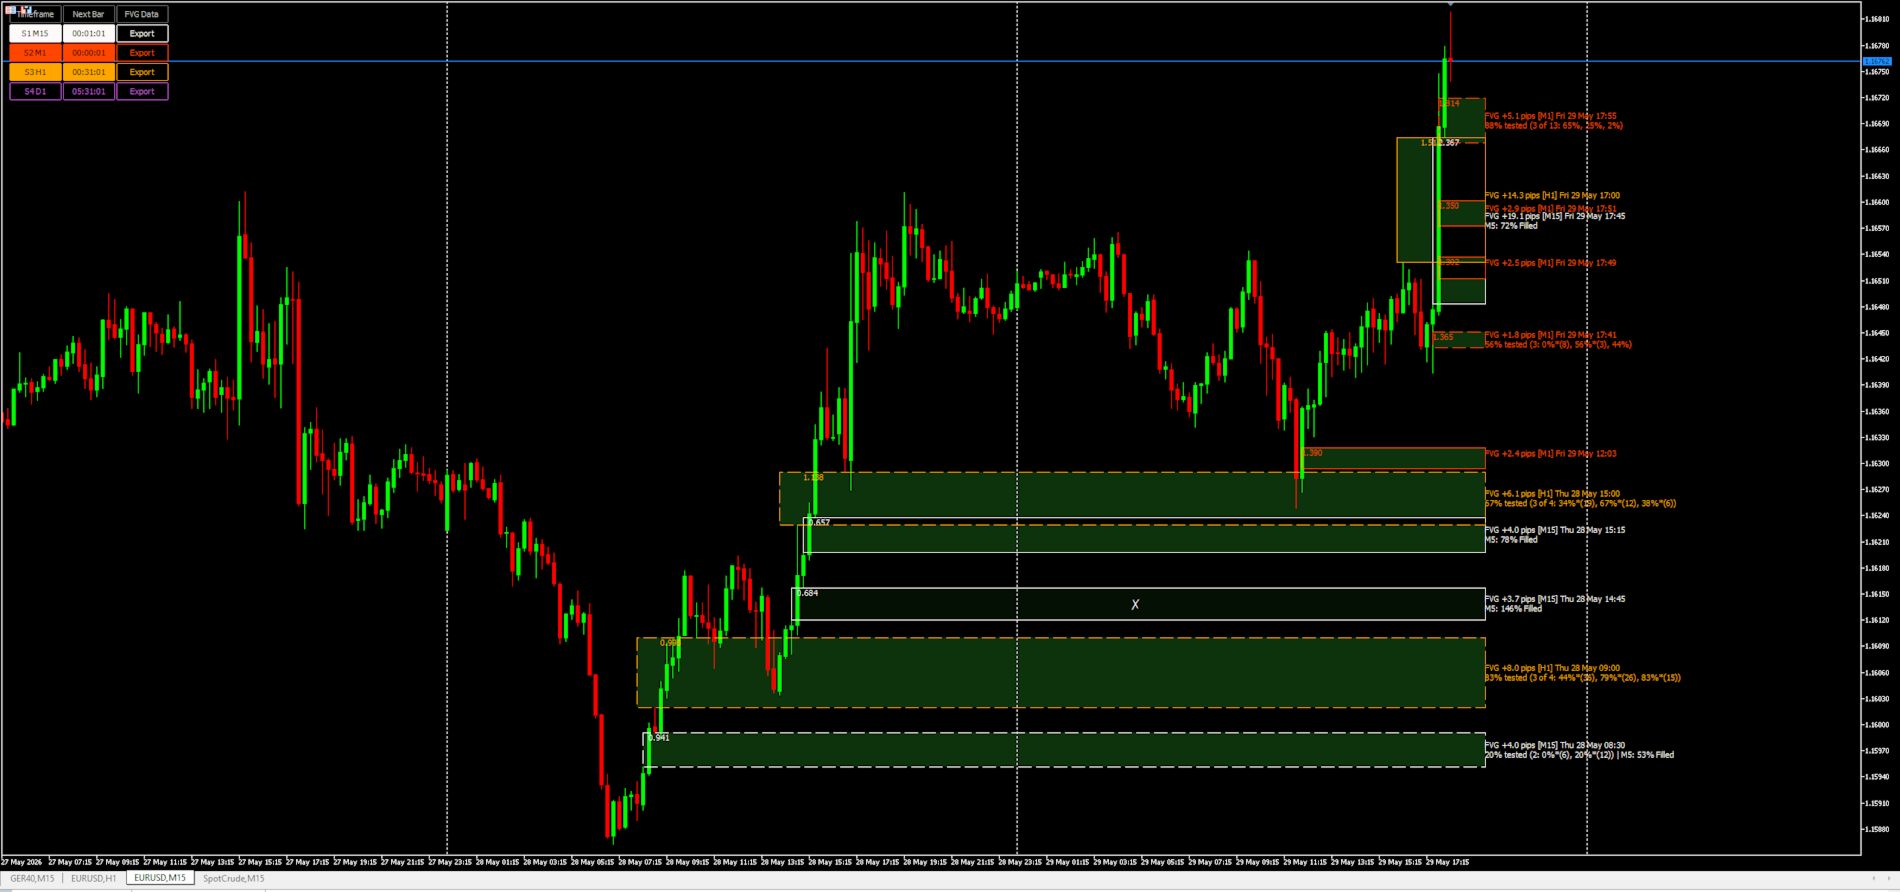
As different timeframes simultaneously. Slot 1 on the current chart's TF, slot 2 on H1, slot 3 on H4, slot 4 on D1. The chart then shows gaps from four time horizons at once, color-coded by slot. This is the canonical multi-timeframe view — you see the M15 gaps you might trade against, the H1 gaps that contextualize them, and the daily gaps that act as macro magnets.

As different significance horizons on the same timeframe. Four slots on H1, but each scoring gaps against a different volatility window (a "Sensitive" 8-bar ATR, a "Moderate" 21-bar, a "Conservative" 34-bar, and one manual). The same instrument is then judged against multiple time-scales of "what counts as a big move," and a gap that lights up in the Sensitive slot but stays dark in the Conservative one is telling you "significant relative to the last few hours, trivial against the broader regime."

These modes can mix. A slot is a configuration, not a fixed concept; the architecture is general.


How a gap is selected for display

A candidate gap goes through several gates before it appears on the chart:

1. Structural test. Three consecutive bars must form a strict, non-overlapping gap. If wicks overlap, no gap exists by definition, regardless of how the candles look to the eye. This is non-negotiable and tunes nothing.

2. Continuity check. The three bars must be temporally adjacent — no weekend gap, no session break. A "gap" between Friday's close and Monday's open isn't structural, it's calendar.

3. Significance score. Each candidate is given a score.

This normalizes the gap's size and the impulse candle's body against recent volatility. A score of 1.0 means the gap and body are roughly average for the prevailing volatility; 2.0+ means a clearly forceful move. The ATR window is configurable globally and per-slot.

4. Strictness gate. The score must clear a configurable threshold (0 = no filter, 100 = only the strongest gaps). The threshold maps linearly to a 0–2.5 score floor, so the slider directly controls what fraction of detected gaps survive.

5. Optional minimum-score post-filter. A second, absolute-score floor that layers on top of strictness. Where strictness is an abstract knob, this is in the same units as the visible per-box score — read the chart, decide where the noise sits, set the floor directly.

A gap that passes all five gates is added to the slot's display list, capped at a configurable maximum to prevent chart clutter.

What gets drawn for each gap

For each surviving gap, the indicator draws several elements:

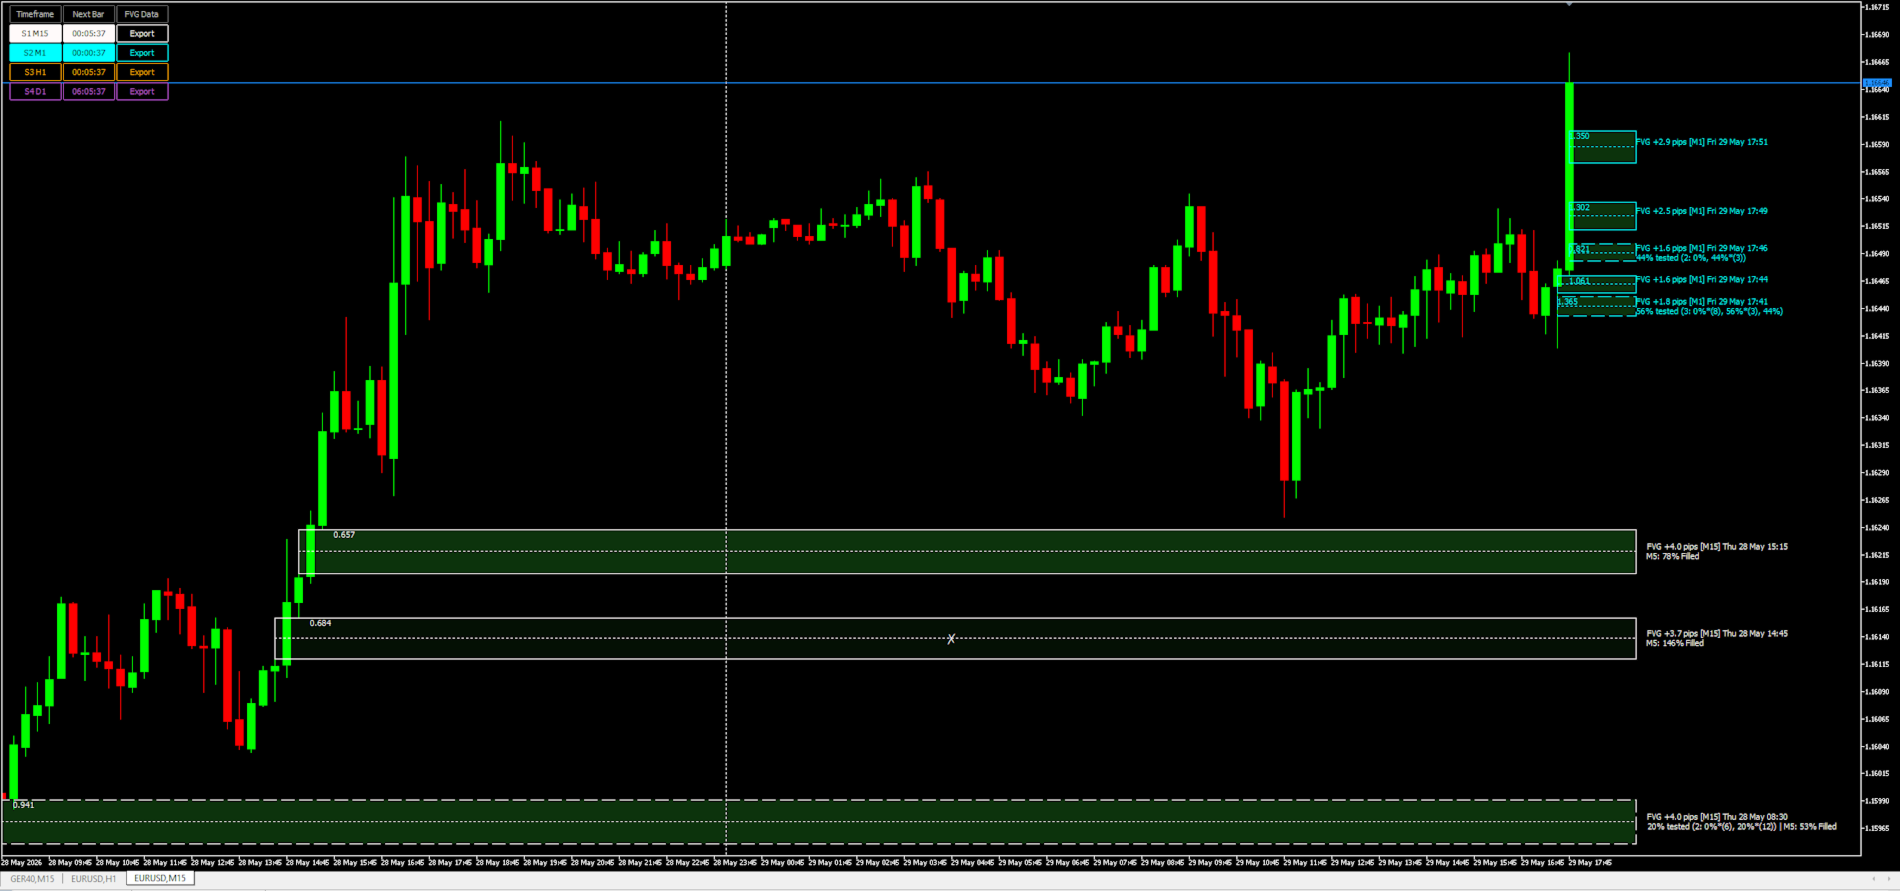
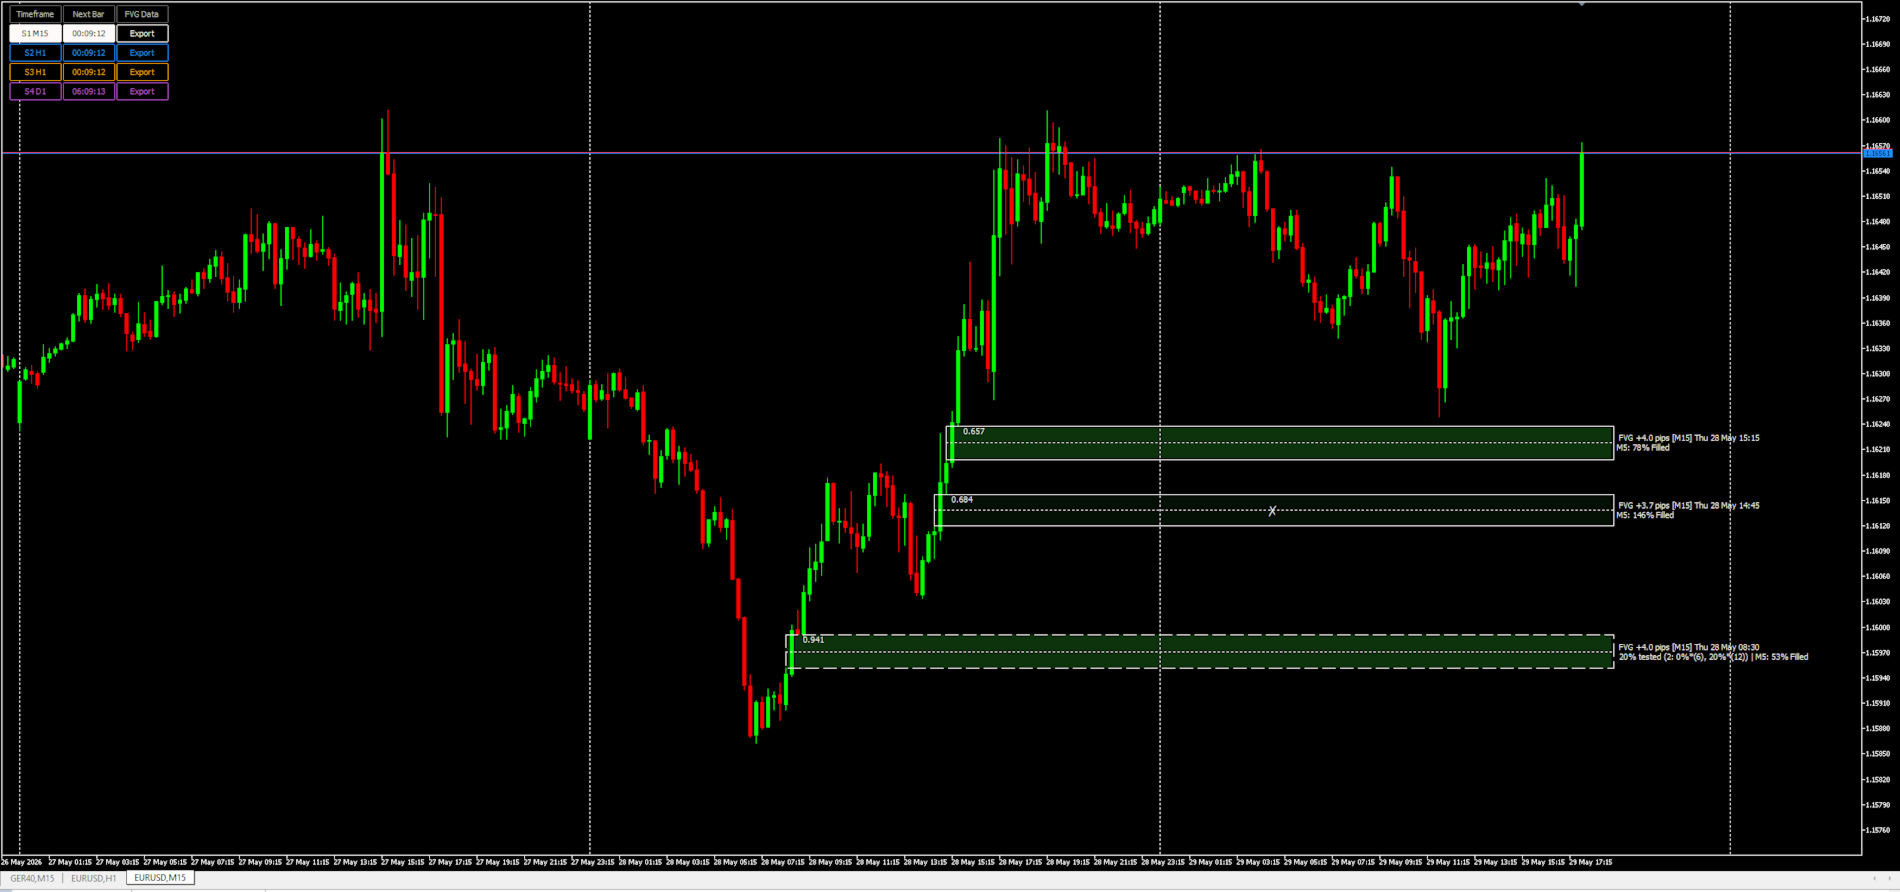
The box — a rectangle spanning the gap's price range (top to bottom) and time span (from the older bar's time, extending forward into current and future candles). The box border uses the slot's color; the border style indicates whether the gap has been tested (solid line) or remains untouched (dashed line, by convention).

An optional directional fill — a faint green or red tint inside the box marking bull/bear direction. Opacity is low so candles dominate the visual hierarchy.

An optional center line — a faint horizontal line at the gap's 50% midpoint, a common partial-fill target in some trading approaches.

An optional significance score — the gap's numeric score, drawn slot-colored inside the box at a configurable offset from the left edge. Reading this turns the abstract strictness control into a concrete per-gap readout.

The label — the gap's size in pips/price units, formation timestamp, the source timeframe tag, and (if any tests have happened) a test-history string showing how deeply each test penetrated and whether bars touched the gap multiple times within their span. Label position is configurable (next to, above, below, or stacked at multiple corners of the box).

A swept marker — when lower-timeframe analysis shows the gap has been filled past a configurable threshold, the box's fill fades sharply and a large centered symbol (default ✗) appears, telling the eye at a glance that this level is "spent."

How gap lifecycle is tracked

The indicator doesn't just detect gaps — it tracks them through their life:

Tested vs untested. Each new bar after a gap forms is checked for wick penetration. The first time a bar's wick crosses the touch-depth threshold (configurable from 1% — any penetration — to 110% — gap fully traversed and SL liquidity beyond it swept), the gap flips from untested to tested. The box style changes correspondingly. The test history label accumulates each touch event, showing depth and multiplicity.

Multi-touch detection. When a bar's range straddles the gap, the indicator does a tick-level scan (within the limits of MT5's tick history) to count how many distinct touches happened in that bar. A single bar can leave a * mark (touched once) or *(N) (touched N times) in the history. This catches bars that hammered a level repeatedly without it being obvious from the candle shape.

Lower-timeframe fill check. Optionally, each gap is checked against a lower timeframe — for example, an H1 slot can have its gaps re-examined on M5 across their full lifetime. This catches fills that the slot's own timeframe missed: an H1 gap that looks untouched on H1 might have been fully traversed by an M5 spike and an immediate reversion that didn't show in the H1 high/low. The deepest LTF penetration is recorded as a percentage; gaps past 100% are considered swept.

Fill removal. When a gap is fully filled (price closes through it on the slot's own timeframe), it's removed from the display list — the slot keeps a fixed quota of unfilled gaps visible, so the chart stays clean as new gaps form and old ones get consumed.

The HUD

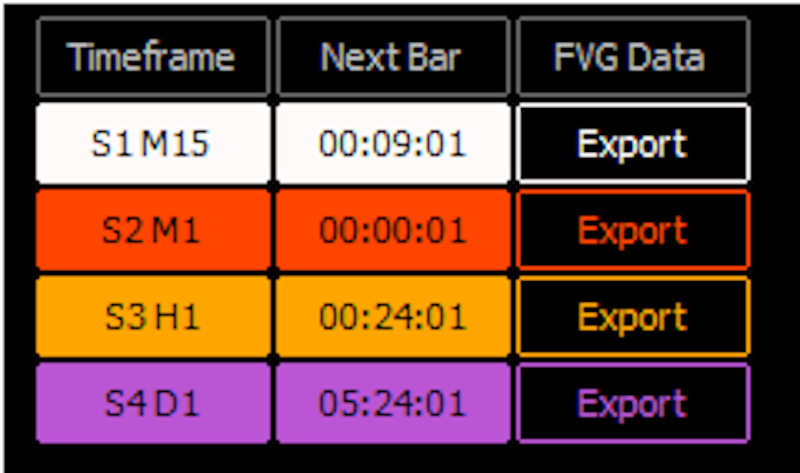
A small on-chart panel — anchored to a configurable corner — gives at-a-glance status and quick controls. Each slot has its own row showing:

Toggle button. Click to show/hide that slot's gaps without modifying input settings. The button shows the slot's source timeframe and reflects its current on/off state.

Countdown. Live countdown to the next bar close on the slot's timeframe. Useful when slots run different timeframes — tells you when each could next produce a new gap.

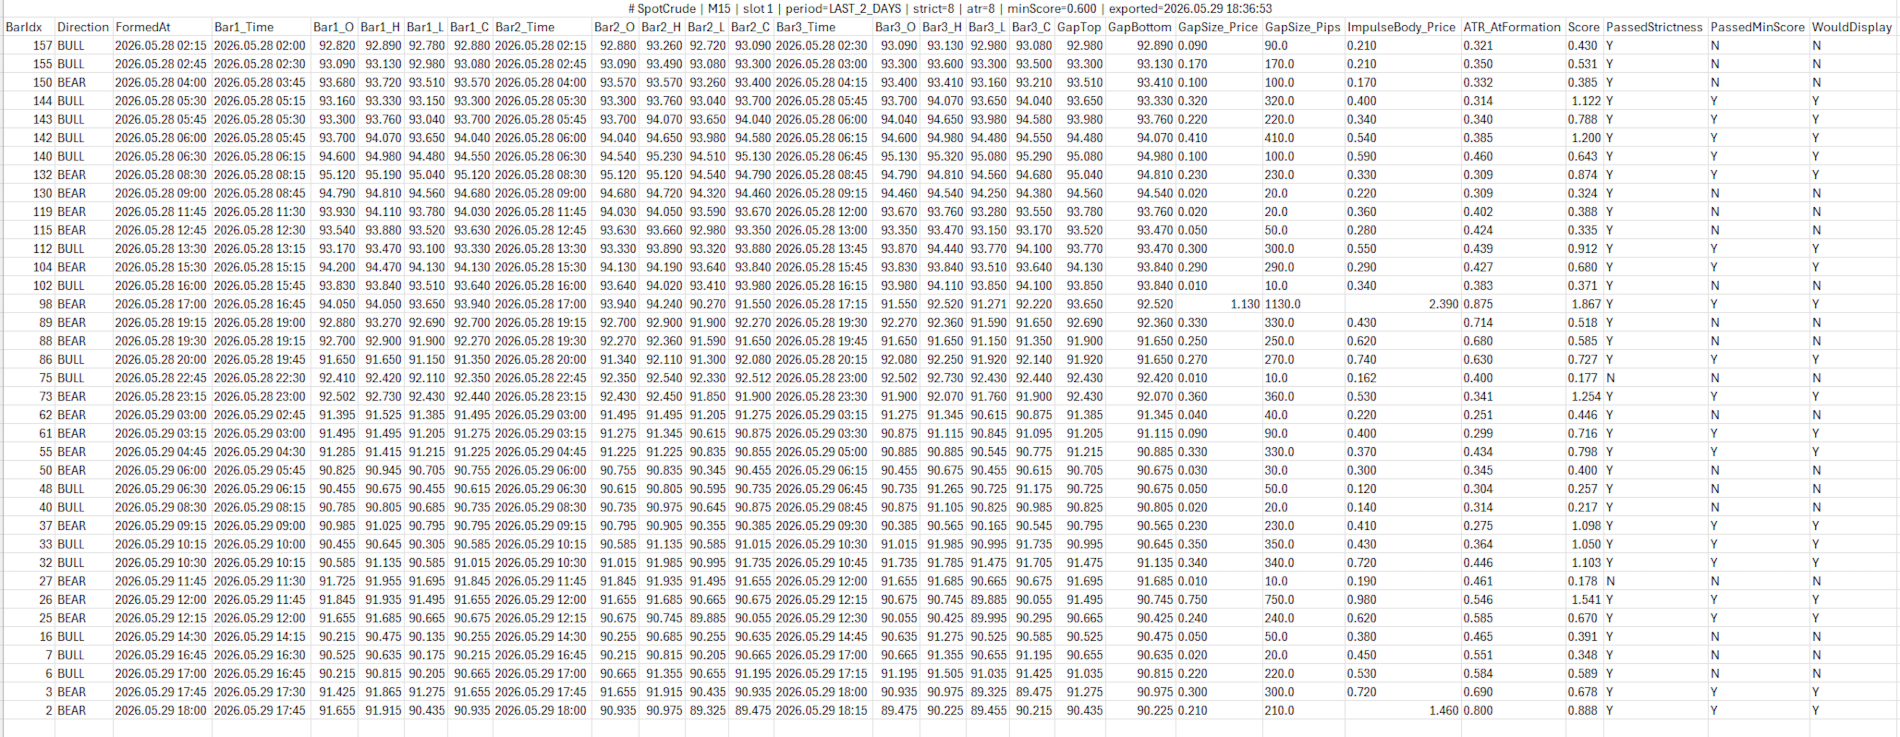
Export button. Triggers a one-shot deep re-scan over a configurable period (today / last 2 days / this week / last 2 weeks / this month / last N bars) and writes a CSV file containing every gap detected — including those filtered out by the current settings, with explicit flags for which gates each gap passed. Lets you analyze score distributions in Excel and choose filter thresholds from data rather than guesswork.

The HUD anchors cleanly to any of the four chart corners; column widths and offsets are configurable.

How the tool is intended to be used

The natural workflow has three phases:

1. Setup. Pick the timeframe arrangement that fits how you trade. Multi-TF if you analyze in layers; single-TF multi-horizon if you want one chart to show multiple interpretations of significance. Set colors, enable the in-box score display, pick a reasonable ATR mode.

2. Tuning. Run with the score visible. Watch how gaps score on the instruments and timeframes you actually trade. Set strictness loose at first to see the distribution; raise it (or set a minimum-score floor) once you can read the difference between meaningful gaps and noise. When you can't decide by eye, export to CSV and analyze the score distribution in Excel.

3. Daily use. With tuning settled, the indicator becomes background information. The boxes show you where levels are. The colors tell you which timeframe each level belongs to. Tested-vs-untested and swept markings tell you which levels are still potent and which are spent. The HUD lets you toggle slots in and out of view depending on what you're focused on.

The indicator does not generate signals, send notifications, or trade. It is a structural overlay; its value is making the FVG framework visible and tractable, so a trader who already uses the concept can use it more efficiently than they could by spotting gaps manually.

What the tool is not

  • It is not a strategy. The FVG concept does not work mechanically — a tested gap can hold or fail, and which one happens depends on context the indicator does not model (trend, session, news, higher-timeframe structure beyond what your slots capture).
  • It is not a real-time alerting system. There are no popups, sounds, or push notifications. The indicator's output is purely visual.
  • It is not predictive. The significance score reflects gap geometry at formation; it does not forecast whether a level will hold or fail. A high-scoring gap is more likely to matter in the statistical sense that it was a real volatility event — but high-scoring gaps fail regularly, and low-scoring gaps sometimes hold cleanly.
  • It is not a substitute for a trading framework. It assumes you already know how you want to use FVGs. Within that assumption, it removes the manual work of finding and tracking them.

Summary

The indicator detects FVGs across multiple configurable horizons, scores them against local volatility, tracks their tested/filled/swept state over their lifetime, and presents the result as a color-coded multi-layer overlay on the current chart. Significance is configurable along two orthogonal axes (volatility window and score threshold), and a per-gap score readout makes the filtering tunable from real numbers rather than abstract knobs. Lifecycle tracking — including lower-timeframe fill detection — distinguishes live levels from spent ones, and a CSV export supports data-driven tuning. The HUD provides quick visibility control and on-demand export without touching the settings dialog.


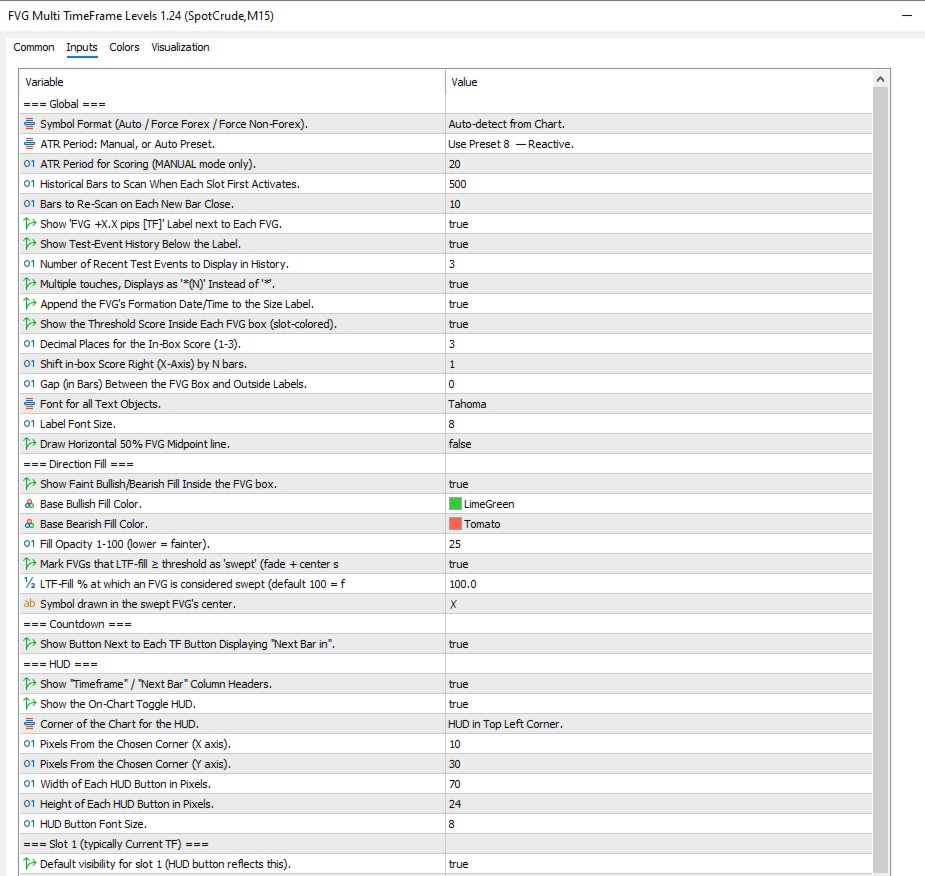
=== Global ===

Settings:

  • Symbol Format (Auto / Force Forex / Force Non-Forex). Controls whether sizes are shown as pips (forex) or raw price units (indices/metals). Auto picks based on the broker's calc mode. Leave on Auto unless an exotic instrument is mislabelled.
  • ATR Period: Manual, or Auto Preset. Global ATR mode used to score significance. Manual / Sensitive 8 / Moderate 21 / Conservative 34. Moderate is the safe default; with per-slot ATR you can leave this on Manual and let each slot pick its own horizon.
  • ATR Period for Scoring (MANUAL mode only). Manual ATR period; ignored unless the mode above is Manual. 10–25 is the useful range. 55+ is too long for intraday FVG.
  • Historical Bars to Scan When Each Slot First Activates. One-time deep scan size at attach / TF change. 500 is plenty for H1. Higher = slower attach and more old FVGs on the chart.
  • Bars to Re-Scan on Each New Bar Close. Sliding window re-checked every bar close, catches late formations. 10 is fine. Push to 20–30 only if you genuinely see real FVGs being missed.
  • Show 'FVG +X.X pips [TF]' Label next to Each FVG. The headline label next to the box (size + TF + formation time + test history). Where most of the textual info lives. Turning it off makes the chart cleaner but you lose those readouts.
  • Show Test-Event History Below the Label. Appends XX% tested (N: 0%*, 44%*, ...) showing how deeply each test penetrated. The * markers indicate multi-touch bars.
  • Number of Recent Test Events to Display in History. How many of the most recent tests are listed. 3–5 is the sweet spot. More may trigger the v1.19 auto-split.
  • Multiple touches, Displays as '(N)' Instead of ''. If a bar touches the FVG more than once, show the count. Off keeps things clean; on if you want to spot multi-touch bars.
  • Append the FVG's Formation Date/Time to the Size Label. Adds the formation timestamp to the size label. Useful for cross-referencing news.
  • Show the Threshold Score Inside Each FVG box (slot-colored). Draws the per-FVG significance score inside the box. The single most useful tuning aid. Keep on while tuning, turn off later for a cleaner chart.
  • Decimal Places for the In-Box Score (1-3). Precision of the in-box score. 2 is right for most charts. Drop to 1 if it crowds small boxes.
  • Shift in-box Score Right (X-Axis) by N bars. Slides the score off the pattern candles into the box's empty area. 3–4 is right for H1+. Bump to 5–6 on lower TFs with thicker candles.
  • Gap (in Bars) Between the FVG Box and Outside Labels. Small breathing space between the box border and outside-mode labels. 1 is right for most modes. Set to 0 to return to flush-against-the-box. Doesn't affect inside-the-box label modes.
  • Font for all Text Objects. Font used by labels and the in-box score. Consolas / Courier New (monospace) makes columns line up.
  • Label Font Size. Point size for all FVG text. 8 fits most charts. Bump to 9–10 on 4K.
  • Draw Horizontal 50% FVG Midpoint line. Faint horizontal line at each FVG's midpoint (applies to all slots). Off by default. Turn on if you trade off the midpoint.


=== Direction Fill ===

Settings:

  • Show Faint Bullish/Bearish Fill Inside the FVG box. Tints each FVG box green or red depending on direction. Makes direction readable at a glance without checking the candles.
  • Base Bullish Fill Color. Color used for the bullish tint. LimeGreen is high-contrast on dark themes.
  • Base Bearish Fill Color. Color used for the bearish tint. Same principle — Tomato is loud on dark themes.
  • Fill Opacity 1-100 (lower = fainter). How strong the tint is. 25 is the sweet spot. Above 50, the fill starts fighting the candles.
  • Mark FVGs that LTF-fill ≥ threshold as 'swept' (fade + center symbol). Toggles the v1.24 swept-FVG visual flag. Only does anything if the slot's Fill Check is on — the flag is driven by fillCheckMaxPct. Set Fill Check 1–2 steps below the slot's TF to populate it.
  • LTF-Fill % at which an FVG is considered swept (default 100 = fully filled). The fill% threshold above which a box gets the swept treatment. 100 = fully filled is the safe default. Drop to 80–90 if you want partially-filled boxes flagged too.
  • Symbol drawn in the swept FVG's center. Unicode character (or any text) placed at the box center when swept. ✗ is unambiguous. ⊘ or ◊ also read cleanly. Avoid long strings — it's font-sized larger than labels and a long string will overflow narrow boxes.


=== Countdown ===

Settings:

  • Show Button Next to Each TF Button Displaying "Next Bar in". Live countdown to the next bar close for each slot's TF. Useful when slots run different TFs.


=== HUD ===

Settings:

  • Show "Timeframe" / "Next Bar" Column Headers. Column headers above the per-slot button rows. Helpful early on; the third header "FVG Data" appears automatically above the Export column.
  • Show the On-Chart Toggle HUD. The HUD panel itself (with per-slot show/hide and export buttons). Turning the HUD off hides the buttons; slots are still configurable via inputs, just not toggleable from the chart.
  • Corner of the Chart for the HUD. Which corner the HUD anchors to. All four corners now align cleanly (v1.26 fix).
  • Pixels From the Chosen Corner (X axis). Horizontal offset from the chosen corner. In right-anchor modes, this is the gap between the HUD's right edge and the chart's right edge (v1.26 — was buggy in v1.22–1.25).
  • Pixels From the Chosen Corner (Y axis). Vertical offset from the chosen corner. Nudge to avoid overlap with chart edges.
  • Width of Each HUD Button in Pixels. Per-button width. 70 fits four short TF labels comfortably.
  • Height of Each HUD Button in Pixels. Per-button height. Make taller on 4K for tap-target sizing.
  • HUD Button Font Size. Font size used inside the HUD buttons. 8–9pt fits a 24px button cleanly.


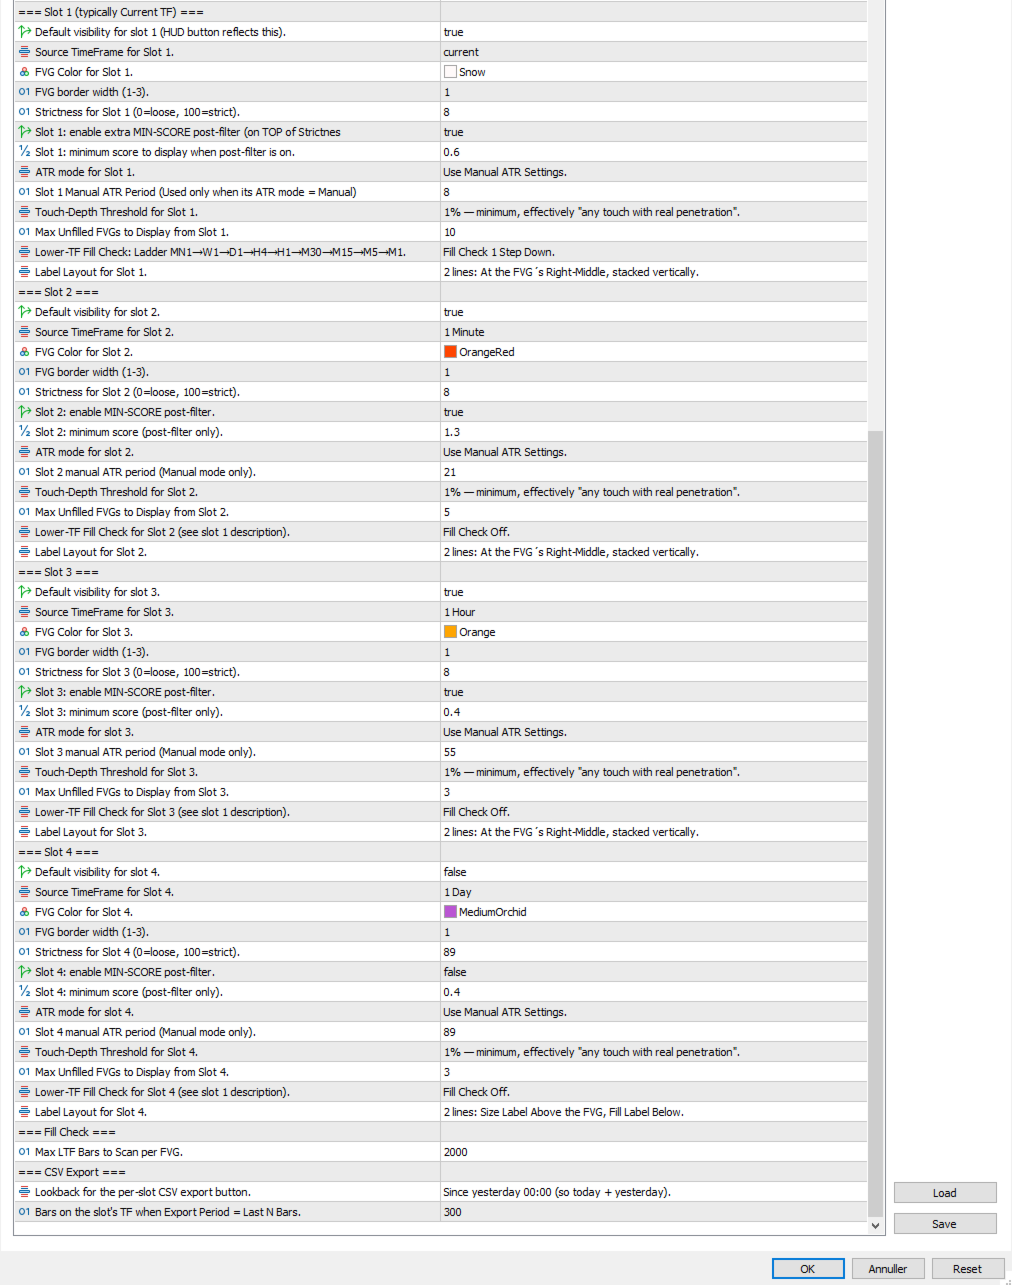
=== Slot 1 (typically Current TF) ===

Settings:

  • Default visibility for slot 1 (HUD button reflects this). Whether slot 1 is enabled on attach. Off is fine for slots you only need occasionally.
  • Source TimeFrame for Slot 1. Which TF this slot scans (use Current to follow the chart). Current follows the chart; pick an explicit TF for a fixed-horizon slot.
  • FVG Color for Slot 1. Color for the border, in-box score, swept symbol, and labels. Give each slot a distinct color — that's how you read which slot any box belongs to.
  • FVG border width (1-3). Box border thickness. Use width to encode importance (1 for noise, 2 for the slot you care about most).
  • Strictness for Slot 1 (0=loose, 100=strict). Minimum significance score a gap must reach to display. 0 = no filter, 50 = middle, 100 = extremely strict. A four-slot ladder of 0/30/55/80 on the same TF gives progressive filters.
  • Slot 1: enable extra MIN-SCORE post-filter (on TOP of Strictness). Toggles a second-stage absolute-score floor layered on top of strictness. Easier to tune than strictness because it's in the same units as the displayed in-box score. "I want nothing under 0.5" → set this on, type 0.5.
  • Slot 1: minimum score to display when post-filter is on. The absolute score floor for this slot. Read the in-box scores, decide where the noise sits, set this slightly above. Has no effect if the toggle above is off.
  • ATR mode for slot 1. Per-slot ATR mode (Inherit Global / Manual / Sensitive 8 / Moderate 21 / Conservative 34). Combined with per-slot strictness, lets the same TF be scored against multiple volatility horizons.
  • Slot 1 manual ATR period (Used only when its ATR mode = Manual). Slot-specific manual ATR period; ignored unless this slot's ATR mode = Manual. Useful if none of the three presets quite match.
  • Touch-Depth Threshold for Slot 1. How deeply price must penetrate to count as a touch: 1% / 10% / 30% / 50% / 90% / 110%. 110%. 30% is a balanced default. 110% flags potential reversals after stop hunts.
  • Max Unfilled FVGs to Display from Slot 1. Cap on how many unfilled FVGs from this slot draw at once. 3–5 keeps things readable.
  • Lower-TF Fill Check: Ladder MN1→W1→D1→H4→H1→M30→M15→M5→M1. Walks a lower TF across the FVG's lifetime to catch fills the slot's own TF can't see. Off is fastest. Required for the swept flag (v1.24) to do anything — drives fillCheckMaxPct. Set 1–2 steps below the slot's TF.
  • Label Layout for Slot 1. Where the size/history label sits: Line1_* (single-line, four positions) or (dual-line, 3 positions). The single-line modes auto-split when text gets too long.


=== Slot 2 / Slot 3 / Slot 4 ===

Same input set as Slot 1 — every row above repeats per slot (including the new min-score pair), with these defaults differing:

e.g.

Slot 1 Current Timeframe

Slot 2 H1

Slot 3 H4

Slot 4 D1


=== Fill Check ===

Settings:

  • Max LTF Bars to Scan per FVG. Global cap on the lower-TF scan length used when any slot's Fill Check is enabled. 2000 covers most cases. Lower to 500–1000 if you see lag on deep ladders.


=== CSV Export ===

Settings:

  • Lookback for the per-slot CSV export button. How far back to re-scan when an Export button is pressed. Today / Last 2 Days / This Week / Last 2 Weeks / This Month / Last N Bars.
  • Bars on the slot's TF when Export Period = Last N Bars. Lets you export an exact-length window when the calendar presets don't fit.
Produits recommandés
A tool for creating Bill Williams indicators Our tool provides the ability to set Bill Williams indicators on a chart with a mouse click. - The Awesome Oscillator (AO) indicator helps to assess the driving force of the trend. - Alligator indicator — determines the current state of the trend and possible entry and exit points. - Fractals indicator — helps to identify significant levels  - Accelerator Oscillator (AC) indicator — shows the change in trend acceleration. - Market Facilitation Index
FREE
Momentum Breakout Envelope MT5 is an advanced momentum structure indicator designed to detect breakout pressure, trend acceleration, and potential reversal zones through the interaction between a dynamic envelope and a proprietary Momentum Core. The indicator creates adaptive upper and lower momentum boundaries while continuously tracking internal market strength to highlight periods of imbalance and expansion. A key way to use the indicator is by monitoring how the Momentum Core reacts around
Volatility Signals MT5 est un système de trading basé sur les principes de la volatilité des instruments. Il intègre des algorithmes pour déterminer la direction du marché et calculer les points hauts et bas de retournement sur le graphique des prix. Il calcule les niveaux cibles clés dès l'apparition d'un signal. Lors de l'exécution d'une transaction, vous visualisez en permanence les points d'entrée potentiels, les niveaux de stop-loss et de take-profit. Les algorithmes de base de l'indicat
Strength Radar2
Erick Guimaraes Dos Santos
Strength Radar 02 – Take Your Trading to the Next Level! Hello, trader! If you're looking for a tool to level up your game in forex, Strength Radar 02 is exactly what you need! Developed with passion and expertise, this indicator turns currency strength analysis into something simple and powerful. With it, you'll have a clear view of the real-time performance of AUD, CAD, CHF, EUR, GBP, NZD, JPY, and USD , using indicators like MA, MACD, RSI , and more — all fully customizable your way! Ima
MT5 Multiframe Signal is a sleek and powerful dashboard indicator built for MetaTrader 5. It instantly displays BUY/SELL direction across all major timeframes — M1, M5, M15, M30, H1, H4, D1 — using advanced EMA‑based trend analysis. The panel delivers real‑time, zero‑delay signals with precise strength measurement and clean visual layout. Works flawlessly on all instruments, including forex pairs (EURUSD, GBPUSD, USDJPY) and metals (XAUUSD) . Maximum clarity, maximum performance — ideal for s
News Bias Engine
Leonardo Andriulli
News Bias Engine — Real-Time Economic Calendar with Post-News Directional Bias Most news indicators show you WHEN events happen. News Bias Engine tells you WHAT TO DO after they happen. THE PROBLEM WITH STANDARD NEWS INDICATORS Every economic calendar tool on the market does the same thing: displays upcoming events with countdown timers. That's useful, but it's only half the job. The real question after NFP, CPI, or an FOMC rel
Overview TriParity AfterShock PRO Scanner est un indicateur de tableau de bord discrétionnaire pour MetaTrader 5. Dans cette description, une triade désigne la relation entre trois paires de devises ou instruments. Le Scanner examine plusieurs triades et plusieurs unités de temps dans un seul panneau et aide le trader à organiser une liste de surveillance de manière plus structurée. Son objectif est de réduire la surcharge de graphiques, de comparer les candidats côte à côte et de mettre en évid
HA Metals Flow Chart is a visual MetaTrader 5 indicator designed to make the flow of gold and silver easier to read. It replaces the standard chart display with synthetic Heikin Ashi candles and combines flow classification, normalized momentum, confirmed market structure events and a compact dashboard in a single interface. The indicator is intended for discretionary chart analysis. It does not open, modify or close trades. MAIN FEATURES - Synthetic Heikin Ashi chart for a cleaner view of direc
FREE
Currency Strength Meter Heatmap Currency Strength Meter Heatmap is a real-time analysis tool that measures the relative strength of all eight major currencies and displays the results in two complementary formats: a color-coded heatmap matrix and a live strength line chart. Instead of watching individual pairs in isolation, traders can see at a glance which currencies are gaining momentum and which are losing it, across USD, EUR, GBP, JPY, AUD, NZD, CAD, and CHF simultaneously. The indicator cal
Market Ticker Pro MT5
John Louis Fernando Diamante
The only Market Ticker on the market! Add a professional novelty to your workspace, with built in mini-charts A scrolling Market Ticker that displays price changes from all symbols in the Market Watch list. Provides an easy snapshot of symbol prices, and keeps scrolling automatically while you trade and analyse the chart. The ticker color (+/- price changes) are based on either the current or completed candle, and the previous candle. Options include: - MTF, eg choose to show price changes of t
Knowledge of the strength and weakness of each currency is vital for every forex trader. Our   Currency Strength Meter indicator   measures the strength of eight major currencies (USD, EUR, GBP, CHF, JPY, CAD, AUD, NZD) by using the Relative Strength Index indicator, also known as RSI. The Currency Strength Meter indicator shows you, simply and quickly, when a currency is oversold, overbought, or in "normal area". This way, you can identify which currency is the strongest and the weakest. Our
Trade Info Lightweight Dashboard MT5 Trade Info Lightweight Dashboard MT5 is a modern and lightweight performance dashboard designed for MetaTrader 5 traders who want to monitor trading results clearly and efficiently directly from the chart. The indicator displays detailed daily, weekly, monthly, and yearly trading statistics in a clean and professional interface without slowing down the platform. It is optimized for low resource usage and suitable for manual traders, scalpers, swing traders, a
FREE
Candle Close Timer Matrix – MT5 Candle Countdown Indicator Candle Close Timer Matrix is a lightweight and powerful MetaTrader 5 (MT5) candle countdown indicator that shows exactly how many minutes and seconds are left before the current candle closes on any symbol and any timeframe. Download MT5 EA Products Whether you are a scalper , intraday trader or swing trader , knowing the exact candle close time helps you: Time your entries on candle close Avoid impulsive mid-candle decisions Sync your t
FREE
• Please test the product in the Strategy Tester before purchasing to understand how it works. • If you face any issues, contact me via private message—I’m always available to help. • After purchase, send me a screenshot of your order to receive a   FREE EA   as a gift. Introducing the Star Path Stochastic Cross Indicator Ready to explore your trading potential? The Star Path Stochastic Cross Indicator is here to guide your path. Designed for traders who love flexibility, this indicator is not
Mtf Snr Levels
Okeene Rajae Chambers
MTF SNR Levels Multi-timeframe support & resistance — automatically filtered to what matters right now. MSNR EQ Levels maps the key horizontal levels across every timeframe and keeps only the ones still in play. Outdated and broken structure is dropped for you, so your chart stays clean and focused on the price zones most likely to matter next — no manual redrawing, no clutter. Every level is cross-checked across timeframes before it earns a place on your chart, so what you see is a curated set
Detector Fix
Vitalii Zakharuk
Detector Fix indicator. Currency pairs never rise or fall in a straight line. Their ups and downs are interspersed with rollbacks and reversals. Every rise and fall is reflected in your emotional state: hope is replaced by fear, and when it passes, hope appears again. The market uses your fear to prevent you from taking advantage of a strong position. At such moments you are most vulnerable. Everything will change if you use the Detector Fix indicator. The Detector indicator was created to n
Cm Ultimate Ma Mtf MT5
Biswarup Banerjee
4 (1)
Découvrez une précision de trading améliorée avec le CM Ultimate MA MTF MT5, un indicateur de moyenne mobile sophistiqué conçu exclusivement pour MetaTrader 5. Cet indicateur est parfait pour les traders cherchant à intégrer l'analyse multi-temporelle dans leurs stratégies, fournissant des informations précieuses sur les tendances du marché et les mouvements des prix. Le CM Ultimate MA MTF MT5 offre un avantage concurrentiel en permettant aux utilisateurs de visualiser les signaux clés du marché
MT5 Session Indicator: Track Global Market Hours with Precision Boost your trading strategy with this FREE Session Indicator for MetaTrader 5 , designed to help you effortlessly identify active trading sessions across global markets. Perfect for forex, stocks, and commodities traders, this tool highlights key market hours (Asian, European, North American, and overlaps) directly on your chart, ensuring you never miss high-liquidity periods. Key Features: Visual Session Overlays : Clear color-c
FREE
Previous Candle Levels MT5
Wachinou Lionnel Pyrrhus Sovi Guidi
1 (1)
Previous Candle Levels MT5 affiche les niveaux de bougies précédents,  il affiche les niveaux d'ouverture (Open), du prix le plus haut (High), du prix le plus bas (Low) et du prix de clôture (Close) de la bougie précédente sur différentes périodes. Ces niveaux sont souvent appelés OHLC. Il est conçu pour aider le trader à analyser le marché et à faire attention aux niveaux OHLC de la bougie précédente sur différentes unités de temps.  Nous savons tous que les niveaux OHLC mensuels (MN), hebdoma
FREE
Upper and Lower Reversal - Système de prévision précoce des moments d'inversion. Vous permet de trouver les points d’inflexion des prix aux limites des canaux de mouvement des prix supérieur et inférieur. L'indicateur ne recolorera jamais ni ne changera la position des flèches de signal. Les flèches rouges sont un signal d'achat, les flèches bleues sont un signal de vente. S'adapte à tous les délais et instruments de trading L'indicateur ne se redessine pas, il ne fonctionne que lorsque la bou
Trend Monitor VZ MT5
Sergey Ermolov
5 (1)
Trend Monitor VZ – Surveillance du marché basée sur la structure de tendance. Si vous analysez plusieurs instruments, vérifier la direction de la tendance peut prendre beaucoup de temps. Trend Monitor VZ regroupe toutes ces informations dans un seul panneau et affiche simultanément la direction de la tendance sur plusieurs instruments et unités de temps. L’ensemble du marché en un coup d’œil Un moniteur de marché apparaît directement sur votre graphique et affiche la direction de la tendance po
BotM5 MT5
Aleksandr Makarov
BotM5 MT5  Exact entry points for currencies, crypto, metals, stocks, indices! Special offer -  https://www.mql5.com/en/users/bossik2810 Indicator 100% does not repaint!!! If a signal appeared, it does not disappear! Unlike indicators with redrawing, which lead to loss of deposit, because they can show a signal, and then remove it. Trading with this indicator is very easy. Wait for a signal from the indicator and enter the deal, according to the arrow  (Aqua arrow - Buy, Red - Sell).
Tempesta
貴 広 井 上
BTC/USD  SCALPING スキャルピング型EA こちらは仮想通貨向け自動売買プログラムとなっております。 シグナル公開予定 通貨ペア :BTC/USDに最適なナンピン及び利確設定をしております ロット数:0.01~ パラメータ ・ロット数:最初の注文ロット数を入力してください。これを基準に、ナンピンに増加していきます。 ・ナンピン:ONにするとナンピンを行いますので、ONにしてご利用ください。 ポジション数: 最大21ポジション 時間足 :M1 注文条件 ・EA起動後、一定の値動きで逆張りを行います。 ・100BTC/USDごとにナンピンを行います。(ただし証拠金維持率が500%以上のあいだ) ・一定の利益にて全決済を行います。 その他 ・マーチングゲールではありませんが、ナンピンを行うため、ある程度のリスクがございます。 ・証拠金は1000USD以上を推奨しております。
ToolBox 360 is the swiss knife of all indicators. It is full packed with useful tools to help you with your trading. It can be used to find best entry and exit points and help you to decide if you should open a trade or not. It shows market trends, candlestick formations outside / inside bars and you can sett time based allerts. Main features: Time based Fibonacci lines Choose a start and end time and the indicator shows you Fibonacci lines within the selected time range including range high a
Vertex Structure Dashboard delivers a complete multi-timeframe market structure analysis in a single, compact panel. It monitors up to 9   timeframes simultaneously and displays trend bias, structural breaks, momentum, and value zones in real time — no tab-switching, no manual   tracking.   The panel is fully draggable and collapsible. Its position persists across timeframe changes through GlobalVariables, so your layout stays   exactly where you placed it.   How It Works   Each enabled tim
Indicateur unique qui met en œuvre une approche professionnelle et quantitative pour signifier le trading de réversion. Il capitalise sur le fait que le prix dévie et revient à la moyenne de manière prévisible et mesurable, ce qui permet des règles d'entrée et de sortie claires qui surpassent largement les stratégies de trading non quantitatives. [ Installation Guide | Update Guide | Troubleshooting | FAQ | All Products ] Des signaux de trading clairs Étonnamment facile à échanger Couleurs et t
SDZ Trend Pro
Van Toan Nguyen
Overview SDZ Trend Pro is a professional Expert Advisor work for all symbol, recommend  XAUUSD (Gold) trading on the H1 timeframe . It combines dynamic price action patterns, EMA filters, and strict session-based trading logic to identify precise market entries with optimal risk control. This EA is ideal for traders who prefer structured, time-filtered trading during active market hours. ️ Core Features Dynamic Stop Loss (SL) logic Automatically sets SL based on candle pattern Chooses the
Ultimate Boom and Crash Indicator The Ultimate Boom and Crash Indicator is a cutting-edge tool developed by  Coetsee Digital , designed to identify potential spike opportunities in the market. Crafted for traders focusing on Deriv and Weltrade synthetic markets, this indicator is optimized to operate exclusively on the 3-minute (M3), 5-minute (M5), 15-minute (M15), 30-minute (M30), and 1-hour (H1) timeframes and supports only the following pairs: PainX 1200, PainX 999, PainX 800, PainX 600, Pai
Spread & News Sentinel – Market Condition Intelligence for MT5 Monitor the conditions around your trades, not just the price. Spread & News Sentinel is a professional MetaTrader 5 monitoring indicator designed to give traders greater visibility into two market conditions that can have a major impact on trade execution: spread behaviour and economic news . Rather than adding another buy/sell signal to the chart, Sentinel focuses on what is happening around the market — monitoring changing spread
Session Indicator — Forex Trading Sessions Visualizer Overview Session Indicator   is a professional MT5 indicator that displays the four major forex trading sessions (Sydney, Tokyo, London, New York) as colored horizontal bands on your chart. Never miss a trading session again! Free Product   |   Works on Any Broker   |   Auto-Detects Timezone Features Auto-Detects Broker GMT Offset Works automatically on any MT5 broker (XM, IC Markets, FXCM, etc.) No manual timezone configuration needed Label
FREE
Les acheteurs de ce produit ont également acheté
Ce produit a été mis à jour pour le marché 2026 et optimisé pour les dernières versions de MT5. AVIS DE MISE À JOUR DU PRIX : Smart Trend Trading System est actuellement disponible à $99 . Le prix passera à $199 après les 30 prochains achats . OFFRE SPÉCIALE : Après avoir acheté Smart Trend Trading System, envoyez-moi un message privé pour recevoir Smart Universal EA GRATUITEMENT et transformer vos signaux Smart Trend en trades automatisés. Smart Trend Trading System est un système de trading c
Trend Sniper X
Sarvarbek Abduvoxobov
5 (12)
Trend Sniper X est un indicateur de suivi de tendance multi-période pour MetaTrader 5 qui aide les traders à identifier la direction de la tendance et les points de retournement potentiels avec clarté et précision. Informations sur le prix : Le prix actuel est un prix promotionnel et est sujet à changement à mesure que les futures mises à jour et nouvelles fonctionnalités seront publiées. Chaîne Code2Profit Maîtrisez le marché grâce à l'analyse multi-unités de temps ! Comment maximiser votre tau
Neuro Poseidon MT5
Daria Rezueva
4.85 (54)
Neuro Poseidon is a new indicator by Daria Rezueva. It combines precise trading signals with adaptive TP/SL levels - creating best possible trades as a result! Message me and get  Neuro Poseidon Assistant  as a gift to automize your trading process! What makes it stand out? 1. Proven profitability on all assets and timeframes 2. Only confirmed BUY and SELL signals present on the chart 3. Adaptive TP & SL levels generated by the software for each trade 4. Easy to understand - suitable for al
SuperScalp Pro
Van Minh Nguyen
4.63 (32)
SuperScalp Pro –  Système Professionnel de Scalping à Confluence Multicouche SuperScalp Pro est un système professionnel de scalping à confluence multicouche, conçu pour aider les traders à identifier des opportunités à plus forte probabilité grâce à des confirmations d'entrée plus claires, des niveaux de Stop Loss et de Take Profit basés sur l'ATR, ainsi qu'un filtrage flexible des signaux sur le XAUUSD, le BTCUSD et les principales paires de devises du Forex. La documentation complète est disp
Welcome to ENTRY IN THE ZONE AND SMC MULTI TIMEFRAME Entry In The Zone and SMC Multi Timeframe is a real-time market analysis tool based on Smart Money Concepts (SMC), designed to analyze market structure, price direction, and key trading zones. It supports both Single-Timeframe Analysis and Multi-Timeframe Analysis, providing a clearer view of the overall market structure across multiple timeframes, with real-time BUY / SELL signals that do not repaint. It is designed to help filter trading opp
Commençons par être honnêtes. Aucun indicateur ne vous rendra rentable à lui seul. Si quelqu’un vous dit le contraire, il vous vend un rêve. Tout indicateur qui affiche des flèches parfaites d’achat/vente peut être rendu impeccable — il suffit de zoomer sur la bonne partie de l’historique et de capturer uniquement les trades gagnants. Nous ne faisons pas cela.  SMC Intraday Formula est un outil. Il lit la structure du marché pour vous, identifie les zones de prix à la probabilité la plus élevée
Divergence Bomber
Ihor Otkydach
4.89 (94)
De temps en temps, je trade moi-même selon ce système. Découvrez mon trading manuel « BOMBER » sur un compte réel : LIVE SIGNAL Chaque acheteur de cet indicateur reçoit également gratuitement : L’outil exclusif « Bomber Utility », qui accompagne automatiquement chaque opération de trading, fixe les niveaux de Stop Loss et de Take Profit, et clôture les positions selon les règles de la stratégie Des fichiers de configuration (set files) pour adapter l’indicateur à différents actifs Des set files
Atomic Analyst MT5
Issam Kassas
4.44 (54)
Ce produit a été mis à jour pour le marché 2026 et optimisé pour les dernières versions de MT5. AVIS DE MISE À JOUR DU PRIX : Atomic Analyst est actuellement disponible à $99 . Le prix passera à $199 après les 30 prochains achats . OFFRE SPÉCIALE : Après avoir acheté Atomic Analyst, envoyez-moi un message privé pour recevoir Smart Universal EA GRATUITEMENT et transformer vos signaux Atomic Analyst en trades automatisés. Atomic Analyst est un indicateur de trading Price Action sans repaint, san
Superhero
Ihor Otkydach
5 (2)
L'indicateur SUPERHERO est un système de trading multidevises conçu selon un principe « tout compris ». Cet indicateur analyse le marché de manière autonome et fournit des signaux indiquant quand ouvrir et clôturer des positions. Il utilise des ordres Stop Loss et Take Profit. Le rapport R:R est de 1:1. De temps en temps, je passe moi-même des ordres en me basant sur les signaux de ce système, et voici les résultats que j'obtiens — SIGNAL EN DIRECT Ce système peut envoyer des notifications push
La légende est de retour : Entry Points Pro 10. La relance de l'indicateur légendaire qui s'est maintenu 3 ans dans le Top-3 du MQL5 Market. Des centaines d'avis enthousiastes (589 sur les deux versions), des milliers de traders l'utilisent chaque jour, 31 000+ téléchargements de la démo   MT4+MT5 . J'ai lu chacun de vos avis publiés en cinq ans — et au lieu de promettre, j'ai intégré les réponses directement dans la version 10. Par un auteur présent sur les marchés depuis 1999, qui tient à l'ho
M1 Sniper MT5
Oleg Rodin
5 (6)
M1 SNIPER   est un système d'indicateurs de trading facile à utiliser. Il s'agit d'un indicateur à flèche conçu pour l'unité de temps M1. Cet indicateur peut être utilisé seul pour le scalping sur l'unité de temps M1 ou intégré à votre système de trading existant. Bien que conçu spécifiquement pour le trading sur l'unité de temps M1, ce système peut également être utilisé avec d'autres unités de temps. Initialement, j'avais conçu cette méthode pour le trading du XAUUSD et du BTCUSD. Cependant, j
Gann Made Easy   est un système de trading Forex professionnel et facile à utiliser qui est basé sur les meilleurs principes de trading en utilisant la théorie de mr. WD Gann. L'indicateur fournit des signaux d'ACHAT et de VENTE précis, y compris les niveaux Stop Loss et Take Profit. Vous pouvez échanger même en déplacement en utilisant les notifications PUSH. VEUILLEZ ME CONTACTER APRÈS L'ACHAT POUR RECEVOIR GRATUITEMENT DES INSTRUCTIONS DE TRADING ET D'EXCELLENTS INDICATEURS SUPPLÉMENTAIRES! V
FiboSniper Pro
Van Minh Nguyen
5 (2)
FiboSniper Pro – Système professionnel de trading Fibonacci Grid avec filtres multiples FiboSniper Pro est un système avancé d’indicateurs techniques de trading qui combine les Fibonacci Envelopes avec plusieurs niveaux de confirmation du marché, notamment ADX, EMA, RSI, ATR et des filtres horaires. En combinant l’analyse de la structure des prix, de la tendance, du momentum et de la volatilité, il aide les traders à identifier des opportunités d’entrée plus sélectives et de meilleure qualité, t
L'indicateur UZFX {SSS} Scalping Smart Signals v4.0 MT5 est un indicateur de trading haute performance sans « repaint », conçu pour les scalpers, les day traders et les swing traders qui recherchent des signaux précis et en temps réel sur des marchés très volatils. Développé par (UZFX-LABS), cet indicateur combine l'analyse de l'action des prix, la confirmation de tendance et un filtrage intelligent pour générer des signaux d'achat et de vente à forte probabilité, des signaux d'alerte et des opp
Trend Catcher ind mt5
Ramil Minniakhmetov
5 (18)
INDICATEUR DE DÉTECTEUR DE TENDANCE L'indicateur de détecteur de tendance analyse les mouvements de prix du marché grâce à une combinaison d'indicateurs d'analyse de tendance adaptatifs, propriétaires et personnalisés. Il identifie la véritable direction du marché en filtrant les fluctuations à court terme et en se concentrant sur la force de la dynamique sous-jacente, l'expansion de la volatilité et la structure des prix. Il utilise également une combinaison d'indicateurs personnalisés de lis
Crystal Heikin Ashi Signals
Muhammad Jawad Shabir
5 (3)
Crystal Heikin Ashi Signals - Professional Trend & Signal Detection Indicator Advanced Heikin Ashi Visualization with Intelligent Signal System for Manual & Automated Trading Final Price: $149 ---------> Price goes up $10 after every 10 sales . Limited slots available — act fast . Overview Crystal Heikin Ashi Signals is a professional-grade MetaTrader 5 indicator that combines pure Heikin Ashi candle visualization with an advanced momentum-shift detection system. Designed for both manual traders
Power Candles MT5
Daniel Stein
5 (10)
Power Candles V3 - Indicateur de force à optimisation automatique Power Candles V3 transforme la force des devises et des instruments en un plan de trading exploitable sur chaque graphique auquel il est associé. Au lieu de se contenter de colorer les bougies, il effectue une optimisation automatique en temps réel en arrière-plan et vous fournit les meilleurs niveaux de Stop Loss, Take Profit et seuils de signal pour le symbole que vous avez sous les yeux. Un simple clic suffit pour l'adopter en
Axiom Matrix
Issam Kassas
5 (6)
AXIOM MATRIX MT5 PRIX DE LANCEMENT : $99 Axiom Matrix est disponible au prix de lancement de $99. Le prix passera à $199 après les 30 premiers achats. Après votre achat, envoyez-moi un message direct pour recevoir les instructions et réclamer votre bonus cadeau exclusif. Axiom Matrix est un scanner de marché professionnel multi-symboles et multi-timeframes, ainsi qu’un tableau de bord de décision pour MetaTrader 5. Il scanne votre Market Watch, analyse plusieurs timeframes, lit plusieurs moteurs
Gem SIGNAL
Shengzu Zhong
5 (1)
GEM Signal Pro GEM Signal Pro est un indicateur de suivi de tendance pour MetaTrader 5, conçu pour les traders qui souhaitent des signaux plus clairs, des configurations de trade plus structurées et une gestion du risque plus pratique directement sur le graphique. Au lieu d’afficher simplement une flèche, GEM Signal Pro aide à présenter l’idée complète du trade de manière plus claire et plus lisible. Lorsque les conditions sont confirmées, l’indicateur peut afficher le prix d’entrée, le stop los
KURAMA GOLD SIGNAL PRO (MT5) — Filtre à 7 couches · TP/SL automatique · Score de qualité · Sauvegarde de l'historique des signaux | Système de trading complet pour le XAUUSD Pas de repeint en temps réel. À l'instant où un signal apparaît, la flèche, l'entrée, le TP et le SL sont verrouillés sur place et ne bougent plus jamais ensuite. Ce que vous tradez, c'est ce signal en temps réel. Et dans la v7.20, chaque signal réellement envoyé est sauvegardé automatiquement et restauré à l'identique aprè
Advanced Supply Demand MT5
Bernhard Schweigert
4.53 (15)
La meilleure solution pour tout commerçant débutant ou expert ! Cet indicateur est un outil de trading unique, de haute qualité et abordable car nous avons intégré un certain nombre de fonctionnalités propriétaires et une nouvelle formule. Avec cette mise à jour, vous pourrez afficher des zones à double horaire. Vous pourrez non seulement afficher un TF plus élevé, mais afficher les deux, le graphique TF, PLUS le TF supérieur : AFFICHAGE DES ZONES NICHÉES. Tous les traders Supply Demand vont ado
SkyHammer Signal Pro Indicateur professionnel de signaux de tendance sans repaint, avec niveaux Entry, SL et TP verrouillés SkyHammer Signal Pro est un indicateur de tendance et de momentum structuré, conçu pour les traders qui recherchent des signaux clairs, fixes et vérifiables. Il fonctionne le mieux sur les timeframes courts, comme M1 et M5 . L’indicateur ne cherche pas à prédire les sommets ou les creux du marché. Il attend plutôt une structure de marché confirmée, une direction de tendance
Ace Trend
Mikhail Sergeev
5 (3)
Nous vous présentons un indicateur révolutionnaire qui change les règles du jeu dans le monde du trading de tendance. L'indicateur est conçu pour repenser les performances et élever votre expérience de trading à un niveau sans précédent. Notre indicateur dispose d'une combinaison unique de fonctionnalités avancées qui le distinguent de ses concurrents. La technologie de pointe "Real Pricing Factors" offre une durabilité inégalée, même dans les conditions de marché les plus difficiles et les plus
Crystal Quantum Pro
Muhammad Jawad Shabir
5 (2)
CRYSTAL QUANTUM PRO Institutional Signal & Trade Intelligence for MetaTrader 5 Final Price: 199 USD ----> Price goes up 10 USD after every 10 sales. Limited launch slots available, act fast. Most indicators give you an arrow and leave you alone. A naked arrow is a gamble. Winning consistently requires CONFLUENCE , a clear STOP and TARGET , and honest PROOF that the system works. Crystal Quantum Pro delivers all three in one clean, no-repaint package. Crystal Quantum Pro is a complete decision sy
Reversion King Indicator
Eugen-alexandru Zibileanu
5 (6)
Un nouveau Roi en ville - Indicateur + Gestion des ordres (TP1 + TP2 + TP3) + Envoi optionnel de signaux Telegram INCLUS (GRATUIT) (SYSTÈME COMPLET DE TRADING et DE SIGNAUX) Notre meilleur EA pour l’Or : Gold Slayer Cet indicateur inclut une stratégie avancée, un système de trading avec gestion des ordres personnalisable ainsi qu’un système de retour à la moyenne combinant des extensions d’enveloppes, soutenu par plusieurs filtres intelligents de confirmation comme le RSI afin de détecter des en
M1 Quantum MT5
Hamed Dehgani
4.27 (11)
Signaux de Trading en Direct avec M1 Quantum : Signal   (L’opération est exécutée automatiquement par le Quantum Trade Assistant , inclus gratuitement avec ce produit.) Dernières nouvelles : La version 1.64 a été publiée. Toutes les transactions disposent désormais d’un Stop Loss placé derrière les zones de support/résistance correspondantes. La fonction Smart Close a également été améliorée afin d’augmenter les performances de l’EA dans cette version. Depuis le 9 août, le signal en direct fonc
FX Power MT5 NG
Daniel Stein
5 (33)
FX Power : Analysez la force des devises pour des décisions de trading plus intelligentes Aperçu FX Power est l'outil essentiel pour comprendre la force réelle des principales devises et de l'or, quelles que soient les conditions du marché. En identifiant les devises fortes à acheter et les faibles à vendre, FX Power simplifie vos décisions de trading et révèle des opportunités à forte probabilité. Que vous suiviez les tendances ou anticipiez les retournements à l'aide de valeurs extrêmes de D
Ce produit a été mis à jour pour le marché 2026 et optimisé pour les dernières versions de MT5. AVIS DE MISE À JOUR DU PRIX : Smart Price Action Concepts est actuellement disponible à $200 . Le prix passera à $299 après les 30 prochains achats . OFFRE SPÉCIALE : Après l’achat, envoyez-moi un message privé pour recevoir un bonus gratuit + un cadeau . Tout d’abord, il est important de souligner que cet outil de trading est un indicateur sans repaint, sans redrawing et sans retard, ce qui le rend
SR Liquidity   est un indicateur de trading conçu pour révéler les zones cachées où se concentre la liquidité du marché et où le prix réagit avec le plus d'intensité. Ces zones de liquidité spécifiques agissent comme de puissants niveaux de support et de résistance, vous offrant une cartographie claire des points où le marché est le plus susceptible de se retourner. Plutôt que de tracer des lignes de support et de résistance classiques, l'indicateur SR Liquidity analyse le comportement réel des
UNIX Scalper — Gold Scalping Indicator for MetaTrader 5 UNIX Scalper is a focused Gold scalping indicator designed primarily for XAUUSD on M1, M2, M3, M5, M10 and M15. It gives the trader a clear BUY, SELL or WAIT decision together with the complete trade plan: Entry, Stop Loss, TP1 and TP2 . PRICE UPDATE NOTICE: Currently available for $199. The price will   increase to $399   after the next   30 purchases . The concept is simple: wait for the signal, follow the levels, move the Stop Loss to
Plus de l'auteur
News Markers Description Version: 1.13Type: MetaTrader 5 indicator (chart window) Purpose: Plots economic-calendar news events as color-coded vertical lines on the chart, with optional currency tags and an upcoming-news HUD panel. Before you start — three things that always apply Live connection required. The data comes from MT5's built-in economic calendar via your broker's feed. It returns nothing in the Strategy Tester, and nothing if your broker doesn't serve calendar data. If no lines appe
FREE
What Is Fibonacci Pilot Mini? Fibonacci Pilot Mini is a semi-automatic Expert Advisor for MetaTrader 5. It assists the trader in placing Fibonacci-based trades by automating the mechanical steps after the trader has identified the swing. The trader performs the analysis; the EA handles lot sizing, entry price calculation, stop loss, take profit levels, and order placement. Mini is the streamlined single-setup edition of Fibonacci Pilot Pro. It runs one trade setup at a time with a clean, minima
FREE
The Simple Manual Trading Panel (v2.11) Is a professional trade management tool designed with a clean, movable UI to streamline manual execution and automated exit strategies. Core Features Dynamic Visual Interface: A movable GUI panel that provides real-time information including a bar countdown timer, live spread, and advanced volume analysis. Flexible Lot Size setting, with 2 decimals (If broker supports it). Multi-Stage Take Profit: Supports three distinct Take Profit (TP) levels in either
Trend Matrix Panel is a multi-timeframe technical indicator for MetaTrader 5 that compresses an entire trading session's structural picture into a single panel. Rather than flipping between charts to read M1, M15, H1, and D1 separately, the panel shows the trend state of three configurable moving averages across twelve timeframes simultaneously, with a heatmap that draws your eye to the genuinely strong signals and away from noise. The core idea is simple: every cell in the matrix tells you how
This script is an Intelligence Gathering Utility designed to give you full control over your data exports from MetaTrader 5. It allows you to synchronize up to three different symbols into a single file with precise timestamping. 1. Setting the Data Range (Range) You can define exactly which historical period you want to capture: Date Mode : If Last N bars (0 = use date range above) is set to 0 , the script will export all data between your chosen start and end dates. Bar Mode : By entering a nu
The primary function of this script, Tick Data Exporter , is to efficiently extract historical tick data. Tick data represents the most granular level of market data, capturing every single price change. The script downloads this data from a broker and formats it into CSV files for external quantitative analysis. Five things tick data shows that bars permanently hide: Spread microstructure: Bars give you one spread number per period (typically the spread at bar close). Ticks show you the sprea
Fibonacci Pilot Pro Overview The EA functions as a comprehensive, panel-driven Fibonacci trading ecosystem designed to bridge the gap between manual chart analysis and fully automated algorithmic execution. Dual Execution Modes: It operates as both a visual trade assistant for manual trading and a fully autonomous robot. In manual mode, you plot Point A and Point B on the chart to instantly visualize risk/reward zones and limit entries before executing. In auto mode, it scans for market struc
Filtrer:
Aucun avis
Répondre à l'avis