FVG Multi TimeFrame Levels
- インディケータ
- バージョン: 1.26
- アクティベーション: 10

FVG Multi TimeFrame Levels — Indicator Overview
What it is
A multi-timeframe Fair Value Gap detector and analysis tool for MetaTrader 5. It scans price action across up to four configurable timeframe "slots" simultaneously, identifies gaps that meet a configurable significance threshold, draws them as boxes on the current chart, and tracks how each gap behaves over its lifetime — whether it gets tested, how deeply, how often, and ultimately whether it gets filled or swept beyond.
It runs alongside live price action without interrupting it; nothing it draws is interactive or order-related. It is a read-only analytical tool — it tells you where the levels are and what state they're in. Trading decisions remain yours.
What a Fair Value Gap is, and why it matters
A Fair Value Gap (FVG) is a three-bar pattern where the body of an impulse move leaves a price range that no candle's wick fully overlaps. Strict definition: for three consecutive bars older → impulse → newer, the older bar's high sits below the newer bar's low (bullish FVG), or the older bar's low sits above the newer bar's high (bearish FVG). The "gap" is the unfilled price band between them.
These gaps matter because price often returns to them. The impulse move that created the gap was fast enough that no consensus price was established within that range; many participants didn't get to transact at those levels. When price drifts back, that range becomes a liquidity zone — an area where pending orders, stops, and re-entry interest concentrate. Traders who use the concept treat these zones as candidates for support/resistance, entry triggers, or stop-placement anchors.
Not every three-bar gap matters equally. A gap of half a pip on a quiet session is noise; a gap during an impulsive trend day is a level the market is likely to revisit. This indicator's purpose is to find the gaps that matter and track what happens to them.
The four-slot architecture
The indicator exposes four parallel detection slots. Each slot is independent and configurable: source timeframe, color, significance threshold, filter mode, depth-of-test sensitivity, label position. Slots are typically used in two complementary ways:
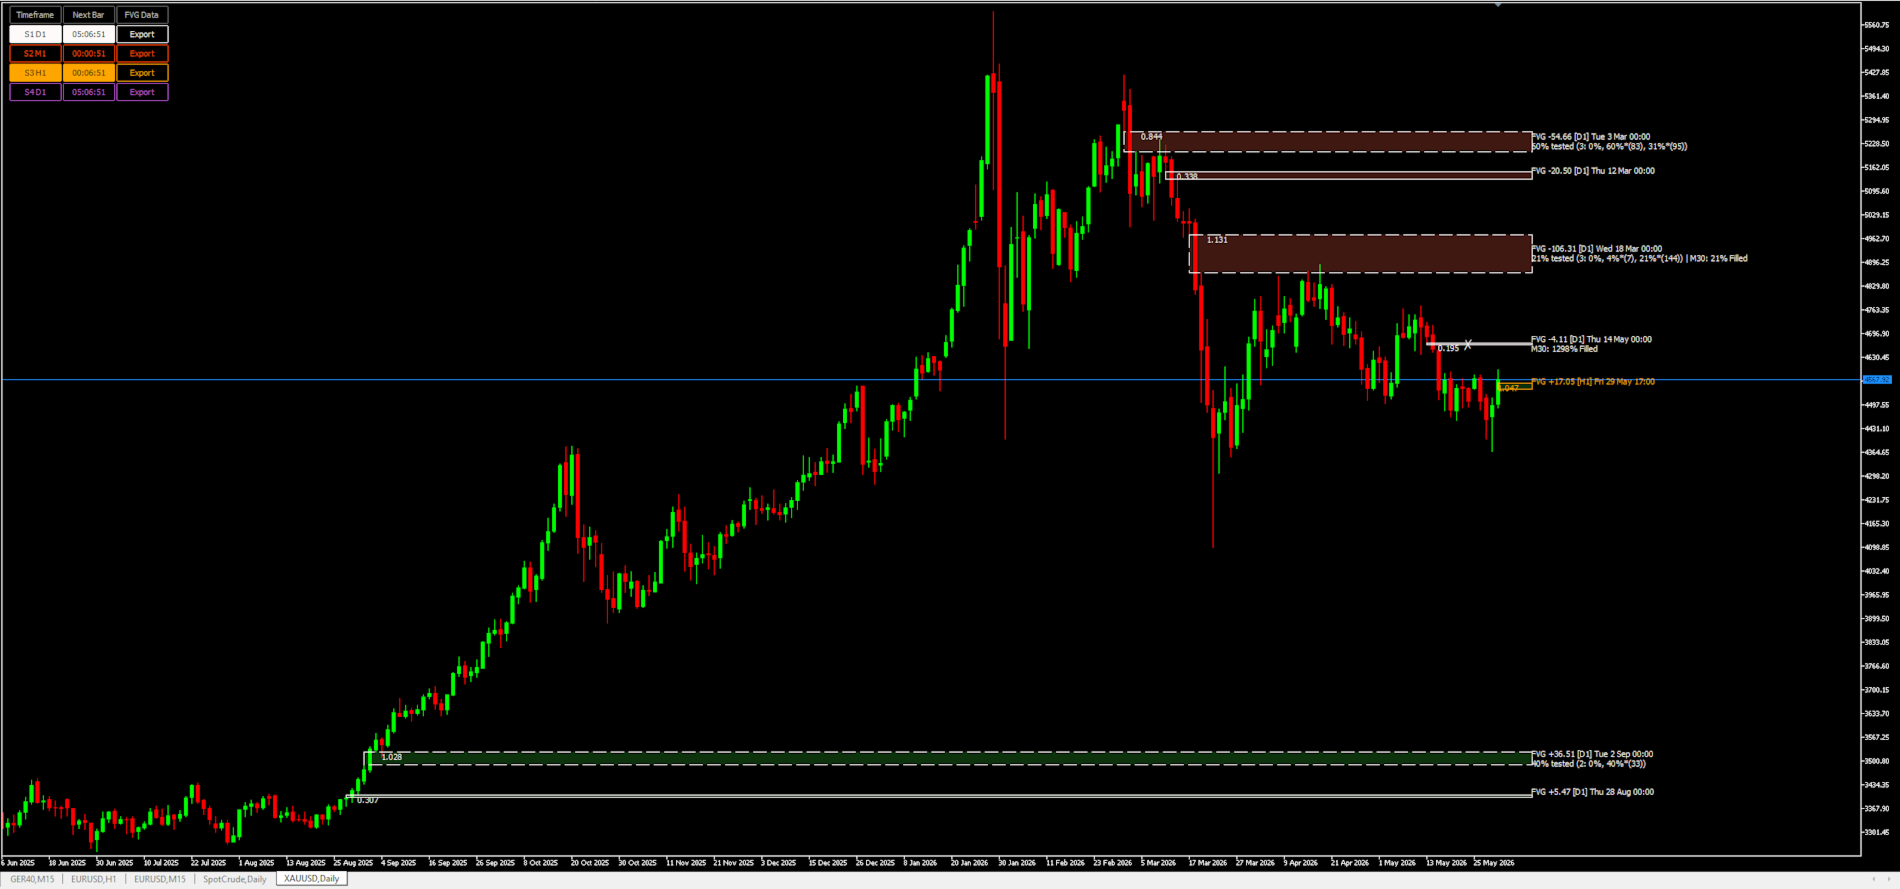
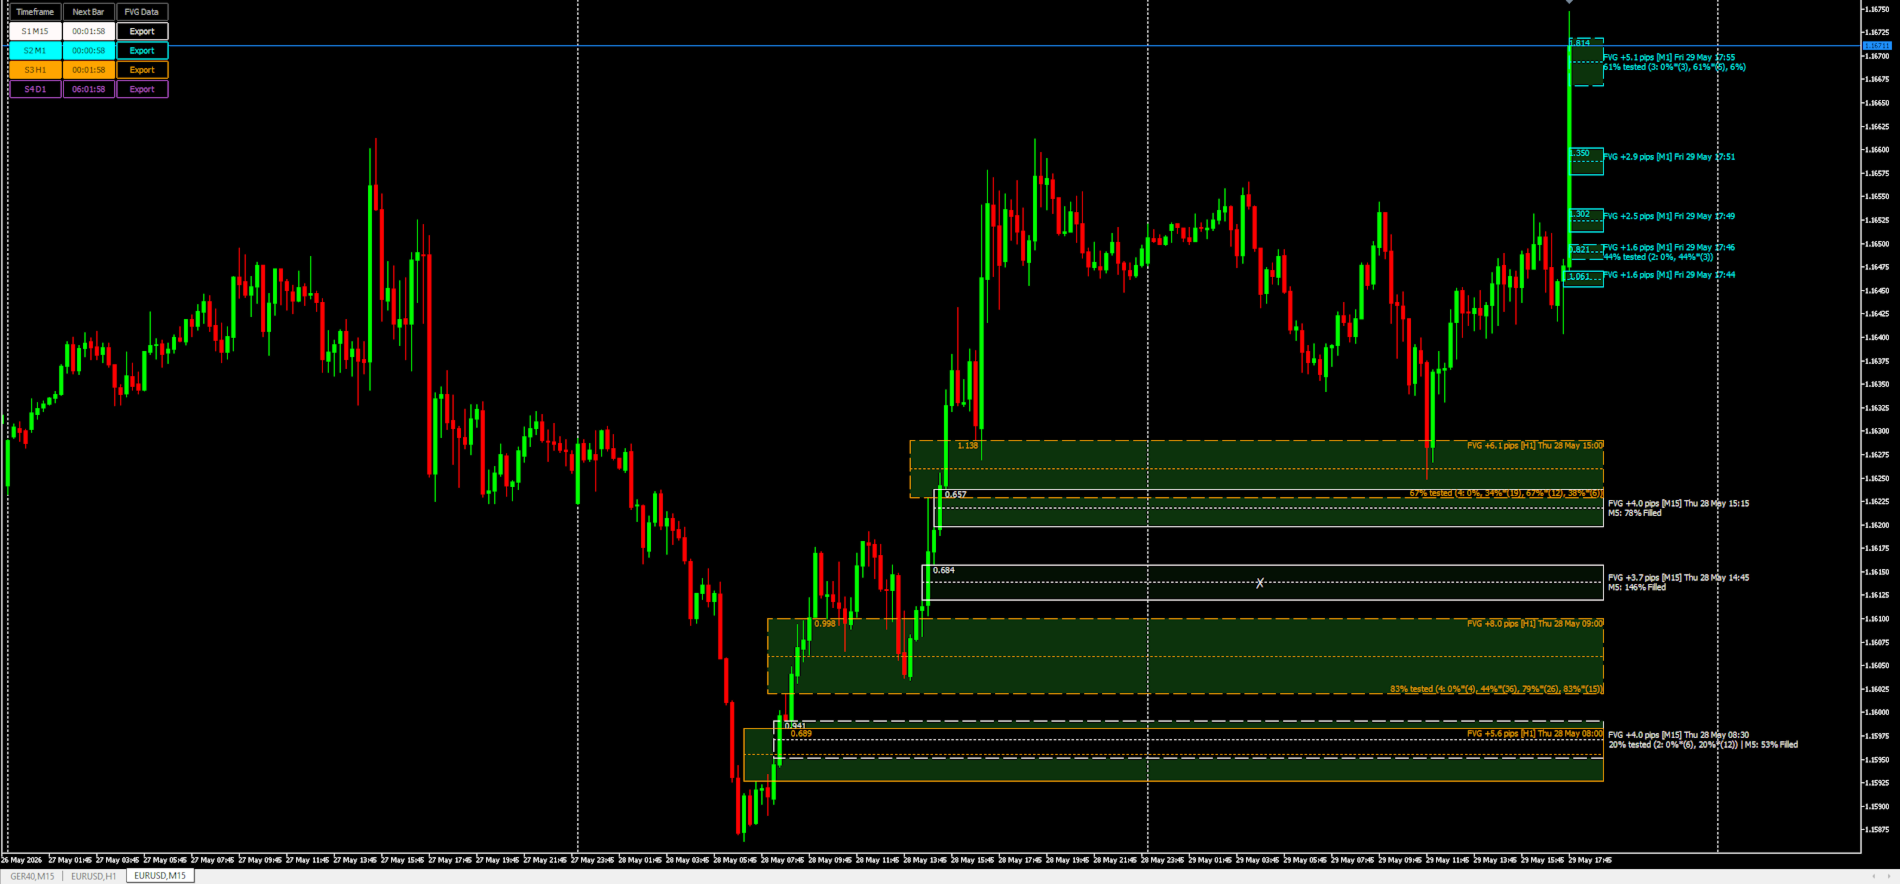
As different timeframes simultaneously. Slot 1 on the current chart's TF, slot 2 on H1, slot 3 on H4, slot 4 on D1. The chart then shows gaps from four time horizons at once, color-coded by slot. This is the canonical multi-timeframe view — you see the M15 gaps you might trade against, the H1 gaps that contextualize them, and the daily gaps that act as macro magnets.
As different significance horizons on the same timeframe. Four slots on H1, but each scoring gaps against a different volatility window (a "Sensitive" 8-bar ATR, a "Moderate" 21-bar, a "Conservative" 34-bar, and one manual). The same instrument is then judged against multiple time-scales of "what counts as a big move," and a gap that lights up in the Sensitive slot but stays dark in the Conservative one is telling you "significant relative to the last few hours, trivial against the broader regime."
These modes can mix. A slot is a configuration, not a fixed concept; the architecture is general.
How a gap is selected for display
A candidate gap goes through several gates before it appears on the chart:
1. Structural test. Three consecutive bars must form a strict, non-overlapping gap. If wicks overlap, no gap exists by definition, regardless of how the candles look to the eye. This is non-negotiable and tunes nothing.
2. Continuity check. The three bars must be temporally adjacent — no weekend gap, no session break. A "gap" between Friday's close and Monday's open isn't structural, it's calendar.
3. Significance score. Each candidate is given a score.
This normalizes the gap's size and the impulse candle's body against recent volatility. A score of 1.0 means the gap and body are roughly average for the prevailing volatility; 2.0+ means a clearly forceful move. The ATR window is configurable globally and per-slot.
4. Strictness gate. The score must clear a configurable threshold (0 = no filter, 100 = only the strongest gaps). The threshold maps linearly to a 0–2.5 score floor, so the slider directly controls what fraction of detected gaps survive.
5. Optional minimum-score post-filter. A second, absolute-score floor that layers on top of strictness. Where strictness is an abstract knob, this is in the same units as the visible per-box score — read the chart, decide where the noise sits, set the floor directly.
A gap that passes all five gates is added to the slot's display list, capped at a configurable maximum to prevent chart clutter.
What gets drawn for each gap
For each surviving gap, the indicator draws several elements:
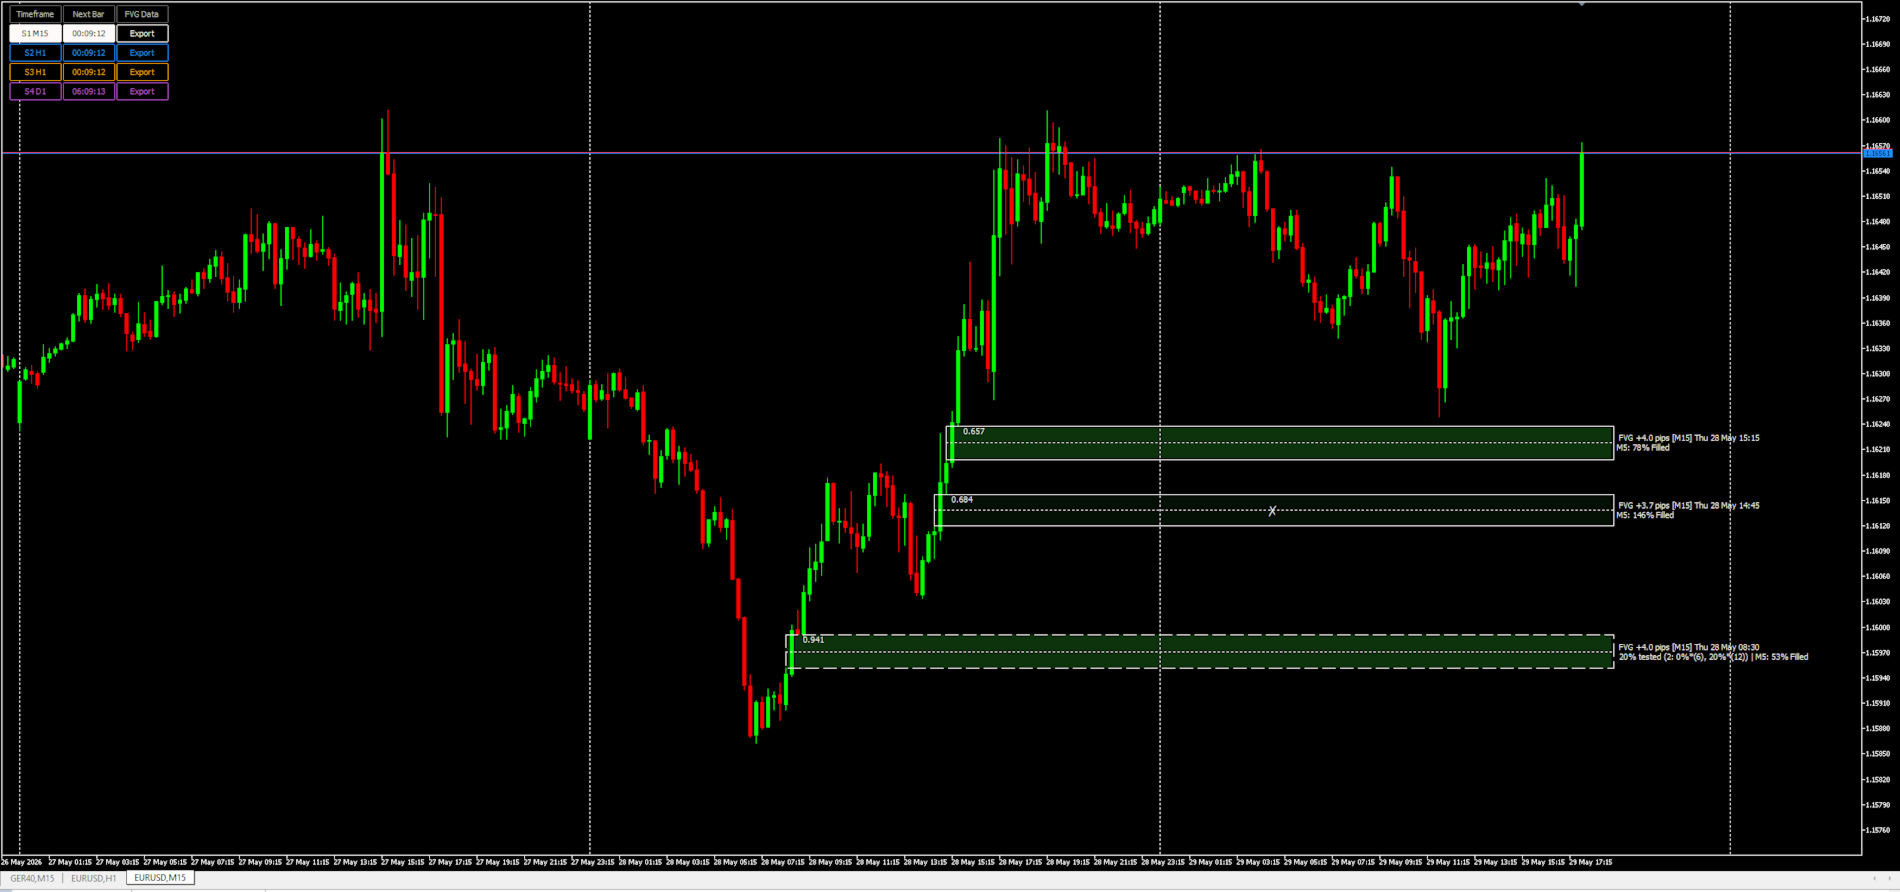
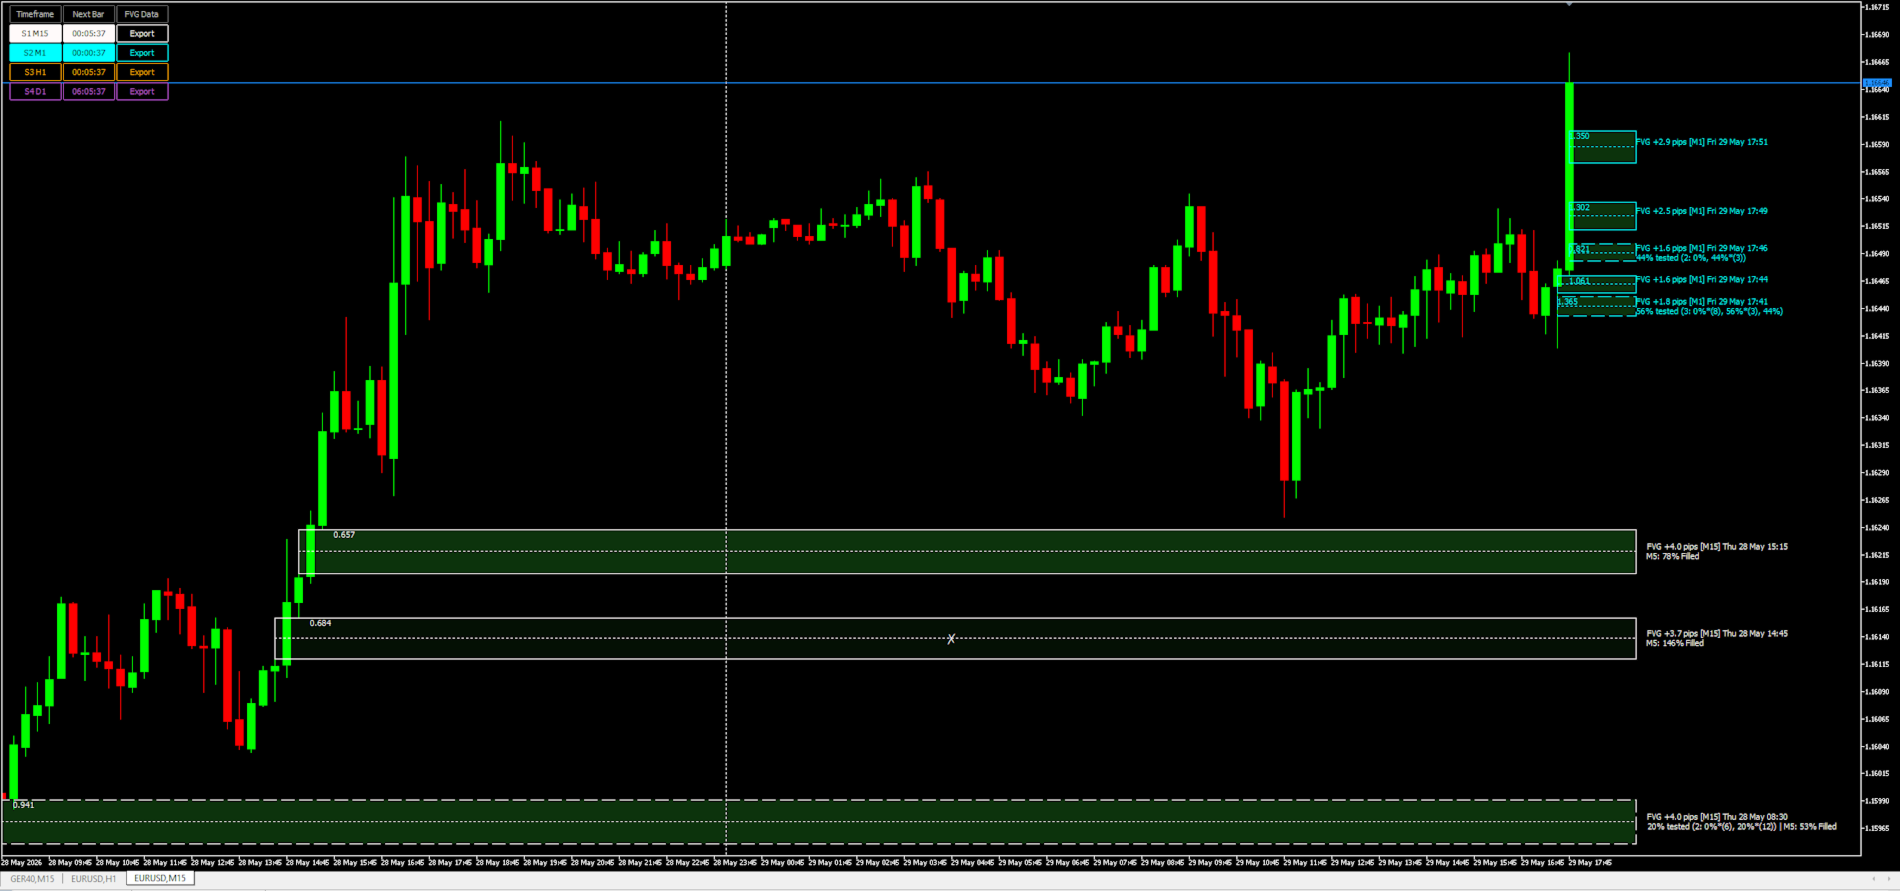
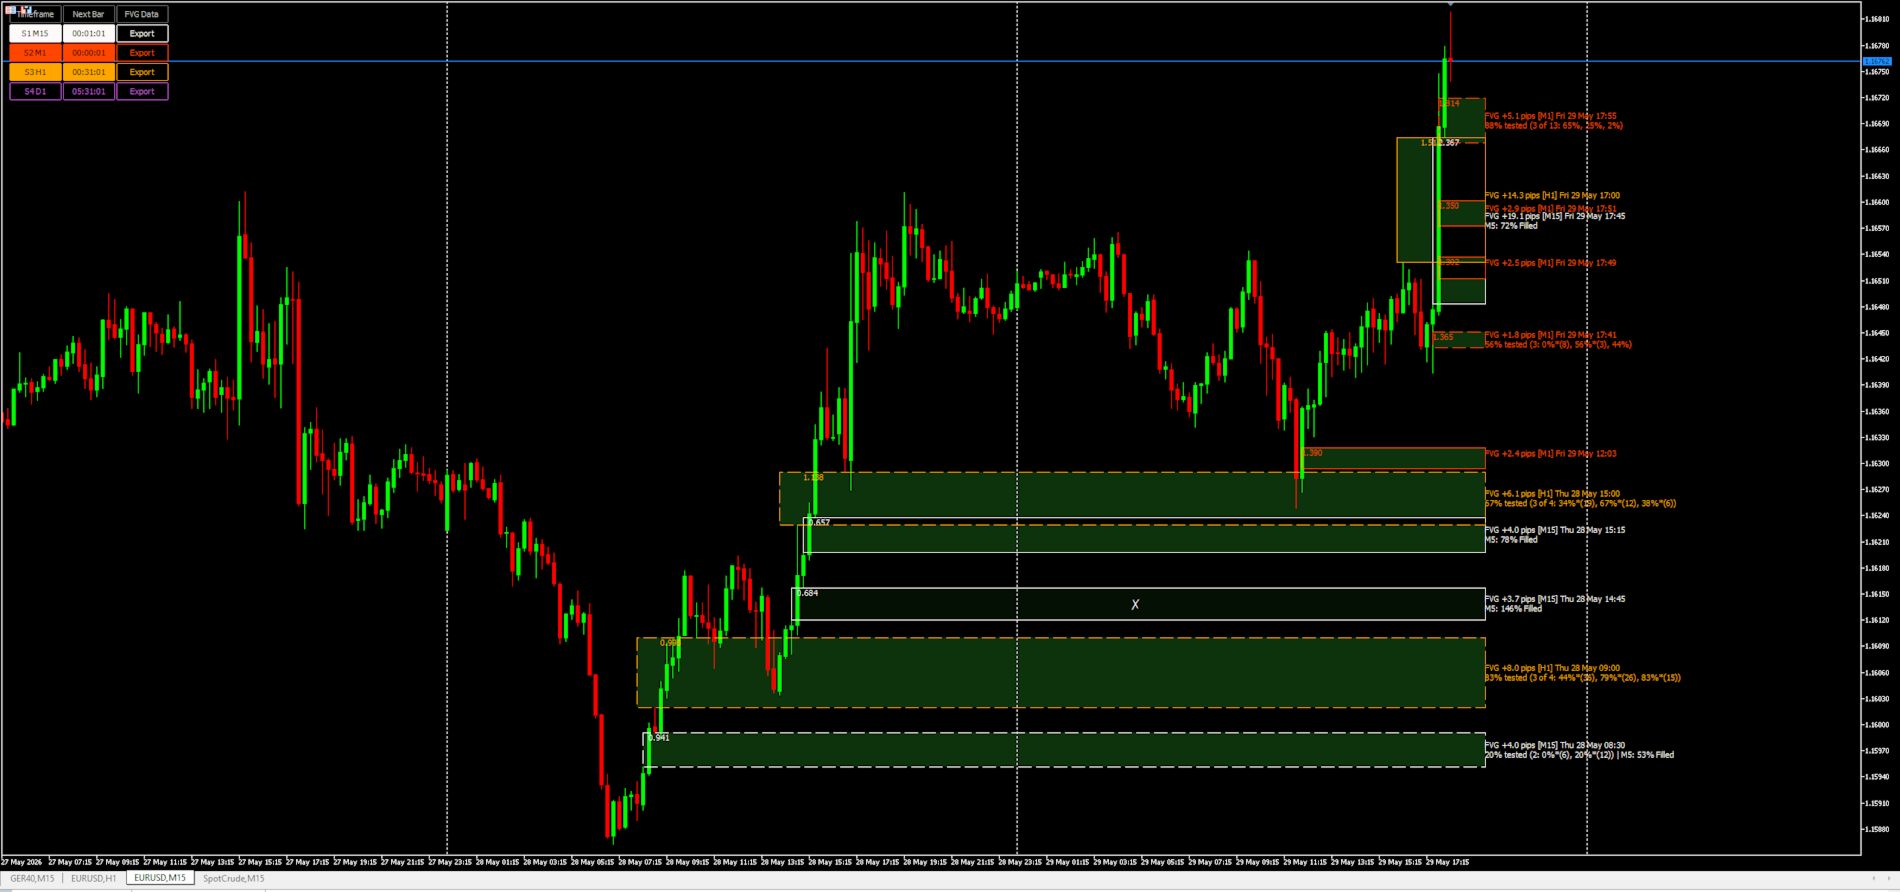
The box — a rectangle spanning the gap's price range (top to bottom) and time span (from the older bar's time, extending forward into current and future candles). The box border uses the slot's color; the border style indicates whether the gap has been tested (solid line) or remains untouched (dashed line, by convention).
An optional directional fill — a faint green or red tint inside the box marking bull/bear direction. Opacity is low so candles dominate the visual hierarchy.
An optional center line — a faint horizontal line at the gap's 50% midpoint, a common partial-fill target in some trading approaches.
An optional significance score — the gap's numeric score, drawn slot-colored inside the box at a configurable offset from the left edge. Reading this turns the abstract strictness control into a concrete per-gap readout.
The label — the gap's size in pips/price units, formation timestamp, the source timeframe tag, and (if any tests have happened) a test-history string showing how deeply each test penetrated and whether bars touched the gap multiple times within their span. Label position is configurable (next to, above, below, or stacked at multiple corners of the box).
A swept marker — when lower-timeframe analysis shows the gap has been filled past a configurable threshold, the box's fill fades sharply and a large centered symbol (default ✗) appears, telling the eye at a glance that this level is "spent."
How gap lifecycle is tracked
The indicator doesn't just detect gaps — it tracks them through their life:
Tested vs untested. Each new bar after a gap forms is checked for wick penetration. The first time a bar's wick crosses the touch-depth threshold (configurable from 1% — any penetration — to 110% — gap fully traversed and SL liquidity beyond it swept), the gap flips from untested to tested. The box style changes correspondingly. The test history label accumulates each touch event, showing depth and multiplicity.
Multi-touch detection. When a bar's range straddles the gap, the indicator does a tick-level scan (within the limits of MT5's tick history) to count how many distinct touches happened in that bar. A single bar can leave a * mark (touched once) or *(N) (touched N times) in the history. This catches bars that hammered a level repeatedly without it being obvious from the candle shape.
Lower-timeframe fill check. Optionally, each gap is checked against a lower timeframe — for example, an H1 slot can have its gaps re-examined on M5 across their full lifetime. This catches fills that the slot's own timeframe missed: an H1 gap that looks untouched on H1 might have been fully traversed by an M5 spike and an immediate reversion that didn't show in the H1 high/low. The deepest LTF penetration is recorded as a percentage; gaps past 100% are considered swept.
Fill removal. When a gap is fully filled (price closes through it on the slot's own timeframe), it's removed from the display list — the slot keeps a fixed quota of unfilled gaps visible, so the chart stays clean as new gaps form and old ones get consumed.
The HUD
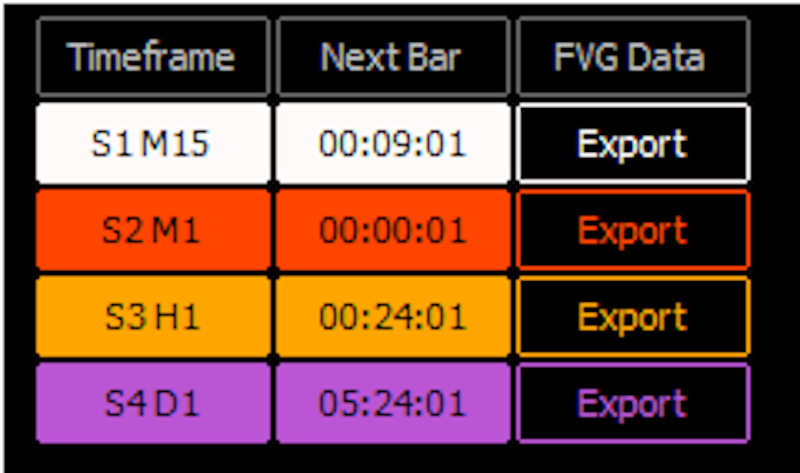
A small on-chart panel — anchored to a configurable corner — gives at-a-glance status and quick controls. Each slot has its own row showing:
Toggle button. Click to show/hide that slot's gaps without modifying input settings. The button shows the slot's source timeframe and reflects its current on/off state.
Countdown. Live countdown to the next bar close on the slot's timeframe. Useful when slots run different timeframes — tells you when each could next produce a new gap.
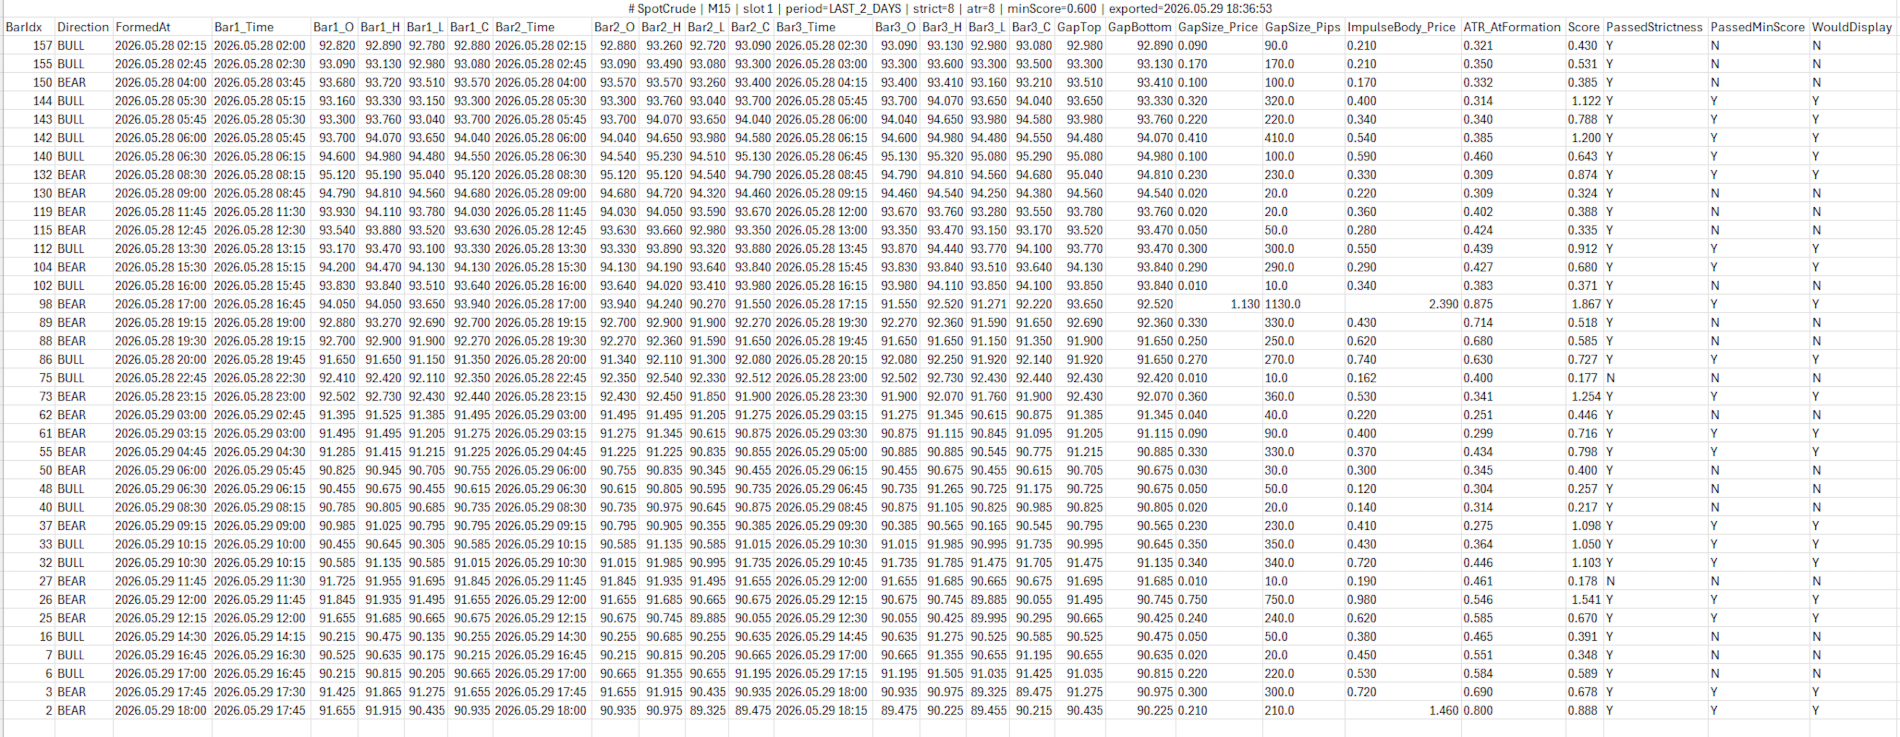
Export button. Triggers a one-shot deep re-scan over a configurable period (today / last 2 days / this week / last 2 weeks / this month / last N bars) and writes a CSV file containing every gap detected — including those filtered out by the current settings, with explicit flags for which gates each gap passed. Lets you analyze score distributions in Excel and choose filter thresholds from data rather than guesswork.
The HUD anchors cleanly to any of the four chart corners; column widths and offsets are configurable.
How the tool is intended to be used
The natural workflow has three phases:
1. Setup. Pick the timeframe arrangement that fits how you trade. Multi-TF if you analyze in layers; single-TF multi-horizon if you want one chart to show multiple interpretations of significance. Set colors, enable the in-box score display, pick a reasonable ATR mode.
2. Tuning. Run with the score visible. Watch how gaps score on the instruments and timeframes you actually trade. Set strictness loose at first to see the distribution; raise it (or set a minimum-score floor) once you can read the difference between meaningful gaps and noise. When you can't decide by eye, export to CSV and analyze the score distribution in Excel.
3. Daily use. With tuning settled, the indicator becomes background information. The boxes show you where levels are. The colors tell you which timeframe each level belongs to. Tested-vs-untested and swept markings tell you which levels are still potent and which are spent. The HUD lets you toggle slots in and out of view depending on what you're focused on.
The indicator does not generate signals, send notifications, or trade. It is a structural overlay; its value is making the FVG framework visible and tractable, so a trader who already uses the concept can use it more efficiently than they could by spotting gaps manually.
What the tool is not
- It is not a strategy. The FVG concept does not work mechanically — a tested gap can hold or fail, and which one happens depends on context the indicator does not model (trend, session, news, higher-timeframe structure beyond what your slots capture).
- It is not a real-time alerting system. There are no popups, sounds, or push notifications. The indicator's output is purely visual.
- It is not predictive. The significance score reflects gap geometry at formation; it does not forecast whether a level will hold or fail. A high-scoring gap is more likely to matter in the statistical sense that it was a real volatility event — but high-scoring gaps fail regularly, and low-scoring gaps sometimes hold cleanly.
- It is not a substitute for a trading framework. It assumes you already know how you want to use FVGs. Within that assumption, it removes the manual work of finding and tracking them.
Summary
The indicator detects FVGs across multiple configurable horizons, scores them against local volatility, tracks their tested/filled/swept state over their lifetime, and presents the result as a color-coded multi-layer overlay on the current chart. Significance is configurable along two orthogonal axes (volatility window and score threshold), and a per-gap score readout makes the filtering tunable from real numbers rather than abstract knobs. Lifecycle tracking — including lower-timeframe fill detection — distinguishes live levels from spent ones, and a CSV export supports data-driven tuning. The HUD provides quick visibility control and on-demand export without touching the settings dialog.
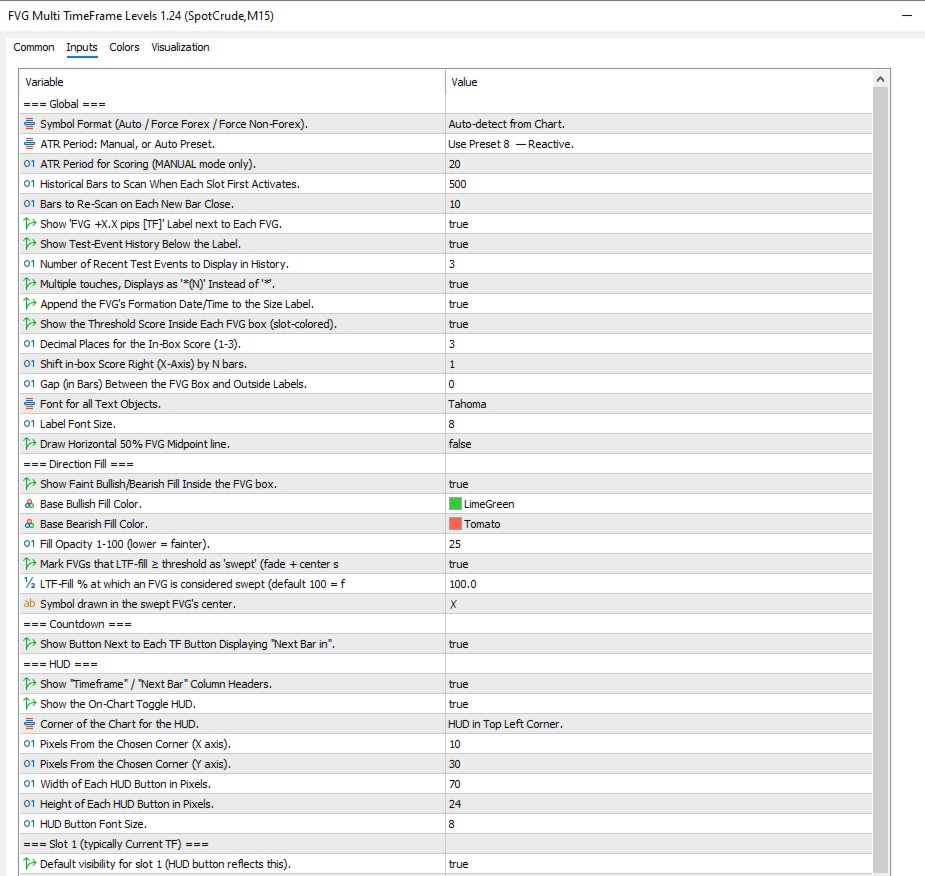
=== Global ===
Settings:
- Symbol Format (Auto / Force Forex / Force Non-Forex). Controls whether sizes are shown as pips (forex) or raw price units (indices/metals). Auto picks based on the broker's calc mode. Leave on Auto unless an exotic instrument is mislabelled.
- ATR Period: Manual, or Auto Preset. Global ATR mode used to score significance. Manual / Sensitive 8 / Moderate 21 / Conservative 34. Moderate is the safe default; with per-slot ATR you can leave this on Manual and let each slot pick its own horizon.
- ATR Period for Scoring (MANUAL mode only). Manual ATR period; ignored unless the mode above is Manual. 10–25 is the useful range. 55+ is too long for intraday FVG.
- Historical Bars to Scan When Each Slot First Activates. One-time deep scan size at attach / TF change. 500 is plenty for H1. Higher = slower attach and more old FVGs on the chart.
- Bars to Re-Scan on Each New Bar Close. Sliding window re-checked every bar close, catches late formations. 10 is fine. Push to 20–30 only if you genuinely see real FVGs being missed.
- Show 'FVG +X.X pips [TF]' Label next to Each FVG. The headline label next to the box (size + TF + formation time + test history). Where most of the textual info lives. Turning it off makes the chart cleaner but you lose those readouts.
- Show Test-Event History Below the Label. Appends XX% tested (N: 0%*, 44%*, ...) showing how deeply each test penetrated. The * markers indicate multi-touch bars.
- Number of Recent Test Events to Display in History. How many of the most recent tests are listed. 3–5 is the sweet spot. More may trigger the v1.19 auto-split.
- Multiple touches, Displays as '(N)' Instead of ''. If a bar touches the FVG more than once, show the count. Off keeps things clean; on if you want to spot multi-touch bars.
- Append the FVG's Formation Date/Time to the Size Label. Adds the formation timestamp to the size label. Useful for cross-referencing news.
- Show the Threshold Score Inside Each FVG box (slot-colored). Draws the per-FVG significance score inside the box. The single most useful tuning aid. Keep on while tuning, turn off later for a cleaner chart.
- Decimal Places for the In-Box Score (1-3). Precision of the in-box score. 2 is right for most charts. Drop to 1 if it crowds small boxes.
- Shift in-box Score Right (X-Axis) by N bars. Slides the score off the pattern candles into the box's empty area. 3–4 is right for H1+. Bump to 5–6 on lower TFs with thicker candles.
- Gap (in Bars) Between the FVG Box and Outside Labels. Small breathing space between the box border and outside-mode labels. 1 is right for most modes. Set to 0 to return to flush-against-the-box. Doesn't affect inside-the-box label modes.
- Font for all Text Objects. Font used by labels and the in-box score. Consolas / Courier New (monospace) makes columns line up.
- Label Font Size. Point size for all FVG text. 8 fits most charts. Bump to 9–10 on 4K.
- Draw Horizontal 50% FVG Midpoint line. Faint horizontal line at each FVG's midpoint (applies to all slots). Off by default. Turn on if you trade off the midpoint.
=== Direction Fill ===
Settings:
- Show Faint Bullish/Bearish Fill Inside the FVG box. Tints each FVG box green or red depending on direction. Makes direction readable at a glance without checking the candles.
- Base Bullish Fill Color. Color used for the bullish tint. LimeGreen is high-contrast on dark themes.
- Base Bearish Fill Color. Color used for the bearish tint. Same principle — Tomato is loud on dark themes.
- Fill Opacity 1-100 (lower = fainter). How strong the tint is. 25 is the sweet spot. Above 50, the fill starts fighting the candles.
- Mark FVGs that LTF-fill ≥ threshold as 'swept' (fade + center symbol). Toggles the v1.24 swept-FVG visual flag. Only does anything if the slot's Fill Check is on — the flag is driven by fillCheckMaxPct. Set Fill Check 1–2 steps below the slot's TF to populate it.
- LTF-Fill % at which an FVG is considered swept (default 100 = fully filled). The fill% threshold above which a box gets the swept treatment. 100 = fully filled is the safe default. Drop to 80–90 if you want partially-filled boxes flagged too.
- Symbol drawn in the swept FVG's center. Unicode character (or any text) placed at the box center when swept. ✗ is unambiguous. ⊘ or ◊ also read cleanly. Avoid long strings — it's font-sized larger than labels and a long string will overflow narrow boxes.
=== Countdown ===
Settings:
- Show Button Next to Each TF Button Displaying "Next Bar in". Live countdown to the next bar close for each slot's TF. Useful when slots run different TFs.
=== HUD ===
Settings:
- Show "Timeframe" / "Next Bar" Column Headers. Column headers above the per-slot button rows. Helpful early on; the third header "FVG Data" appears automatically above the Export column.
- Show the On-Chart Toggle HUD. The HUD panel itself (with per-slot show/hide and export buttons). Turning the HUD off hides the buttons; slots are still configurable via inputs, just not toggleable from the chart.
- Corner of the Chart for the HUD. Which corner the HUD anchors to. All four corners now align cleanly (v1.26 fix).
- Pixels From the Chosen Corner (X axis). Horizontal offset from the chosen corner. In right-anchor modes, this is the gap between the HUD's right edge and the chart's right edge (v1.26 — was buggy in v1.22–1.25).
- Pixels From the Chosen Corner (Y axis). Vertical offset from the chosen corner. Nudge to avoid overlap with chart edges.
- Width of Each HUD Button in Pixels. Per-button width. 70 fits four short TF labels comfortably.
- Height of Each HUD Button in Pixels. Per-button height. Make taller on 4K for tap-target sizing.
- HUD Button Font Size. Font size used inside the HUD buttons. 8–9pt fits a 24px button cleanly.
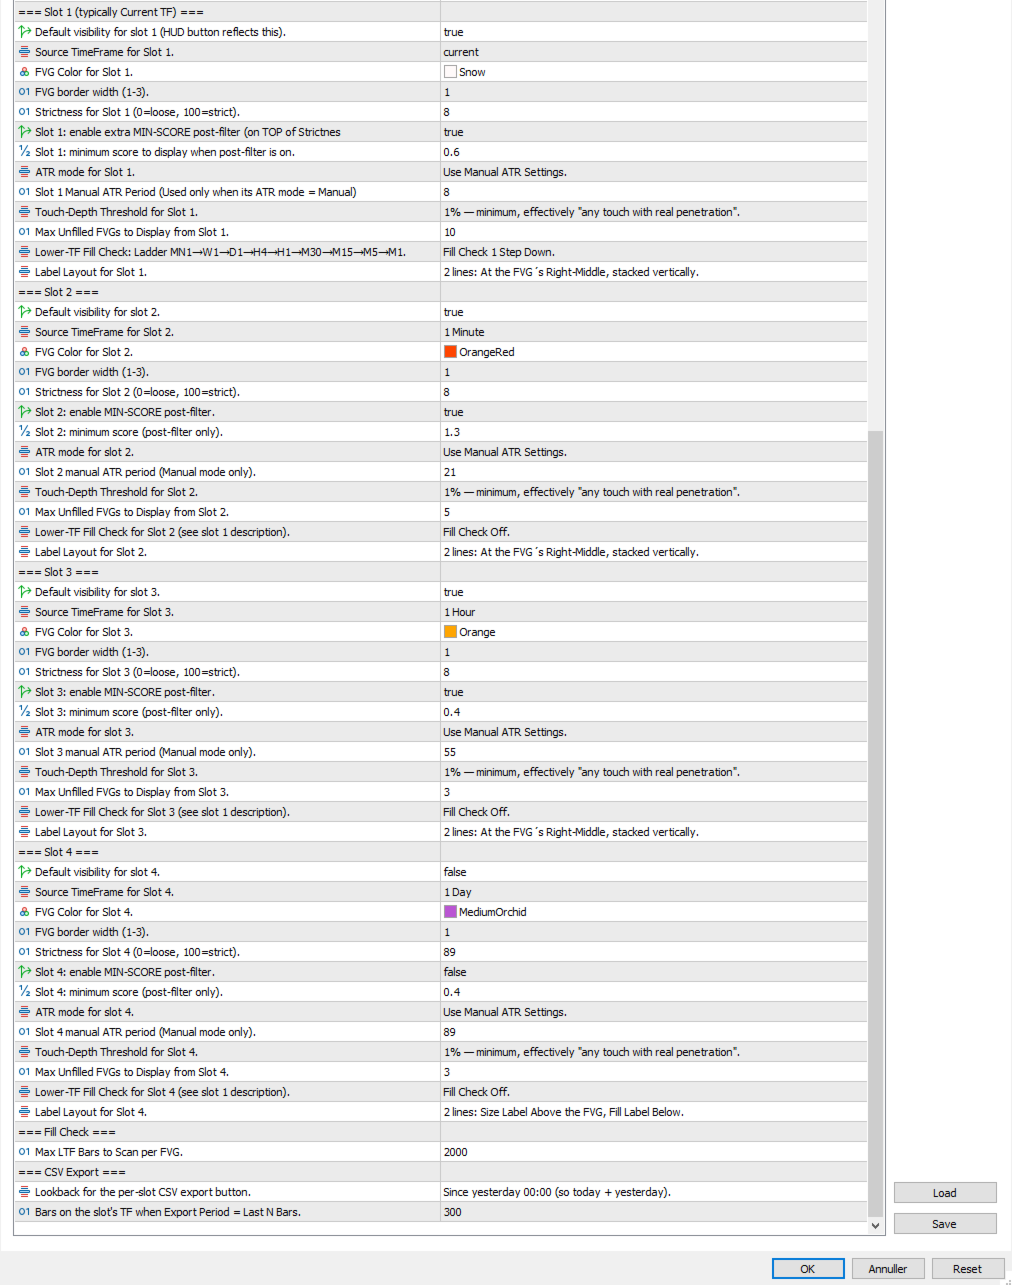
=== Slot 1 (typically Current TF) ===
Settings:
- Default visibility for slot 1 (HUD button reflects this). Whether slot 1 is enabled on attach. Off is fine for slots you only need occasionally.
- Source TimeFrame for Slot 1. Which TF this slot scans (use Current to follow the chart). Current follows the chart; pick an explicit TF for a fixed-horizon slot.
- FVG Color for Slot 1. Color for the border, in-box score, swept symbol, and labels. Give each slot a distinct color — that's how you read which slot any box belongs to.
- FVG border width (1-3). Box border thickness. Use width to encode importance (1 for noise, 2 for the slot you care about most).
- Strictness for Slot 1 (0=loose, 100=strict). Minimum significance score a gap must reach to display. 0 = no filter, 50 = middle, 100 = extremely strict. A four-slot ladder of 0/30/55/80 on the same TF gives progressive filters.
- Slot 1: enable extra MIN-SCORE post-filter (on TOP of Strictness). Toggles a second-stage absolute-score floor layered on top of strictness. Easier to tune than strictness because it's in the same units as the displayed in-box score. "I want nothing under 0.5" → set this on, type 0.5.
- Slot 1: minimum score to display when post-filter is on. The absolute score floor for this slot. Read the in-box scores, decide where the noise sits, set this slightly above. Has no effect if the toggle above is off.
- ATR mode for slot 1. Per-slot ATR mode (Inherit Global / Manual / Sensitive 8 / Moderate 21 / Conservative 34). Combined with per-slot strictness, lets the same TF be scored against multiple volatility horizons.
- Slot 1 manual ATR period (Used only when its ATR mode = Manual). Slot-specific manual ATR period; ignored unless this slot's ATR mode = Manual. Useful if none of the three presets quite match.
- Touch-Depth Threshold for Slot 1. How deeply price must penetrate to count as a touch: 1% / 10% / 30% / 50% / 90% / 110%. 110%. 30% is a balanced default. 110% flags potential reversals after stop hunts.
- Max Unfilled FVGs to Display from Slot 1. Cap on how many unfilled FVGs from this slot draw at once. 3–5 keeps things readable.
- Lower-TF Fill Check: Ladder MN1→W1→D1→H4→H1→M30→M15→M5→M1. Walks a lower TF across the FVG's lifetime to catch fills the slot's own TF can't see. Off is fastest. Required for the swept flag (v1.24) to do anything — drives fillCheckMaxPct. Set 1–2 steps below the slot's TF.
- Label Layout for Slot 1. Where the size/history label sits: Line1_* (single-line, four positions) or (dual-line, 3 positions). The single-line modes auto-split when text gets too long.
=== Slot 2 / Slot 3 / Slot 4 ===
Same input set as Slot 1 — every row above repeats per slot (including the new min-score pair), with these defaults differing:
e.g.
Slot 1 Current Timeframe
Slot 2 H1
Slot 3 H4
Slot 4 D1
=== Fill Check ===
Settings:
- Max LTF Bars to Scan per FVG. Global cap on the lower-TF scan length used when any slot's Fill Check is enabled. 2000 covers most cases. Lower to 500–1000 if you see lag on deep ladders.
=== CSV Export ===
Settings:
- Lookback for the per-slot CSV export button. How far back to re-scan when an Export button is pressed. Today / Last 2 Days / This Week / Last 2 Weeks / This Month / Last N Bars.
- Bars on the slot's TF when Export Period = Last N Bars. Lets you export an exact-length window when the calendar presets don't fit.