QuadZig ZZ Semafor 4L Dashboard MT5

QuadZig ZZ Semafor 4L Dashboard MTF MT4

Four-level market structure, ZigZag pivots, and multi-timeframe direction in one clean trading dashboard.

QuadZig is a professional market-structure indicator for MetaTrader 4. It combines a 4-level ZigZag Semafor system with a compact multi-timeframe dashboard, helping traders see where price has turned, which structure level is active, and whether higher timeframes are supporting the current move.

Instead of relying on one basic ZigZag line, QuadZig separates market structure into four levels:

L1 = minor reaction points L2 = short-term structure L3 = strong structure L4 = major structure

This gives traders a clearer view of both small intraday swings and larger market turning points.

QuadZig is designed for traders who want to read price structure faster, reduce chart noise, and understand the bigger picture without opening multiple charts.

What the Indicator Shows

QuadZig displays structure directly on the chart using pivot dots and optional ZigZag lines.

Each level represents a different scale of price movement:

L1 — Fast minor pivots L2 — Medium structure L3 — Strong structure L4 — Major turning zones

This allows you to see whether the current move is only a small reaction or part of a larger structural change.

Smaller levels can help with timing.
Higher levels can help with market bias, reversal zones, and important support or resistance areas.

Multi-Timeframe Dashboard

The built-in dashboard gives you a quick reading across multiple timeframes.

It helps answer three important questions:

Which direction is each timeframe pointing? Which structure level is driving the move? Is the current candle bullish, bearish, or neutral?

This is useful when you want to check alignment between lower and higher timeframes without constantly switching charts.

For example:

M5, M15, H1 = bullish H4 and D1 = bearish

Plain English:

The lower timeframes may be rising, but the larger market structure is still against the move. This can warn you that the trade may only be a pullback inside a bigger downtrend.

Four Structure Levels

QuadZig is built around four separate structure layers.

L1 — Minor Reaction Points

L1 shows the fastest and most sensitive pivots.

These are useful for:

early reactions minor pullbacks short-term timing scalping context

L1 gives more signals, but it should be treated as the smallest structure level.

L2 — Short-Term Structure

L2 filters out some of the smaller noise and gives a cleaner view of short-term swings.

This level is useful for traders who want structure without too many minor reaction points.

L3 — Strong Structure

L3 highlights stronger turning points.

These pivots are more important than L1 and L2 because they represent larger moves and stronger reaction zones.

L3 is useful for:

intraday bias trend continuation zones reversal watch areas support and resistance confirmation

L4 — Major Structure

L4 shows the largest structure level.

These are the most important pivots on the chart and can help identify major market turns, higher-level support and resistance, and larger directional shifts.

L4 is slower, but it carries more structural weight.

Historic Pivot Dots

QuadZig can display historic pivot dots so traders can see where previous structure was confirmed.

This helps build a visual map of past turning points and important market zones.

Historic dots are useful for:

reviewing previous structure spotting repeated reaction areas identifying support and resistance zones understanding how the market developed

This gives the chart a clear structural memory, instead of only showing the latest pivot.

Formation Dots

Formation dots show developing pivot candidates before they become confirmed structure.

This is useful for traders who want to watch how the market is forming in real time.

Formation dots can help you see:

where a possible pivot is developing whether price is rejecting a level whether a structure point may soon confirm

Formation dots are not final confirmed pivots. They are live structure candidates and should be used as early visual context.

Historic dots and formation dots can be controlled separately.

ZigZag Lines and Dot Display

QuadZig can be used as a clean dots-only Semafor indicator or with ZigZag structure lines enabled.

You can choose how much structure you want to see:

dots only for a clean chart lines enabled for full structure mapping individual level control separate visual settings for each level

This makes the indicator flexible for both minimalist traders and traders who prefer a full structural map.

Major Structure Alerts

QuadZig includes alerts for important structure events.

Alerts are focused on the stronger structure levels, helping you avoid noise from every small market reaction.

Supported alert options include:

desktop popup sound alert push notification email alert

You can use alerts to monitor important L3 and L4 pivot confirmations without watching the chart all day.

How to Read QuadZig

Example chart reading:

L1 and L2 are printing lower pivots L3 has recently confirmed resistance Dashboard shows lower timeframes turning down H1 and H4 are also bearish

Plain English:

Short-term structure and higher-timeframe direction are starting to agree. This may indicate bearish pressure and a possible continuation setup.

Another example:

L1 turns bullish L2 starts rising But L4 remains bearish above price

Plain English:

The market may be bouncing, but it is still trading below major structure. The move may be only a correction unless stronger levels also turn.

Key Features

  • 4-level ZigZag Semafor structure

  • Multi-timeframe dashboard

  • Structure direction across multiple timeframes

  • L1, L2, L3, and L4 pivot levels

  • Historic confirmed pivot dots

  • Live formation dots

  • Optional ZigZag lines

  • Individual control for each structure level

  • Major structure alerts

  • Clean chart display

  • Adjustable dashboard layout

  • Useful for scalping, intraday trading, swing trading, and structure analysis

  • Designed to reduce chart switching and improve market context

Benefits for Traders

QuadZig helps traders:

see market structure more clearly separate minor noise from major turning points identify important support and resistance zones monitor multiple timeframes from one chart understand whether lower timeframes agree with higher timeframes spot possible reversals and continuation areas avoid relying on one timeframe only

It gives structure traders a cleaner way to read the market without loading several different indicators.

Who This Indicator Is For

QuadZig is useful for traders who rely on:

market structure ZigZag pivots multi-timeframe analysis support and resistance trend continuation reversal zones scalping entries swing-trading context

It is especially useful if you often ask:

Is this just a small pullback? Is this a real structure shift? Are higher timeframes supporting this move? Where are the important recent turning points?

Recommended Use

QuadZig works best as a structure and confirmation tool.

A simple method:

1. Check the dashboard for higher-timeframe direction 2. Watch L3 and L4 for major structure 3. Use L1 and L2 for timing and smaller reactions 4. Look for agreement between chart structure and dashboard direction

The indicator does not need to be used alone. It works well with price action, trend filters, support and resistance, volatility tools, and your own trading strategy.

Important Note About ZigZag Indicators

ZigZag-style indicators are based on market structure and pivot confirmation.

Developing pivots can change while price is still moving. Confirmed pivots become more reliable after the market has moved far enough away from the turning point.

QuadZig helps by showing structure visually and separating live formation context from confirmed historic structure, so traders can understand what is still forming and what has already been confirmed.

Price

Introductory Price: $59

Available for MT4 and MT5.
Early buyers receive future updates free.

Demo version runs in Strategy Tester only.
Live chart access requires rental or full purchase.

Your Feedback Matters

If QuadZig helps improve your market-structure reading, please leave a 5-star rating and review.

⭐⭐⭐⭐⭐

Disclaimer

Trading involves risk. QuadZig provides market-structure analysis and decision-support tools. It does not guarantee profits and is not financial advice. Always use proper risk management and follow your own trading plan.

Рекомендуем также
A useful scanner/dashboard that shows the RSI values for multiple symbols and Time-frames. It can be easily hidden/displayed with a simple click on the scanner man top left of the dashboard. You can input upper and lower RSI values and the colours can be set to show when above/below these values. The default values are 70 and 30. There are also input colours for when the RSI is above or below 50 (but not exceeding the upper/lower levels Symbols and time-frames are input separated by commas. S
Orderflow Super Candles - Simple Footprint Chart Indicator Platform: MetaTrader 5 (MT5)  (The last screenshot shows the use of the DOM tool in conjunction with the product.) 1. Product Introduction Orderflow Super Candles is a professional charting tool based on underlying Tick data analysis, designed to provide traders with a deep "X-ray" view of the market. By parsing the buy and sell volume distribution within each candlestick, this indicator visualizes the hidden market microstructure. It
EMA256 Fourier Cycle Trader EMA256 Fourier Cycle Trader is an advanced MetaTrader 5 Expert Advisor combining a long-term EMA or TEMA trend model, causal Fourier cycle analysis, configurable averaging and a unified basket take-profit system. The Expert Advisor is designed primarily for CENT accounts and for traders who understand basket recovery strategies, geometric lot progression and the risks associated with trading without a mandatory Stop Loss. RECOMMENDED STARTING CONFIGURATION Recommended
Уникальный индикатор, реализующий профессиональный и количественный подход к торговле на возврате к среднему. Он использует тот факт, что цена отклоняется и возвращается к среднему предсказуемым и измеримым образом, что позволяет использовать четкие правила входа и выхода, которые значительно превосходят неколичественные торговые стратегии. [ Installation Guide | Update Guide | Troubleshooting | FAQ | All Products ] Четкие торговые сигналы Удивительно легко торговать Настраиваемые цвета и разме
Caicai L&S Yield Histogram Important Notice: This indicator is an integral tool of the automated EA Caicai Long and Short Pair Trading . This indicator visually displays the percentage deviation (Yield %) of a pair's current spread relative to its own historical mean. It is an excellent tool for quickly visualizing the gross financial potential of a market distortion in Long & Short operations. Main Features: Percentage Visualization: Understand the size of the distortion in palpable percentage
Crypto_Forex Индикатор "Гистограмма входа в тренд" для MT5, без перерисовки. - Индикатор гистограммы входа в тренд можно использовать для поиска сигналов входа в направлении тренда после появления Entry_bar. - Этот индикатор обладает уникальной особенностью: он учитывает как цену, так и объём для расчётов. - Гистограмма входа в тренд может быть двух цветов: красного для медвежьего тренда и синего для бычьего. - Как только вы увидите устойчивый тренд (минимум 10 последовательных столбцов гистог
How it works –   Base-departure detection — algorithmically finds consolidation bases (overlapping range with compressed volatility) followed by displacement departures. Patterns: Drop-Base-Rally, Rally-Base-Drop, Rally-Base-Rally, Drop-Base-Drop — detected structurally, not by candle names. –   Strength score (0–100) — from departure velocity, time-at-base, freshness (each revisit decays the score), higher-timeframe confluence and origin volume. –   Lifecycle — Fresh, Tested (decaying), Broken
FREE
Magic EA MT5
Kyra Nickaline Watson-gordon
Magic EA is an Expert Advisor based on Scalping, Elliot Waves and with filters such as RSI, Stochastic and 3 other strategies managed and decided with the robot smartly. Large number of inputs and settings are tested and optimized and embedded in the program thus inputs are limited and very simple. Using EA doesn't need any professional information or Forex Trading Knowledge. EA can trade on all symbols and all time frames, using special and unique strategies developed by the author. The EA w
Session Map Pro automatically plots the critical price levels from previous trading days and overlays visual session markers, giving you an instant "roadmap" of potential support and resistance.   It transforms your chart into a strategic trading battlefield.   Detailed Line Reference Guide (For visual display m1-m5 works best but can be attached to any time frame) Default lookbackDays=5. "Set to 1 for today only and a less cluttered display"  1.Horizontal lines (n) Days)    Solid GREEN Line (
MarketMagnet
Kelly Adediran Raymond
Готовы ли вы выйти на новый уровень в своем торговом путешествии? Не ищите ничего, кроме MarketMagnet, этого новаторского индикатора, разработанного, чтобы стимулировать ваш торговый успех с волнением и точностью. Основанный на слиянии Momentum и CCI (индекс товарного канала), MarketMagnet предоставляет трейдерам окончательный инструмент для определения направления и цен входа для широкого спектра рекомендуемых валютных пар и инструментов. Если вы новичок, трейдер среднего уровня, у которого ес
VP RSI Reversal Signal Arrows — Product Description Short Description VP RSI Reversal Signal Arrows is a clean MetaTrader 5 indicator that displays buy and sell reversal arrows when RSI exits oversold or overbought zones, with an optional moving average trend filter. Main Description VP RSI Reversal Signal Arrows is a visual technical analysis indicator for MetaTrader 5. It is designed for manual traders who want a simple RSI-based reversal assistant directly on the price chart. The indicator
Этот индикатор представляет собой индикатор автоматического волнового анализа, который идеально подходит для практической торговли! Случай... Примечание.   Я не привык использовать западные названия для классификации волн. Из-за влияния соглашения об именах Тан Лунь (Тан Чжун Шуо Дзен) я назвал основную волну   ручкой   , а вторичную полосу волн —   сегментом   Ат. в то же время сегмент имеет направление тренда. Именование   в основном является трендовым сегментом   (этот метод именования буде
Russian Launch Pad GOLD Indicator v1.7 Launch Pad GOLD Indicator — это мульти-таймфрейм инструмент технического анализа для MetaTrader 5. Индикатор использует анализ рыночной структуры на основе EMA совместно с мониторингом импульса, инструментами выравнивания тренда и настраиваемыми функциями фильтрации. Система разработана для помощи в анализе графиков на нескольких таймфреймах. Функции Анализ тренда EMA Индикатор использует EMA-расчёты для отображения структуры тренда и направления движения
Smart Swing Signals (SSS) Smart Swing Signals (SSS): closed-candle BUY/SELL arrows, projected swing zones and a transparent evidence score for XAUUSD and other markets. Trade with evidence, not guesswork Most arrow indicators fire a signal on almost every candle and never tell you why. Smart Swing Signals (SSS) works differently. It gathers several independent kinds of market evidence, scores bullish and bearish conditions separately, and draws an arrow only when the setup passes your own rules.
In the context of trading, Malaysia SNR (Support and Resistance) refers to the technical analysis of support and resistance levels in financial markets, particularly for stocks, indices, or other assets traded. This is single timeframe version. Multiple timeframe version is avaiable here . There are three type of Malaysia SNR level Classic , GAP and Flipped 1. Classic Support is the price level at which an asset tends to stop falling and may start to rebound. It acts as a "floor" where demand is
Daily VWAP, continues for a period of hours (eg, 10 hours of history), with color to indicate change of direction and bands to map good entry and exit points. The indicator was created to map the center of the market, and find good buying moments, trend analysis or market correction points are easily detected, allowing you to understand moments of exhaustion and buying and selling points Copyright (c) <year> <copyright holders> Permission is hereby granted, free of charge, to any person obtaini
G2 Entry Signal
Ida Bagus Putu Mahardika
G2 ENTRY SIGNAL by Ida Bagus Putu Mahardika STRATEGY DESCRIPTION G2 Entry Signal is a professional multi-strategy entry dashboard that combines top-down analysis with 3 proven trading strategies in one powerful indicator. Designed for traders who demand clarity, accuracy, and actionable signals, this tool filters market noise and delivers high-probability entry opportunities directly on your chart. KEY ADVANTAGES 1. 3 STRATEGIES IN ONE DASHBOARD Strategy 1 – London Session Breakout:   Capt
FREE
Range Volume Hybrid Generator
Trade The Volume Waves Single Member P.C.
1. Introduction Range Volume Hybrid (RVH) is a MetaTrader 5 Expert Advisor that creates custom chart symbols using a unique dual-condition bar formation method. Unlike traditional charts where bars close based on a single criterion (time, range, or volume), RVH bars close only when BOTH a minimum price range AND a minimum volume threshold are met simultaneously.  Download also and install RVH Monito r Indicator - to control the EA from the custom charts (it's Free)  https://www.mql5.com/en/marke
Информационная панель ADR Alert показывает вам, где в настоящее время торгуется цена по отношению к ее нормальному среднему дневному диапазону. Вы будете получать мгновенные оповещения через всплывающие окна, электронную почту или push-уведомления, когда цена превышает свой средний диапазон и уровни выше него по вашему выбору, чтобы вы могли быстро переходить к откатам и разворотам. Черта предназначена для размещения на пустом графике и просто находится в фоновом режиме и предупреждает вас о до
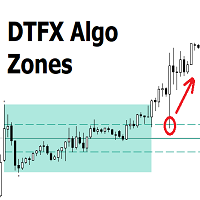
DTFX Algo Zones are auto-generated Fibonacci Retracements based on market structure shifts. These retracement levels are intended to be used as support and resistance levels to look for price to bounce off of to confirm direction.   USAGE Figure 1 Due to the retracement levels only being generated from identified market structure shifts, the retracements are confined to only draw from areas considered more important due to the technical Break of Structure (BOS) or Change of Character (CHo
RBreaker Gold Indicators — это краткосрочная внутридневная торговая стратегия для фьючерсов на золото, которая сочетает в себе два подхода: трендовое следование и внутридневные развороты. Она позволяет не только получать прибыль при трендовом движении, но и своевременно фиксировать прибыль при развороте рынка, открывая позиции в новом направлении. Данная стратегия на протяжении 15 лет подряд входила в десятку самых прибыльных торговых стратегий по версии американского журнала Futures Truth. Она
RevTech
Bashier Awny Husein Ismail Alhafy
Revtech MT5 Indicator brings together institutional concepts, market-structure logic, and classic price action patterns in one advanced trading tool. From Fair Value Gaps and Order Blocks to Head & Shoulders and Triangle formations, Revtech helps traders identify quality setups with clear chart visuals and execution levels. With dashboard monitoring, alerts, and timeframe-based strategy alignment, Revtech is designed to turn raw price action into a structured trading opportunity. The indicator
Multi Indi Signal Mhw
Muhammad Amir Azri Bin Samani
Multi Indi Signal Mhw is a multi-timeframe analysis and signal indicator for MetaTrader 5. It combines Support Becomes Resistance Zones (SR Flip), Fibonacci, BBMA and a Confirmation Zone Meter into one tool. Instead of reading each tool separately on several charts, the indicator analyses them together across timeframes and gives a BUY or SELL signal only when they agree. SR Flip zones is used to identify entry zones with the potential to become strong entry points with less floating loss . Fibo
Holiday Sales Zones Indicator The Zones Indicator is your everyday Trading tool that  leverages advanced algorithms, including ICT institutional concepts like order blocks , engulfing candle patterns , and Level interactions , to identify critical levels of supply and demand (Resistance & Support). Visual signals are generated and clearly marked on the chart, providing a straightforward guide for traders to spot key opportunities. Key Features Advanced Algorithmic Analysis : Identifies supply
Murphy Order Block is a highly optimized and visually clean indicator for identifying key institutional zones based on pure market structure logic. It is designed for traders who follow Smart Money Concepts (SMC), ICT-style OB trading, and structure-based break & retest strategies. This indicator dynamically detects and draws: - **1 valid Bullish Order Block (Buy Zone)** - **1 valid Bearish Order Block (Sell Zone)** ### Key Features: **Market Structure-Based Logic**   - Uses swing high
Pivot Tide — волны, трендовые линии и направление тренда Pivot Tide — индикатор для MetaTrader 4, который автоматически разбивает график на волны, отмечает их вершины и впадины, строит по ним трендовые линии и по состоянию этих линий определяет направление тренда. Всё выводится прямо на график, плюс есть небольшая информационная панель. Индикатор работает на любом инструменте и любом таймфрейме. MT4-version:  https://www.mql5.com/en/market/product/199656 Что он делает Находит волны. Волна опред
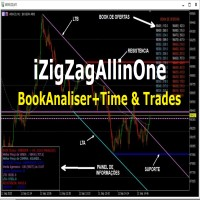
Indicator focusing on the market's ZigZag, also adding 2 other already established indicators: Book of Offers and Balance Aggressor (Time & Trades), this indicator allows to detect the best price trigger (buy or sell) in the aggressions to the Book of Offers including filters important as Aggression in Candle. Recommended use on the Brazilian iBovespa B3, but it also serves in Forex as long as the assets have information from the Book, in the case of Forex it is not possible to use the Aggress
Better RSI With Tester
Mohammad Taher Halimi Tabrizi
Category: Trend Indicator Platform: MetaTrader 5 Type: Entry Indicator Timeframes: All Trader Styles: Scalping, Day Trading, Swing Trading, Binary Options Markets: All Description This indicator is an enhanced version of the Relative Strength Index (RSI) with additional features for visual clarity and cycle detection. It is designed to provide traders with a clearer view of momentum conditions and potential turning points. Main features: Improved RSI Visualization – The indicator displays RSI va
Fabii Half Trend Baseline
Fabien Georges Andre Guillemaud
Перестаньте торговать против тренда старшего таймфрейма. Две базовые линии, один график. Без перерисовки. Любая пара, любой таймфрейм. На вашем графике за 2 минуты. Бесплатная демо-версия в Strategy Tester. Get more indicators here Baselines, volatility filters and oscillators. No repaint. Зачем это нужно Вы открываете сделку, потому что линия на графике стала зелёной. Затем вы открываете старший таймфрейм и видите, что общий тренд направлен в другую сторону. Сигнал был настоящим. Но тренд во
The indicator measures the balance of aggression. The formula is as follows:   Aggression  = Purchase Volume - Sales Volume. Note : It is rec ommended to use the default configuration and VPS values. It does not work in Forex. Meet Our Products     Parameters : Numbers of days prior to the current one for calculation; Volume Divider e; Enables calculation of the current candle; Histogram Line style and; Size; Line Line style and; Size;  Follow us on our website to check the next news.
С этим продуктом покупают
Trend Sniper X
Sarvarbek Abduvoxobov
4.86 (42)
Trend Sniper X — это трендовый индикатор для MetaTrader 5, работающий на нескольких таймфреймах, который помогает трейдерам точно и ясно определять направление тренда и потенциальные точки разворота. для MT4: https://www.mql5.com/en/market/product/193245 Информация о цене: Текущая цена является промо-ценой и может измениться по мере выхода предстоящих обновлений и новых функций. Бонусное предложение: Чтобы получить БЕСПЛАТНЫЙ авто-трейд советник Assistant EA для этого индикатора, пожалуйста, на
Smart Trend Trading System — MetaTrader 5 После покупки напишите мне на MQL5, чтобы БЕСПЛАТНО получить Smart Universal Expert Advisor, а также доступ к онлайн-курсу, руководство в формате PDF и доступ к закрытой группе. STTS объединяет направление тренда, сигналы входа и выхода, зоны разворота и важные ценовые уровни прямо на графике. Торгуйте по системе вручную или подключите отдельный совместимый советник для автоматического исполнения с выбранными вами настройками. ОДНА СИСТЕМА. ЧЕТЫРЕ ТОРГОВ
Новый король в городе — Индикатор + управление ордерами (TP1 + TP2 + TP3) + опциональный Telegram-сигнал-сендер ВКЛЮЧЁН (БЕСПЛАТНО) (ПОЛНОЦЕННАЯ ТОРГОВАЯ И СИГНАЛЬНАЯ СИСТЕМА) Gold Slayer EA Этот индикатор включает в себя продвинутую стратегию, торговую систему с настраиваемым управлением ордерами и систему mean reversion, которая сочетает расширения Envelope и поддерживается несколькими интеллектуальными фильтрами подтверждения, такими как RSI, для поиска высоковероятных точек разворота с сигн
Boba Analysis Suite
Trade Ready Solutions LLC
5 (1)
Boba Analysis Suite Boba Analysis Suite — аналитический индикатор для MetaTrader 5. Он объединяет структуру рынка, значимые ценовые зоны и общий рыночный контекст в одном представлении на графике. Индикатор разработан на основе практического опыта трейдера и наставника по трейдингу. Он помогает выстроить последовательный процесс анализа: оценивать направление рынка, определять важные уровни и рассматривать несколько таймфреймов в совокупности. Анализ с учётом контекста Значение отдельных сигнало
Entry Points Pro — топ-1 индикатор по количеству отзывов (600 отзывов и 31 000 скачиваний обеих версий). Индикатор даёт самые перспективные точки входа в сделки без перерисовки на любых инструментах. Индикатор покажет заранее стрелкой точку входа в сделку, укажет цену входа и нарисует на графике уровень входа и стопа, а так же рассчитает рабочий лот под твой депозит и риск, а панель статистики поможет выбрать самый перспективный инструмент и таймфрейм .  Тебе остаётся поставить отложенный ордер
Auto Optimized SpeedAngle — это система векторизации импульса институционального уровня, которая исключает подгонку под исторические данные (curve-fitting) за счет непрерывной форвард-оптимизации (Walk-Forward Optimization, WFO). Вместо того чтобы полагаться на статические входные параметры, которые теряют эффективность при смене рыночных режимов, индикатор динамически перекалибрует свои настройки, используя валидацию на вневыборочных данных (Out-of-Sample, OOS). Это гарантирует, что отображаемы
ARIPoint
Temirlan Kdyrkhan
1 (4)
ARIBot is a powerful trading companion designed to generate high-probability entry signals with dynamic TP/SL/DP levels based on volatility. Built-in performance tracking shows win/loss stats, PP1/PP2 hits, and success rates — all updated live. Key Features: Buy/Sell signals with adaptive volatility bands Real-time TP/SL/DP levels based on ATR Built-in MA Filter with optional ATR/StdDev volatility Performance stats panel (Success, Profit/Loss, PP1/PP2) Alerts via popup, sound, push, or email Cus
Adaptive Price Action Engine Купи индикатор — получи советник (EA) к нему бесплатно Самооптимизирующийся мульти-таймфреймовый анализ тренда и свечных моделей Рынок постоянно меняется — и не каждая модель Price Action имеет одинаковую ценность в разных рыночных режимах. Adaptive Price Action Engine создан для адаптации к изменяющимся рыночным условиям, объединяя трендовую структуру, мульти-таймфреймовый анализ, свечные модели и статистическую оптимизацию в единой аналитической системе. Два адапти
M1 SNIPER   — это простая в использовании торговая система. Это стрелочный индикатор, разработанный для тайм фрейма M1. Индикатор можно использовать как отдельную систему для скальпинга на тайм фрейме M1, а также как часть вашей существующей торговой системы. Хотя эта торговая система была разработана специально для торговли на M1, ее можно использовать и с другими тайм фреймами. Первоначально я разработал этот метод для торговли XAUUSD и BTCUSD. Но я считаю этот метод полезным и для торговли на
Gann Made Easy   - это профессиональная, но при этом очень простая в применении Форекс система, основанная на лучших принципах торговли по методам господина У.Д. Ганна. Индикатор дает точные BUY/SELL сигналы, включающие в себя уровни Stop Loss и Take Profit. ПОЖАЛУЙСТА, СВЯЖИТЕСЬ СО МНОЙ ПОСЛЕ ПОКУПКИ, ЧТОБЫ ПОЛУЧИТЬ ТОРГОВЫЕ ИНСТРУКЦИИ И ОТЛИЧНЫЕ ДОПОЛНИТЕЛЬНЫЕ ИНДИКАТОРЫ БЕСПЛАТНО! Вероятно вы уже не раз слышали о торговли по методам Ганна. Как правило теория Ганна отпугивает от себя не только
FiboSniper Pro – Multi-Filter Fibonacci System with Auto SL/TP and Control Panel FiboSniper Pro — это технический индикатор, который объединяет динамические Fibonacci Envelopes с несколькими фильтрами подтверждения для формирования отборных сигналов Buy и Sell. Уровни Fibonacci рассчитываются на основе Moving Average и ATR, а затем фильтруются с помощью ADX, EMA, RSI, ATR, Volume, Time и структуры свечи. Индикатор отображает на графике автоматические уровни Stop Loss и Take Profit на основе ATR,
Следующее обновление — версия 2.52 уже скоро! [НОВОЕ] Приготовьтесь к 4 новым важным функциям, призванным улучшить ваш анализ рынка и торговый процесс. Мы выводим анализ рынка на новый уровень с помощью 4 новых функций, разработанных с учётом ваших потребностей в трейдинге. Представляем: 1. TRADE OVERVIEW DASHBOARD 2. CONFLUENCE AT ZONE 3. STRONG & WEAK HIGH/LOW 4. OTE 1. TRADE OVERVIEW DASHBOARD Панель, которая помогает легче понимать общую картину рынка, предоставляя рекомендации для поддержк
Break and Retest Hunter is a powerful MetaTrader 5 indicator designed to automatically identify support and resistance levels, breakout structures, and potential retest opportunities in real time. Bonus Indicator: After purchasing Break and Retest Hunter , contact me to receive Trade Indicator Assistant EA completely free as a bonus utility. $65 for the next 10 copies . Next price is $120.  Combining adaptive market analysis, clear BUY/SELL signals, Fibonacci-based profit targets, and a premiu
Neuro Poseidon - новый индикатор от Дарьи Резуевой. Он сочетает точные торговые сигналы с адаптивными уровнями TP/SL , в результате создавая максимально выгодные сделки! TO SWITCH TO   ENG   PLEASE CHOOSE IT IN THE UPPER-RIGHT CORNER OF THE WEBSITE Напишите мне и получите  Neuro Poseidon Assistant  в подарок для автоматизации вашей торговли! Что отличает его от других индикаторов? 1. Доказанная прибыльность на всех активах и таймфреймах 2. На графике присутствуют только подтвержденные сигналы н
Trend Catcher   анализирует движения рыночных цен, используя комбинацию собственных и индивидуально разработанных адаптивных индикаторов анализа тренда. Он определяет истинное направление рынка, отфильтровывая краткосрочные шумы и фокусируясь на силе импульса, расширении волатильности и поведении ценовой структуры. Он также использует комбинацию сглаживающих и фильтрующих тренд индикаторов, таких как скользящие средние, RSI и фильтры волатильности. Мониторинг реальных операций, а также другие
FX Trend NG: Следующее поколение интеллектуального анализа трендов на разных рынках Обзор FX Trend NG — это профессиональный инструмент анализа трендов и мониторинга рынка с поддержкой нескольких таймфреймов. Он позволяет за секунды получить полное структурное понимание текущего состояния рынка. Вместо переключения между десятками графиков вы мгновенно видите, какие инструменты находятся в тренде, где импульс ослабевает и где наблюдается сильная синхронизация между таймфреймами. Специальное пр
Unix Scalper — MetaTrader 5 После покупки напишите мне на MQL5, чтобы БЕСПЛАТНО получить Smart Universal Expert Advisor, а также доступ к онлайн-курсу, руководство в формате PDF и доступ к закрытой группе. Найдите торговую ситуацию. Оцените план. Выберите способ торговли. UNIX Scalper объединяет анализ рынка, решения BUY/SELL/WAIT и уровни Entry, Stop Loss, TP1 и TP2 в одной удобной панели. УВИДЬТЕ СИГНАЛ И ТОРГОВЫЙ ПЛАН • Понятные решения: BUY, SELL или WAIT. • Определённые уровни: Entry, Stop
Представляем       Quantum Breakout PRO   , новаторский индикатор MQL5, который меняет ваш способ торговли в зонах прорыва! Разработан командой опытных трейдеров со стажем торговли более 13 лет,       Квантовый прорыв PRO       разработан, чтобы поднять ваше торговое путешествие к новым высотам с его инновационной и динамичной стратегией зоны прорыва. Quantum Breakout Indicator покажет вам сигнальные стрелки на зонах прорыва с 5 целевыми зонами прибыли и предложением стоп-лосса на основе поля
Мультивалютный индикатор силы и импульса MT5 Dynamic Forex28 Navigator — это развитие наших давних популярных индикаторов, объединяющее силу трёх в одном: Advanced Currency Strength28 Indicator (700 отзывов) Advanced Currency IMPULSE with ALERT (530 отзывов) CS28 Combo Signals (недавний бонус) Оба индикатора-предшественника вместе получили более 1,200 отзывов на MQL5 Market и с 2016 года являются неотъемлемой частью сообщества MT4. Dynamic Forex28 Navigator MT5 переносит ту же проверенную логику
Scalper Vault — это мощная, полноценная торговая система, созданная для трейдеров, которые стремятся к стабильным результатам в внутридневной торговле. Этот высокоточный индикатор представляет собой комплексное, самостоятельное торговое решение, обеспечивающее аналитику профессионального (институционального) уровня как для торговли на рынке Forex, так и для работы с бинарными опционами. Пожалуйста, свяжитесь со мной после покупки, чтобы получить мои торговые советы, а также отличный бонус! Исклю
Volatility Master for MetaTrader is a real-time dashboard tool that scans up to  50 symbols  to identify high-volatility , trending markets instantly. With bullish/bearish signals, customizable alerts, and a user-friendly interface, it helps you avoid range-bound conditions and focus on high-probability trades. Clarity leads to confidence. Trade confidently and protect your capital effectively with this powerful dashboard. We don't offer free or bonus indicators in exchange of reviews from you.
Power Candles V3 — самооптимизирующийся индикатор силы Power Candles V3 преобразует силу валюты и инструмента в готовый к использованию торговый план на каждом графике, к которому он прикреплен. Вместо того, чтобы просто раскрашивать свечи, он выполняет автоматическую оптимизацию в режиме реального времени в фоновом режиме и предоставляет вам оптимальные значения Stop Loss, Take Profit и порог сигнала для выбранного вами символа. Один клик — и все готово для реальной торговли: на графике появляю
Apex Patterns PRO Купите индикатор — получите Expert Advisor на его основе БЕСПЛАТНО. Самооптимизирующаяся система анализа графических паттернов и пробоев Традиционные сканеры паттернов полагаются на фиксированные входные параметры, что часто приводит к снижению их эффективности при изменении рыночной волатильности и структуры. Apex Patterns PRO разработан для адаптации к меняющимся рыночным условиям, объединяя распознавание структурных графических паттернов, фильтрацию по моментуму и статистич
SR Liquidity   — это торговый индикатор, предназначенный для выявления скрытых зон, где концентрируется рыночная ликвидность и наблюдается наиболее сильная реакция цены. Эти особые зоны ликвидности выступают в качестве мощных уровней поддержки и сопротивления, предоставляя вам четкую картину того, где с наибольшей вероятностью произойдет разворот рынка. Вместо построения стандартных линий поддержки и сопротивления, индикатор SR Liquidity анализирует реальное поведение цены, выявляя зоны концентр
Этот индикатор является уникальным, качественным и доступным инструментом для торговли, включающим в себя наши собственные разработки и новую формулу. В обновленной версии появилась возможность отображать зоны двух таймфреймов. Это означает, что вам будут доступны зоны не только на старшем ТФ, а сразу с двух таймфреймов - таймфрейма графика и старшего: отображение вложенных зон. Обновление обязательно понравится всем трейдерам, торгующим по зонам спроса и предложения. Важная информация Для макс
Precision Spike Detector
Francisco Mandomo Simbine
5 (2)
Precision Spike Detector V3 – Institutional-Grade AI Trading System Attention: The price increases by US$50 for every 10 purchases.  Final price: US$599 Precision Spike Detector V3   is a   state-of-the-art, institutional-grade market analysis system   for   MetaTrader 5 , designed to detect   high-probability market movements   in synthetic indices such as   Boom, Crash, GainX, and PainX . After purchase, send me a private message to receive the optimized configuration files,  the installation
Btmm state engine pro
Garry James Goodchild
5 (4)
BTMM State Engine Pro by G-Labs — Beat The Market Maker indicator for MetaTrader 5. Asian session range, London and New York kill zones, level progression (L1/L2/L3), peak formation detection (PFH/PFL), entry signals, and a multi-pair scanner from one chart. Stop scanning charts one pair at a time. The State Engine tracks the BTMM daily cycle automatically — Asian box, room boundaries, level blocks, peak formations, and filtered entries — while the scanner dashboard shows level, peak status, d
Matreshka
Dimitr Trifonov
5 (2)
Самотестируемый и самооптимизируемый и ндикатор Matreshka: 1. Я вляется интерпретацией Теории Волнового Анализа Элиотта. 2. За основу взят принцип индикатора типа ZigZag, а волны строятся на принципе интерпретации теории ДеМарка. 3. Фильтрует волны по длине и высоте. 4. Рисует до шести уровней ZigZag одновременно , отслеживая волны разных порядков. 5. Отмечает Импульсные и Откатные волны. 6. Рисует стрелки для открытия позиций 7. Рисует три канала. 8. Отмечает уровни поддержки и сопротивления. 9
Каждый покупатель этого индикатора получает дополнительно Бесплатно: Авторскую утилиту "Bomber Utility", которая автоматически сопровождает каждю торговую операцию, устанавливает уровни Стоп Лосс и Тейк профит и закрывает сделки согласно правилам этой стратегии, Сет-файлы для настройки этого индикатора на различных активах, Сет-файлы для настройки Bomber Utility в режимы: "Минимум Риска", "Взвешенный Риск" и "Стратегия Выжидания", Пошаговый видео-мануал, который поможет вам быстро установить, н
Atomic Analyst — MetaTrader 5 После покупки напишите мне на MQL5, чтобы БЕСПЛАТНО получить Smart Universal Expert Advisor, а также доступ к онлайн-курсу, руководство в формате PDF и доступ к закрытой группе. Atomic Analyst объединяет анализ ценового движения, направление тренда, сигналы входа и выхода, уровни Stop Loss и несколько уровней Take Profit прямо на графике. УВИДЬТЕ СИГНАЛ. ОЦЕНИТЕ ТОРГОВУЮ СИТУАЦИЮ. Atomic Analyst представляет результаты анализа в понятном визуальном виде: • Стрелки п
Другие продукты этого автора
Silent Arrow MT5 -  BUY and SELL arrows that never repaint. Most arrow indicators look perfect in history because they quietly redraw their arrows afterwards. Silent Arrow doesn’t. Each arrow is decided once, when its candle closes, using closed candles only. After that it never moves, never disappears, and never appears late on an older candle. Reload the chart and you get exactly the arrows you saw live, so history shows what you could actually have traded. What Silent Arrow does Prints a BUY
Enhanced TP/SL  MT5 Short description Shows the Take Profit and Stop Loss levels of open positions on the chart, with the distance in pips, the value in account currency, the percentage of account balance and the risk to reward ratio. Full description The Enhanced TP/SL indicator draws the entry price, Take Profit and Stop Loss levels of each open position on the chart. Next to the Take Profit and Stop Loss lines, the indicator can show: the distance from the open price in pips, the value
FREE
Session lines that are actually correct. Marks Sydney, Tokyo, London, and NY open/close in your broker's local time — with automatic DST adjustment for all three regions. You set your session times once in GMT, toggle DST for Sydney/London/NY, and forget about it. The indicator handles the rest - broker offset, daylight saving, label positioning - all in the background. Clean labels, toggleable sessions, zero CPU drag. Built for traders who need the market rhythm on their chart without the clut
FREE
MTF High Low indicator displays key price levels across multiple timeframes directly on your chart,  so you always know where the market has been and what levels matter most. The   NY Session High/Low Levels  automatically plot the highest and lowest prices of the New York trading session on your chart. It provides clear horizontal lines for the   Today (TDY) ,   Yesterday (YTD) ,   Week (7D) , and   Month (30D)   sessions, with customizable display options.           Inspired by MTF.HighLow.
FREE
Enhanced TP/SL  MT4 Short description Shows the Take Profit and Stop Loss levels of open positions on the chart, with the distance in pips, the value in account currency, the percentage of account balance and the risk to reward ratio. Full description The Enhanced TP/SL indicator draws the entry price, Take Profit and Stop Loss levels of each open position on the chart. Next to the Take Profit and Stop Loss lines, the indicator can show: the distance from the open price in pips, the value i
FREE
TradeVisualizer is a dynamic chart-based indicator for MetaTrader 5, designed to visually display recent trades directly on the chart. It includes: Trade arrows for entry and exit points, color-coded by direction and profit/loss. Dotted lines connecting open and closed trades. Profit/loss labels in pips and currency. Interactive toggle button to show/hide drawings. Trade history panel showing time, ticket, type, lot size, pips, and P/L. Customizable appearance via inputs for colors, fonts, and
FREE
Features: Sydney, Tokyo, London, and New York session lines — open and close Automatic DST adjustment: Australian (Oct–Apr), European (Mar–Oct), US (Mar–Nov). Tokyo fixed, no DST Toggle each session on or off independently Fully customizable: colors, line styles, line width, label size and position Runs on new bar only — no unnecessary recalculations Works on M1 through H1. Disabled on higher timeframes automatically Inputs: Show/hide each session independently Session open and close times in GM
FREE
Advanced Trade Information Dashboard –  MT5 Everything I need to know about my account and open positions, right on the chart. I got tired of clicking between the terminal, the trade tab, and the calculator just to check my margin, pip value, or total profit in pips. So I built this dashboard to put it all in one place. What It Shows Total P&L   – Real profit/loss from the positions I care about (filter by symbol, magic number, or include swap/commission). Margin Level   – The one number th
FREE
MTF High Low indicator displays key price levels across multiple timeframes directly on your chart,  so you always know where the market has been and what levels matter most. The   NY Session High/Low Levels    automatically plot the highest and lowest prices of the New York trading session on your chart. It provides clear horizontal lines for the   Today (TDY) ,   Yesterday (YTD) ,   Week (7D) , and   Month (30D)   sessions, with customizable display options.           Inspired by MTF.HighLow
FREE
Trade Visuals is a dynamic chart-based indicator for MetaTrader 4, designed to visually display recent trades directly on the chart. It includes: Trade arrows for entry and exit points, color-coded by direction and profit/loss. Dotted lines connecting open and closed trades. Profit/loss labels in pips and currency. Interactive toggle button to show/hide drawings. Trade history panel showing time, ticket, type, lot size, pips, and P/L. Customizable appearance via inputs for colors, fonts, and la
FREE
Advanced Trade Information Dashboard –  MT4 Everything I need to know about my account and open positions, right on the chart. I got tired of clicking between the terminal, the trade tab, and the calculator just to check my margin, pip value, or total profit in pips. So I built this dashboard to put it all in one place. What It Shows Total P&L – Real profit/loss from the positions I care about (filter by symbol, magic number, or include swap/commission). Margin Level – The one number that k
FREE
ClearEdge HUD MT4 Market structure, momentum, flow, and trade-quality scoring in one clean trading HUD. ClearEdge HUD MT4 is a professional market-intelligence panel for MetaTrader 4. It helps traders read market direction, structure, momentum, volatility, session context, and trade quality directly beside live price action. Instead of filling the chart with multiple indicators, ClearEdge condenses the key trading conditions into one vertical dashboard and one simple score: 0 to 8 Trade Conflu
QuadZig MT4: 4-Level ZigZag Semafor & Multi-Timeframe Dashboard. Real-time market structure, smart trend mapping & 8-TF analysis for professional MT4 traders. Most traders lose not because they lack information — but because they have too much of it. QuadZig cuts through the noise by mapping the market’s full structural skeleton across 4 levels and 8 timeframes, all inside one clean, intelligent dashboard. What Is QuadZig? QuadZig is a professional 4‑Level ZigZag Semafor Indicator with a buil
MACD FuturePredict Panel Pro MT4 Predictive MACD-style momentum, signal scoring, and execution guidance in one professional trading panel. MACD FuturePredict Panel Pro is an advanced momentum dashboard for MetaTrader 4. It is designed to help traders read market direction, momentum strength, higher-timeframe bias, signal quality, and execution context from one clean on-chart panel. Instead of relying only on a basic MACD crossover, the indicator evaluates momentum pressure, trend condition, vo
Keltner Channel Forecast MT4 is an adaptive predictive indicator that extends standard Keltner Channels into the future, giving traders a clearer view of likely price range and trend direction before the move unfolds. The indicator projects three dotted forecast lines based on current volatility and price structure, creating a visual roadmap of where price may reasonably travel in the coming bars. A built-in dashboard reads trend conditions in plain language, from quiet to active states, and no
Kalman Cone Forecast MT4 Adaptive forecast cone, trend pressure, and exhaustion detection in one clean trading panel. Kalman Cone Forecast is an adaptive predictive indicator for MetaTrader 4. It uses Kalman filter smoothing to reduce market noise, estimate current trend pressure, and project a forward price cone based on live volatility conditions. Instead of showing only a moving average line or a basic volatility band, Kalman Cone Forecast gives you a clearer answer to three important quest
Silent Arrow MT4 -  BUY and SELL arrows that never repaint. Most arrow indicators look perfect in history because they quietly redraw their arrows afterwards. Silent Arrow doesn’t. Each arrow is decided once, when its candle closes, using closed candles only. After that it never moves, never disappears, and never appears late on an older candle. Reload the chart and you get exactly the arrows you saw live, so history shows what you could actually have traded. What Silent Arrow does Prints a BUY
Equity Pulse MT4 Real-time equity, drawdown, and portfolio performance tracking in one clean trading panel. Equity Pulse MT4 is a practical account-monitoring indicator for MetaTrader 4. It helps traders see exactly where they stand across today, yesterday, recent days, the current week, month, and year. Instead of checking account history manually or relying only on the terminal’s floating profit number, Equity Pulse gives you a clear performance snapshot directly on the chart. It is designed
ClearEdge Daily Candle MT4 New York-close daily candle on any timeframe, with candle countdown, live spread and volatility information. Overview  ClearEdge Daily Candle draws the current day's candle next to the live price on any chart timeframe. On the 1-minute, 5-minute, 15-minute, 1-hour or higher charts, you can see where the trading day opened, how far price has moved in both directions, and whether the day is currently bullish or bearish, without switching to the daily (D1) chart. Why
ClearEdge HUD MT5 Market structure, momentum, flow, and trade-quality scoring in one clean trading HUD. ClearEdge HUD MT5 is a professional market-intelligence panel for MetaTrader 5. It helps traders read market direction, structure, momentum, volatility, session context, and trade quality directly beside live price action. Instead of filling the chart with multiple indicators, ClearEdge condenses the key trading conditions into one vertical dashboard and one simple score: 0 to 8 Trade Conflue
MACD FuturePredict Panel Pro MT5 Predictive MACD-style momentum, signal scoring, and execution guidance in one professional trading panel. MACD FuturePredict Panel Pro is an advanced momentum dashboard for MetaTrader 5. It is designed to help traders read market direction, momentum strength, higher-timeframe bias, signal quality, and execution context from one clean on-chart panel. Instead of relying only on a basic MACD crossover, the indicator evaluates momentum pressure, trend condition, vol
Keltner Channel Forecast MT5 is an adaptive predictive indicator that extends standard Keltner Channels into the future, giving traders a clearer view of likely price range and trend direction before the move unfolds. The indicator projects three dotted forecast lines based on current volatility and price structure, creating a visual roadmap of where price may reasonably travel in the coming bars. A built-in dashboard reads trend conditions in plain language, from quiet to active states, and no
Kalman Cone Forecast MT5 Adaptive forecast cone, trend pressure, and exhaustion detection in one clean trading panel. Kaman Cone Forecast is an adaptive predictive indicator for MetaTrader 5. It uses Kalman filter smoothing to reduce market noise, estimate current trend pressure, and project a forward price cone based on live volatility conditions. Instead of showing only a moving average line or a basic volatility band, Kalman Cone Forecast gives you a clearer answer to three important questi
Equity Pulse MT5 Real-time equity, drawdown, and portfolio performance tracking in one clean trading panel. Equity Pulse MT5 is a practical account-monitoring indicator for MetaTrader 5. It helps traders see exactly where they stand across today, yesterday, recent days, the current week, month, and year. Instead of checking account history manually or relying only on the terminal’s floating profit number, Equity Pulse gives you a clear performance snapshot directly on the chart. It is designed
ClearEdge Daily Candle New York-close daily candle on any timeframe, with candle countdown, live spread and volatility information. Overview  ClearEdge Daily Candle draws the current day's candle next to the live price on any chart timeframe. On the 1-minute, 5-minute, 15-minute, 1-hour or higher charts, you can see where the trading day opened, how far price has moved in both directions, and whether the day is currently bullish or bearish, without switching to the daily (D1) chart. Why bro
Фильтр:
Нет отзывов
Ответ на отзыв