MACD Divergence Radar Pro

MACD Divergence Radar Pro

Multi-Symbol Divergence Scanner & Visual Dashboard for MetaTrader 5

Regular & Hidden Divergence 20+ Pairs Simultaneous Scan Entry / SL / TP Levels History Statistics One-Click Chart Opening Auto Oscillator Sub-Window

Overview

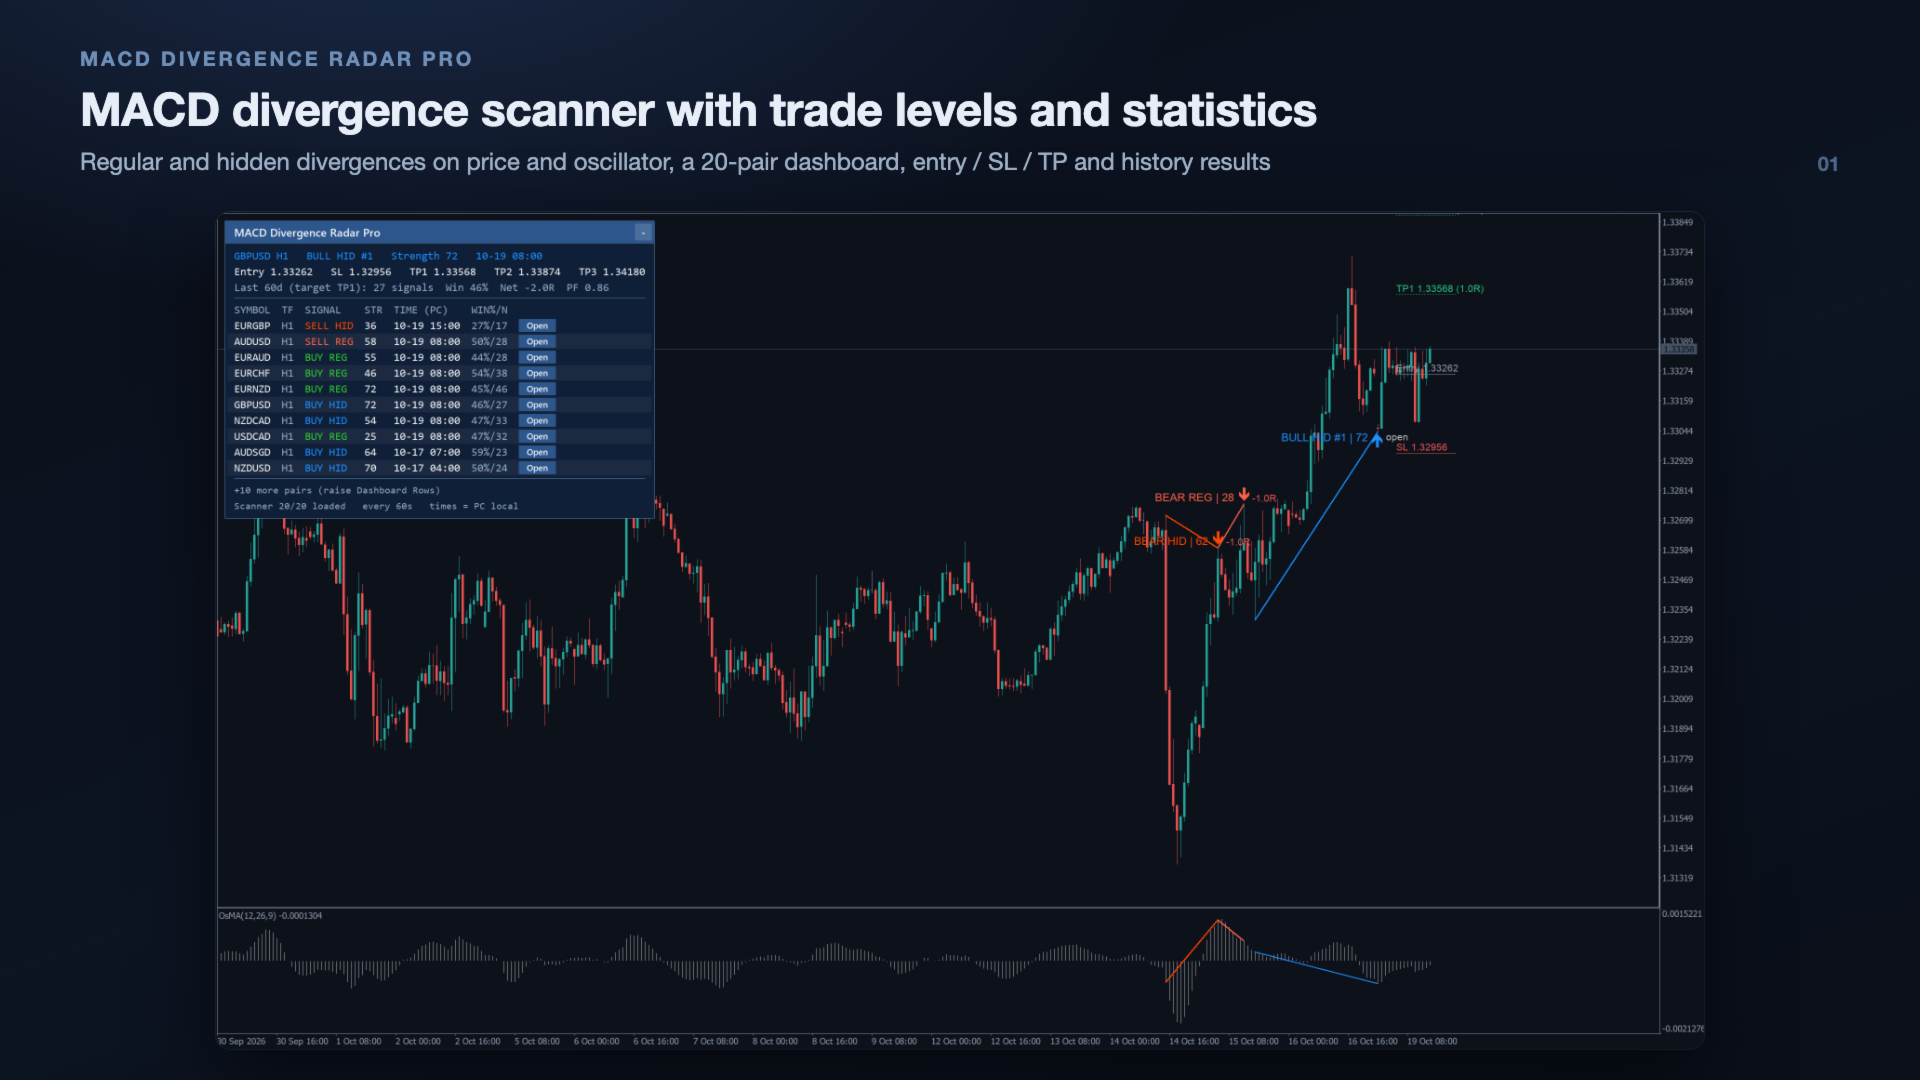
MACD Divergence Radar Pro is a professional-grade divergence detection indicator that continuously scans multiple currency pairs and timeframes in real time. It identifies both regular and hidden MACD divergences — bullish and bearish — and presents all findings in a sleek, draggable on-chart dashboard. Every signal is drawn directly on the price chart and the oscillator window, giving you instant visual confirmation without switching between charts. Each signal comes with a strength score, an entry, a stop loss and three take-profit levels, and the indicator shows how its past signals on every pair actually played out against those levels.

Why divergence matters: MACD divergence signals a weakening trend before price reverses. Catching divergence early can mean the difference between entering near the top/bottom and chasing the move. This indicator automates the tedious manual scanning, so you do not have to watch every chart yourself.

Key Features

Multi-Symbol Real-Time Scanner

Scan 20+ forex pairs simultaneously on any timeframe. Configurable symbol list and scan intervals. You monitor one chart — the radar watches them all.

Auto Oscillator Sub-Window

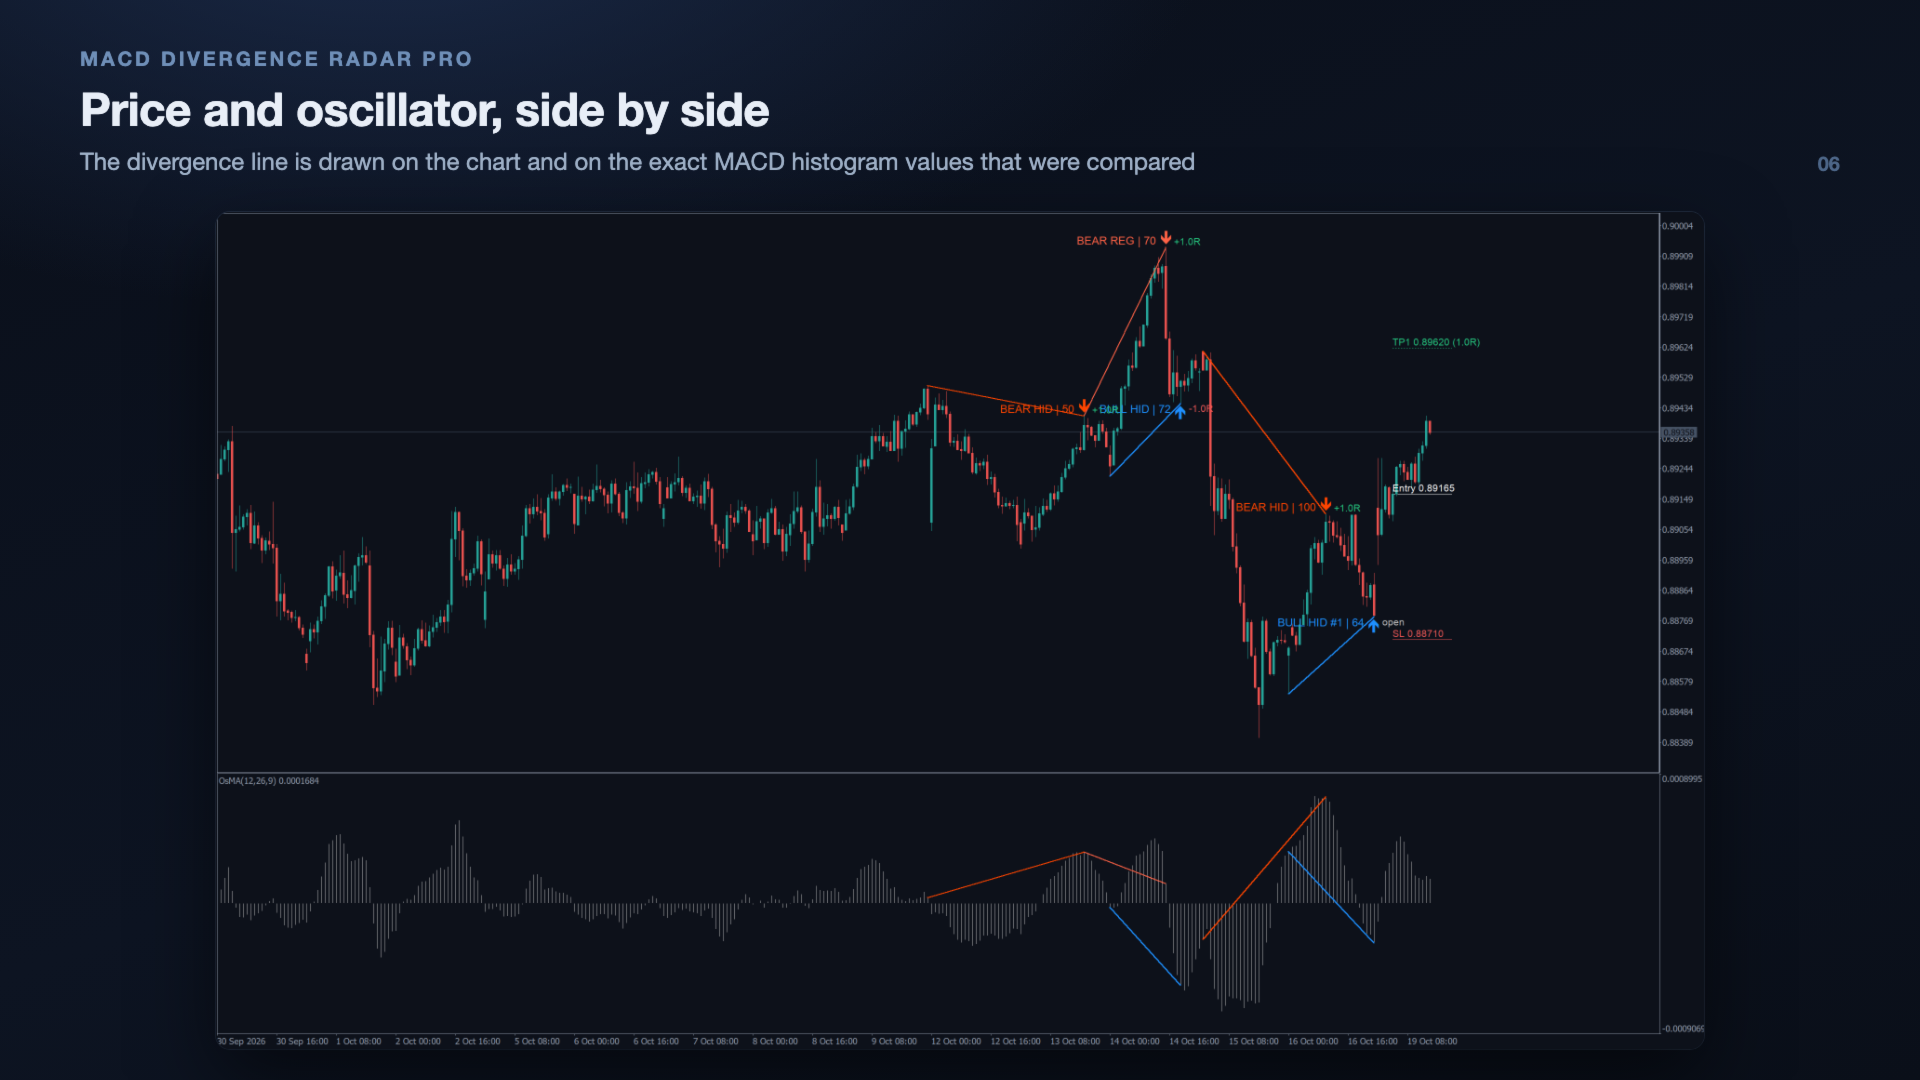
Automatically adds the oscillator the divergence is measured on below the chart: OsMA (the MACD histogram, main − signal) in Histogram mode, or MACD in Main Line mode. Divergence lines are drawn on both the price chart and that window, on the exact values that were compared. The window is removed again when the indicator is removed.

Regular & Hidden Divergence

Detects all four divergence types: Regular Bullish, Regular Bearish, Hidden Bullish, and Hidden Bearish. Each type is color-coded for instant recognition.

Scanner Dashboard

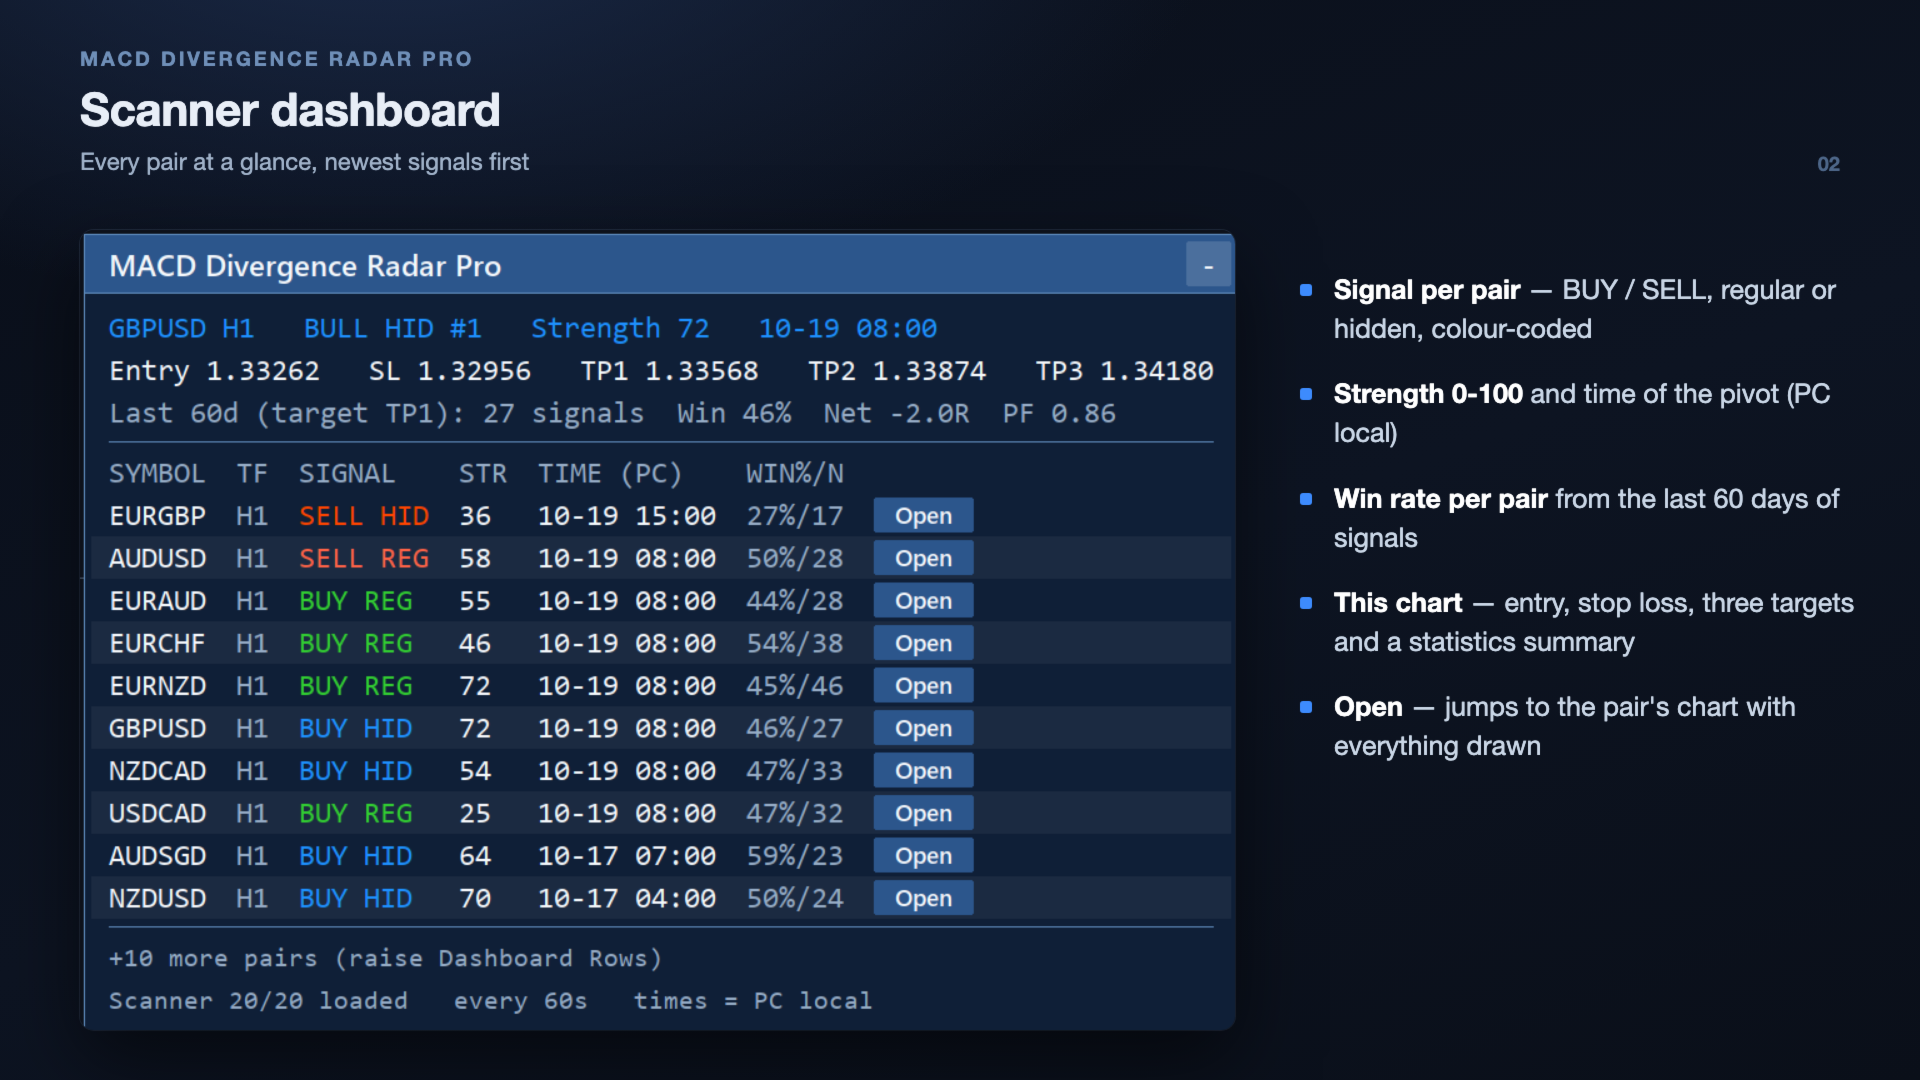
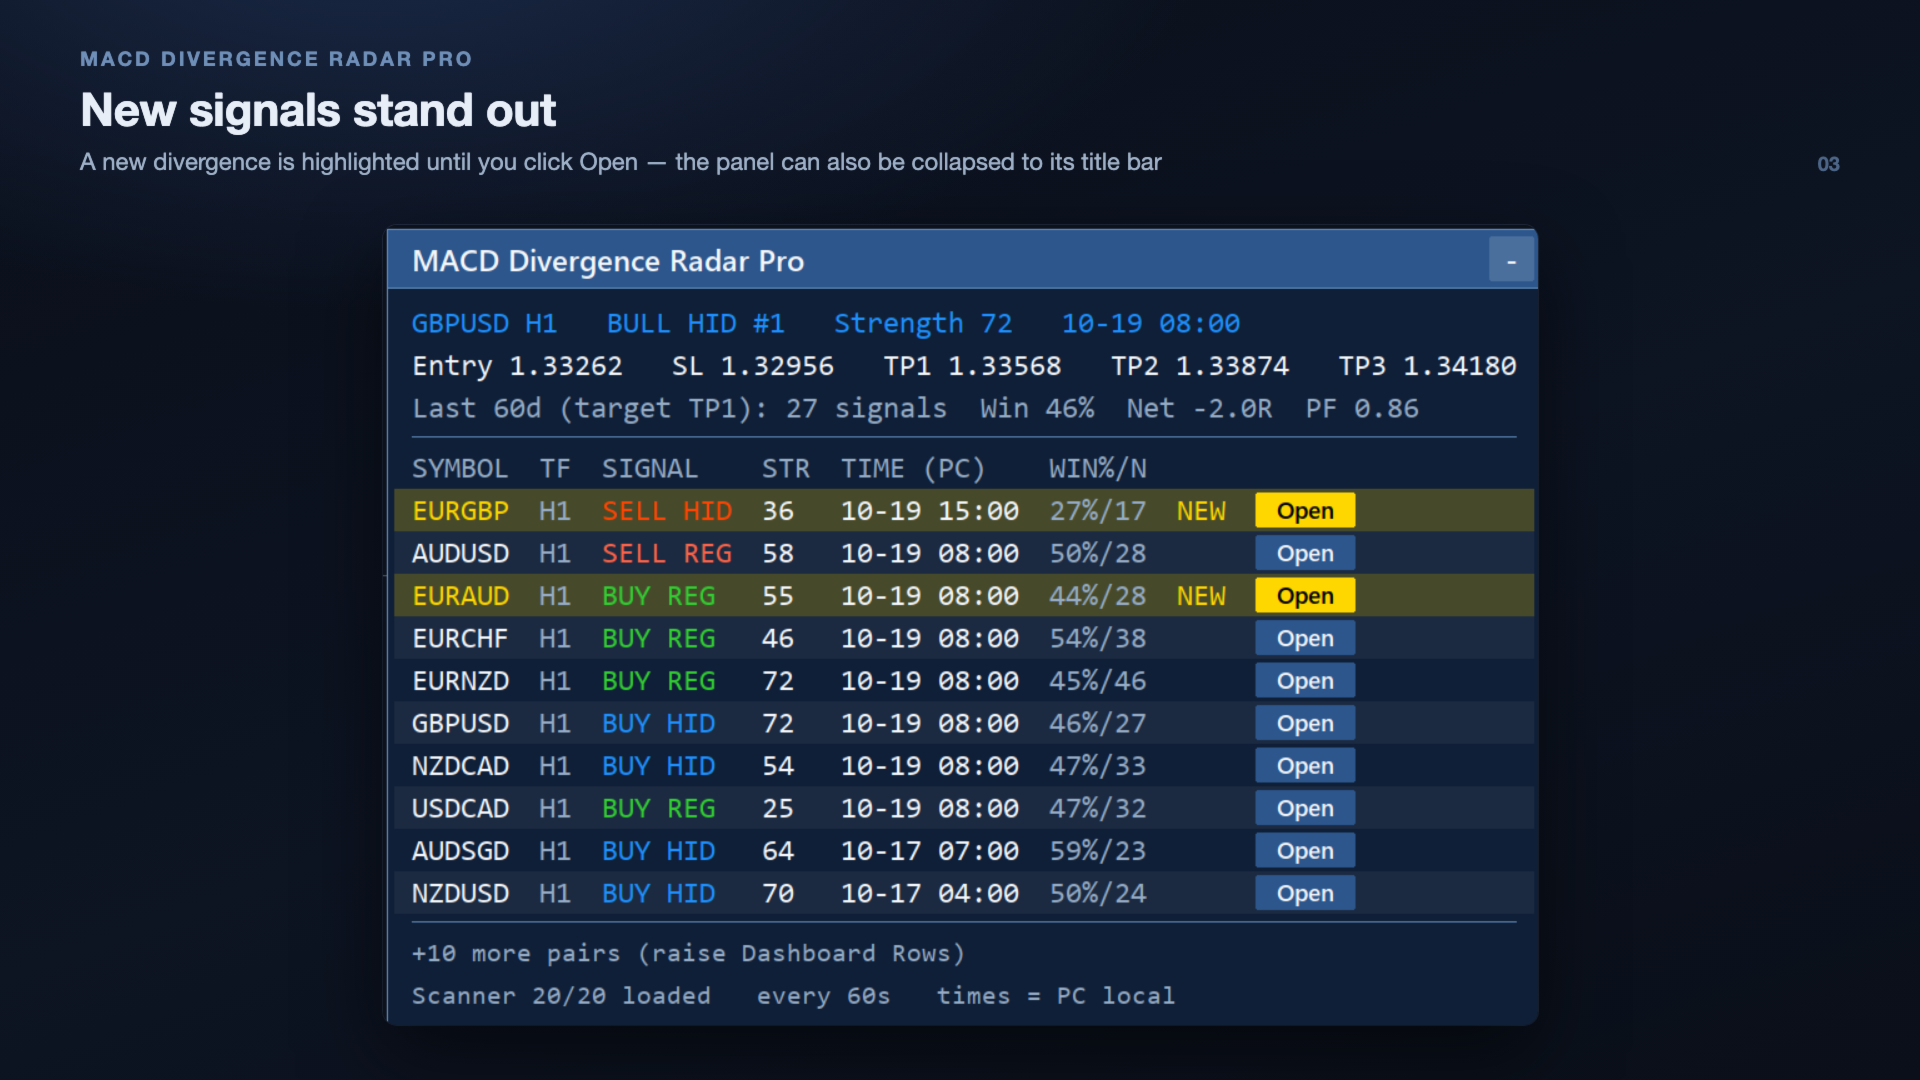
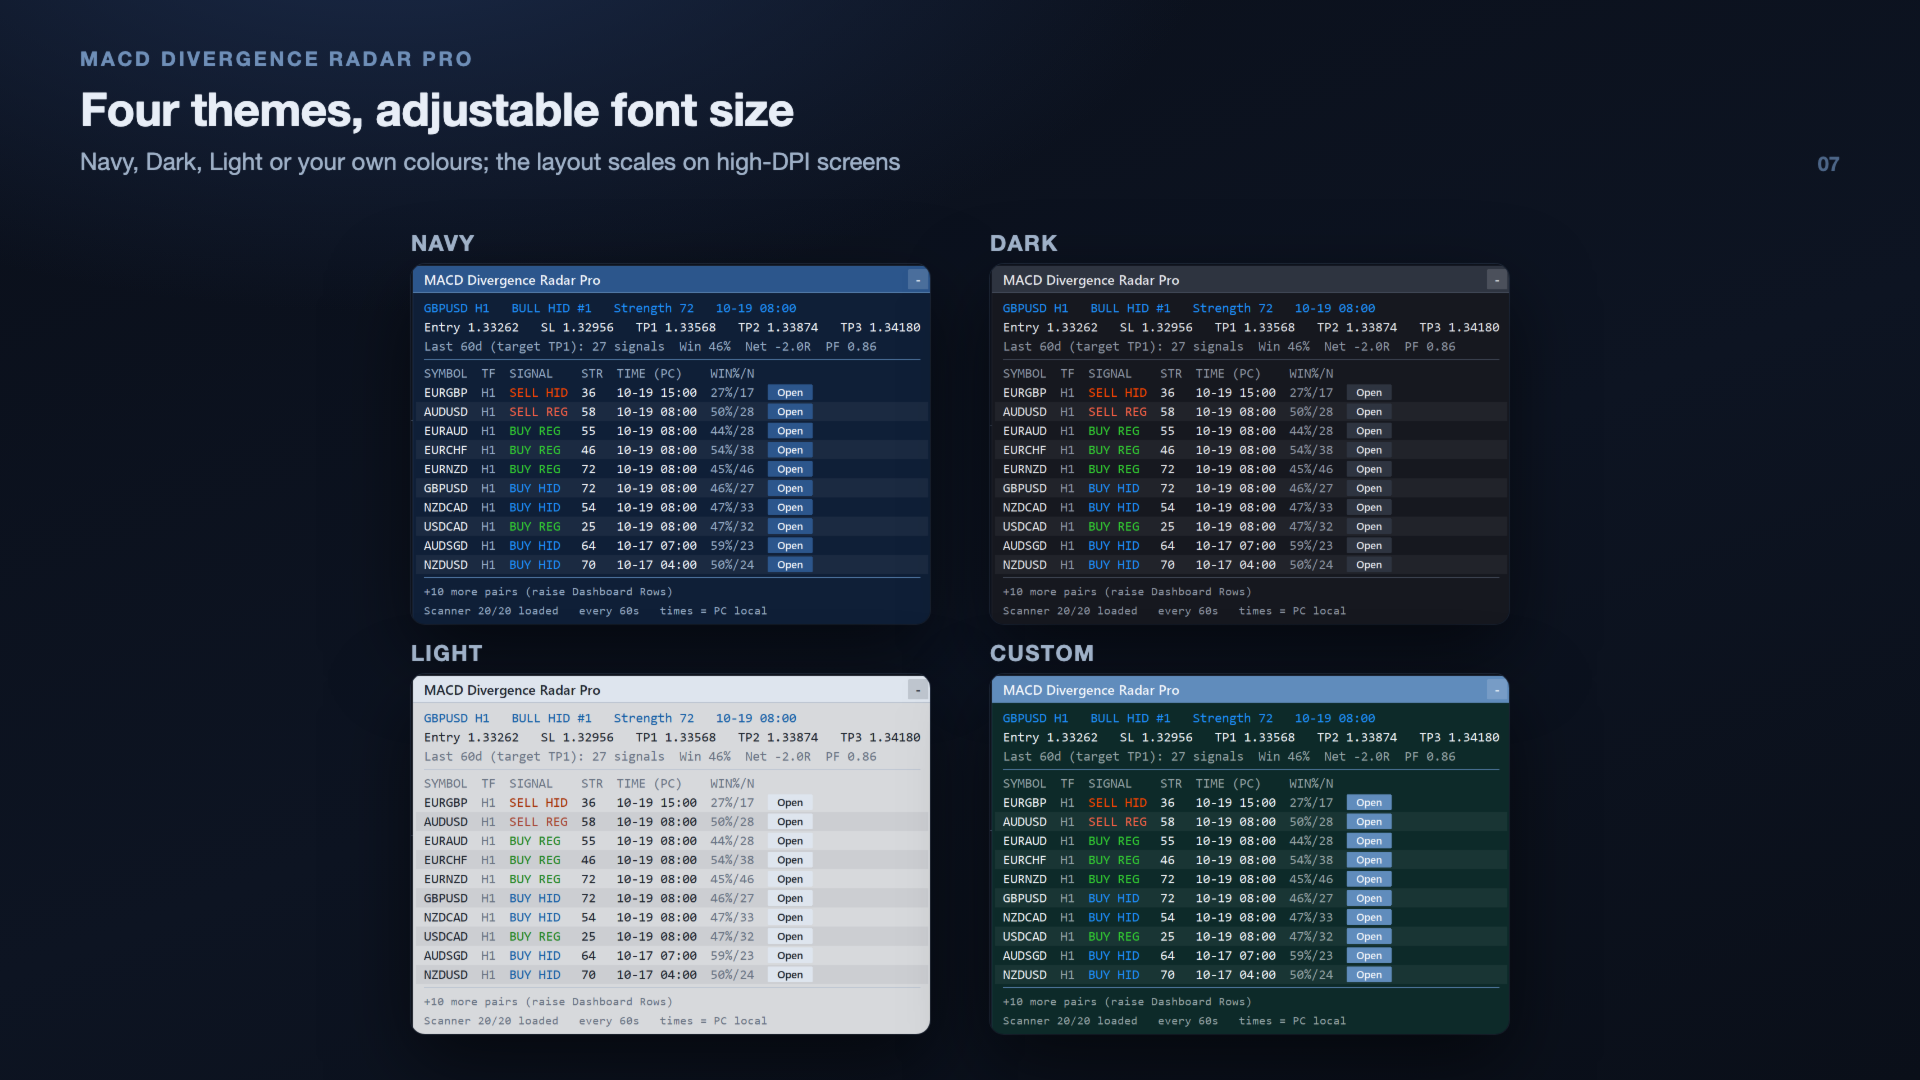
A clean table lists every scanned pair with columns for symbol, timeframe, signal (colour-coded BUY / SELL, regular / hidden), strength, time (PC local) and the pair's historical win rate, newest signals first. Above it the panel shows this chart's current signal with its entry, stop loss and targets, plus the statistics summary. A newly alerted divergence is highlighted (row background, NEW badge and Open button) until you click Open, so it stands out even with many pairs. The footer shows the scanner status and a "+N more pairs" line when rows are capped.

One-Click Chart Opening

Each scanner entry has an Open button. Click it to open the symbol's chart with the oscillator sub-window and divergence lines already drawn. If a chart of that symbol and timeframe is already open, it is brought to the front instead of opening a duplicate. The chart shows every divergence of the last few days (History Days, default 7), not just the latest one.

Multi-Channel Alerts

Get notified via popup, push notification, email or a sound file the moment a new divergence is confirmed. Alerts fire only for freshly confirmed pivots — history loaded at start-up or after a reconnect updates the dashboard silently, so you are never flooded with old signals. Signals found in the same scan are combined into one email / push message, and pushes respect the MT5 limit of 10 per minute, so none are dropped. Each alert includes the signal strength, entry, stop loss and TP1. A one-off test alert and clear Experts-log messages help you check the push / email setup.

Entry, Stop Loss & Take-Profit Levels

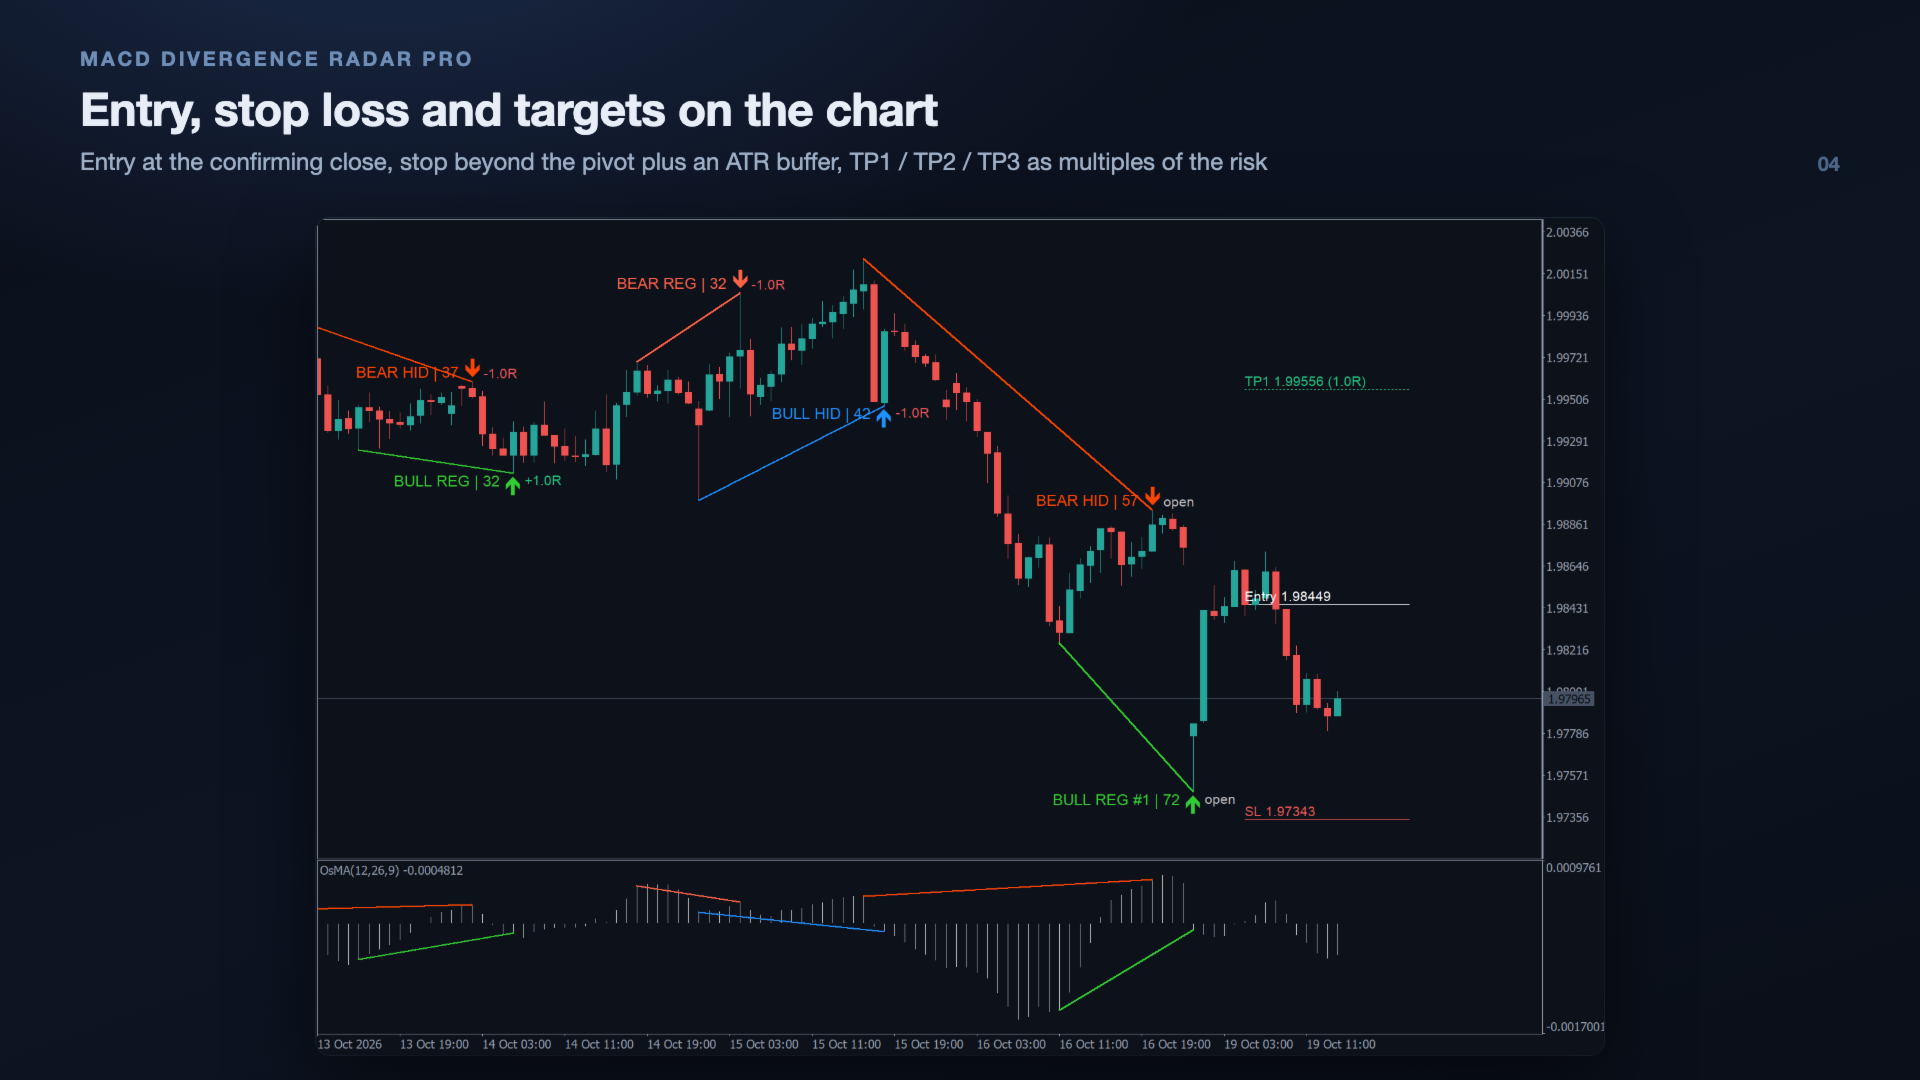
For the latest signal the indicator draws an entry (close of the bar that confirmed the pivot), a stop loss beyond the pivot with an ATR buffer, and three targets (TP1 / TP2 / TP3) as multiples of the risk — by default 1R, 2R and 3R. The same levels appear on the panel, on charts opened from the panel and in the alerts.

History Statistics & Result Labels

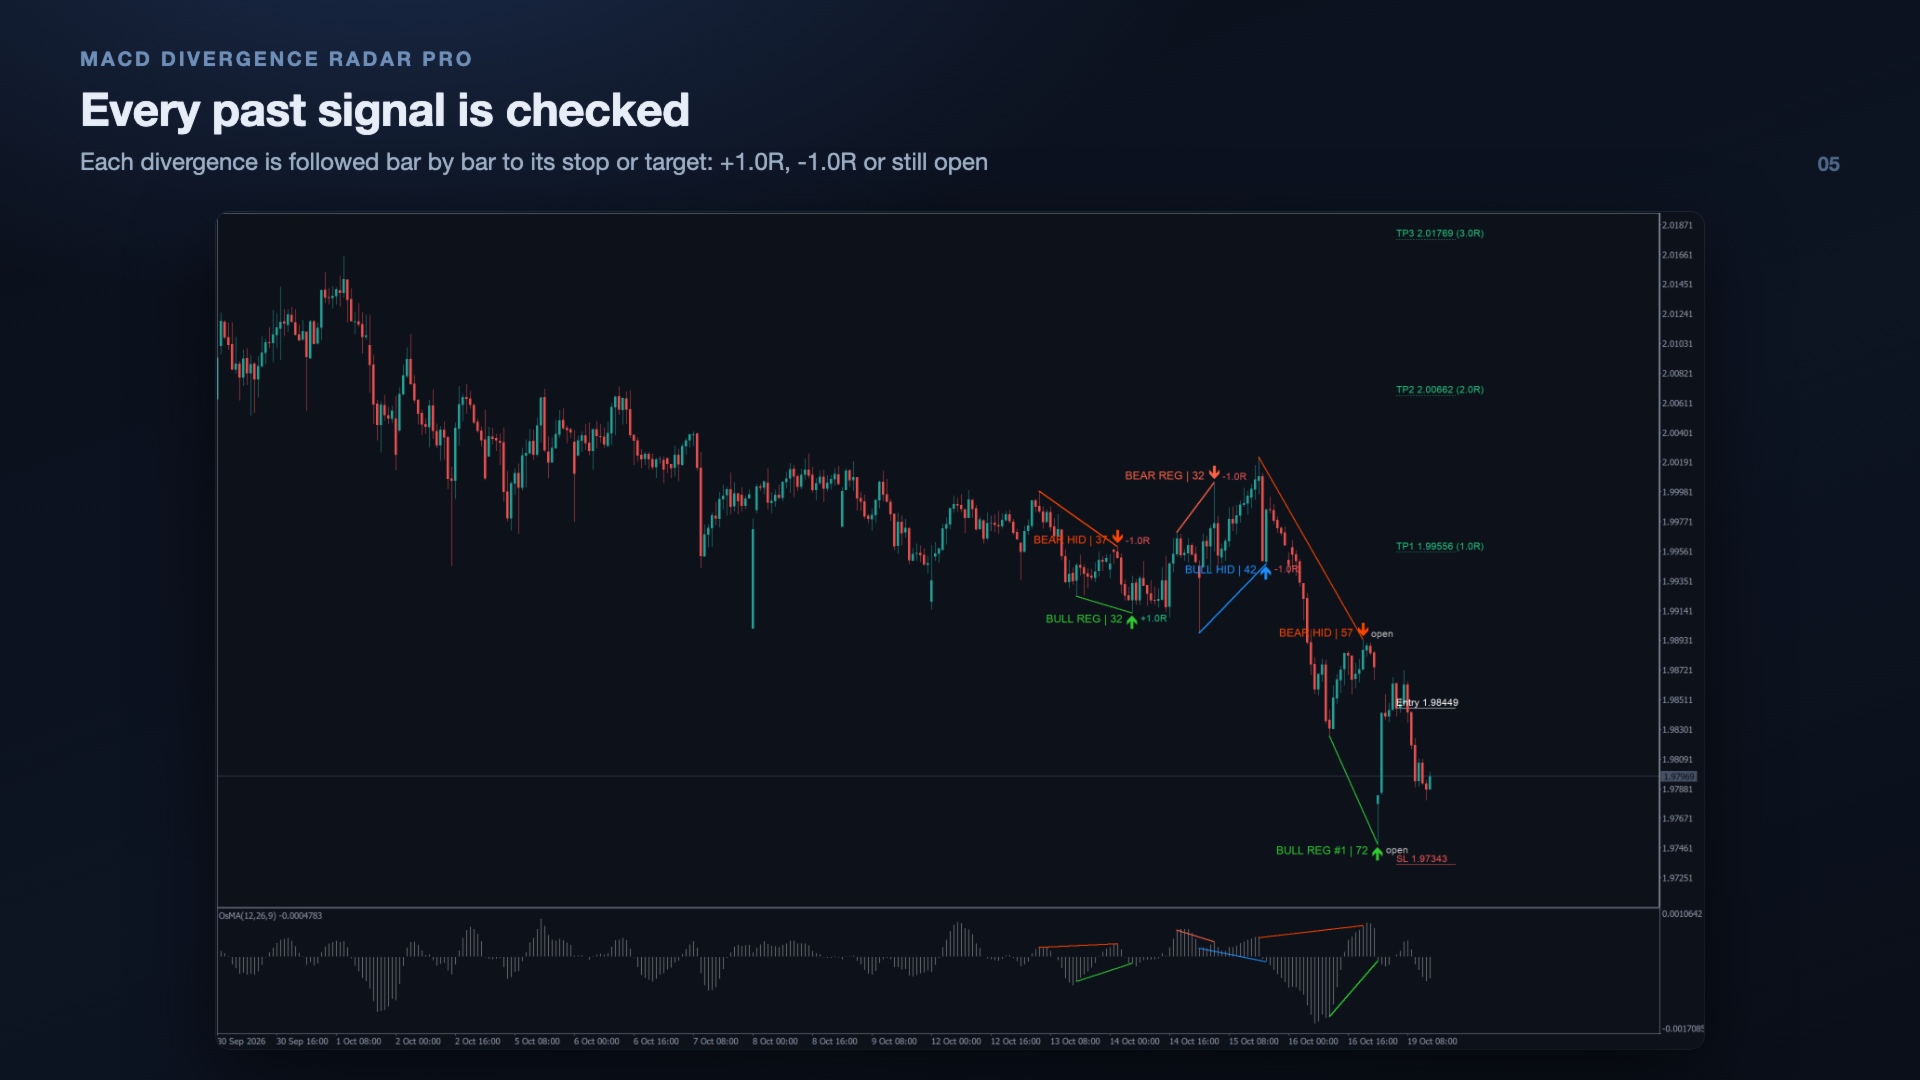
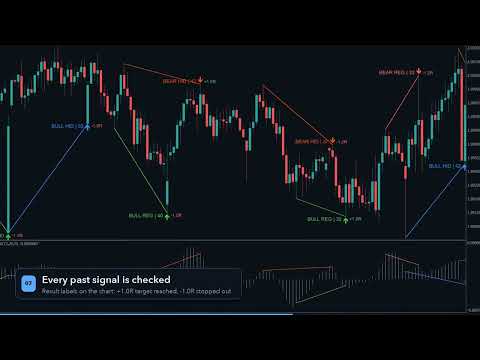
Every past divergence of the Statistics Period (default 60 days) is checked bar by bar against its stop loss and the chosen target. The panel shows the number of signals, win rate, net result in R and profit factor for this chart, and the win rate per pair in the scanner table. Past signals on the chart carry a result label (+1.0R, -1.0R or open), so you can judge each pair and each setting on real history.

Signal Strength & Quality Filters

Each divergence gets a strength score from 0 to 100, based on the size of the price swing (in ATR), the size of the oscillator disagreement and the distance between the pivots. Optional filters: minimum strength, minimum / maximum bars between the pivots, and an EMA trend filter (only hidden divergences with the trend, or all signals with the trend) to cut counter-trend signals in strong trends.

Themes, Collapse & Scaling

Choose the Navy, Dark, Light or Custom theme and an adjustable font size; rows, buttons and panel size follow it, and the layout scales correctly on high-DPI / Retina screens. Collapse the panel to its header with one click (it then shows the number of new signals). Drag it anywhere by its header; position and collapsed state are kept when you switch timeframe. All inputs have readable names.

Divergence Types Detected

Type Price Action MACD Action Implication
Regular Bullish Lower Low Higher Low Potential reversal UP
Regular Bearish Higher High Lower High Potential reversal DOWN
Hidden Bullish Higher Low Lower Low Trend continuation UP
Hidden Bearish Lower High Higher High Trend continuation DOWN

How It Works

  1. Attach to any chart — the indicator loads instantly. An OsMA (12, 26, 9) sub-window — or MACD (12, 26, 9) in Main Line mode — is added automatically below price.
  2. The scanner begins — it monitors all configured symbols/timeframes, detecting pivot highs and lows on price and comparing the oscillator at those pivots.
  3. Divergence identified — trend lines are drawn on the price chart AND the oscillator window, together with the entry, stop loss and take-profit levels. The dashboard updates and an alert fires.
  4. Click "Open" — open any symbol's chart directly from the dashboard with the oscillator window and the divergences of the last days pre-drawn; an already open chart is reused, and the NEW highlight on that row is cleared.
  5. Check the statistics — the panel and the result labels show how the past signals of each pair worked out, so you can focus on the pairs and settings that suit your trading.

Dual-View Divergence Visualization

Unlike most divergence indicators that only mark price, MACD Divergence Radar Pro draws synchronized trend lines on both the main price window and the oscillator sub-window:

  • Price chart: Trend line connecting the two pivot points + directional arrow + signal label with strength, a result label on past signals, and entry / stop loss / TP1-TP3 lines for the latest signal
  • Oscillator window: trend line on the same oscillator values that were compared (OsMA histogram or MACD main line), connecting the same pivots, so the divergence is visually obvious
  • Color-coded: Bullish Regular, Bullish Hidden, Bearish Regular, Bearish Hidden

Input Parameters

Signal Engine

Parameter Default Description
MACD Fast / Slow / Signal 12 / 26 / 9 MACD periods
Oscillator Source MACD histogram (OsMA) Main line or histogram (main − signal); also selects the sub-window (MACD or OsMA)
Pivot Span 5 Bars on each side to confirm a pivot
Lookback Bars 300 How many closed bars back to search for pivots
Min Price Delta (points) 50 Minimum price difference between pivots
Min Oscillator Delta 0.00005 Minimum oscillator difference between pivots
Regular / Hidden Divergence On / On Enable each divergence type
Max Same-Direction Signals 4 Cap repeated signals in one direction (0 = no limit)
Scan On New Bar Only On Reduce CPU usage on the current chart
Min / Max Bars Between Pivots 0 / 0 Allowed distance between the two pivots (0 = off)
Min Signal Strength 0 Hide signals with a lower strength score (0-100, 0 = off)
Trend Filter (EMA) Off Off, hidden divergences with the trend, or all divergences with the trend
Trend EMA Period 200 EMA used by the trend filter

Trade Levels & Statistics

Parameter Default Description
Show Entry / SL / TP Levels On Draw the levels of the latest signal on the chart and show them on the panel and in alerts
ATR Period 14 ATR used for the stop buffer and the strength score
Stop Loss Buffer beyond Pivot (x ATR) 0.5 Stop loss distance beyond the pivot high / low
TP1 / TP2 / TP3 (x risk) 1 / 2 / 3 Targets as multiples of the entry-to-stop distance
Statistics Period (days) 60 History used for the statistics (0 = off)
Statistics Target TP1 Target that counts as a win in the statistics and result labels
Show Result Labels on Past Signals On +R / -1.0R / open label next to each drawn signal

Scanner / Dashboard

Parameter Default Description
Enable Scanner On Toggle multi-symbol scanning
Scanner Symbols 20 major & cross pairs Comma-separated symbol list (auto-resolves broker suffixes)
Scanner Timeframes H1 Comma-separated: M5, M15, H1, H4, D1, etc.
Scanner Interval (seconds) 60 How often to re-scan all symbols
Dashboard Rows 12 Maximum scanner rows in the panel (newest signals first); 0 = show all
History Days drawn on charts 7 Divergences of the last N days drawn on the chart and on charts opened from the panel; 0 = latest only
Last Optimization Date / Optimization Reminder 2026.03.16 / 7 Shows a reminder on the panel when your settings are older than N days (0 = off)

Alerts

Parameter Default Description
Popup / Push / Email Alerts On / Off / Off Alert channels
Email Subject MACD Divergence Radar Subject of alert e-mails
Send Test Alert On Start Off Sends one test push / email when the indicator is attached, to check your setup
Sound Alerts / Sound File Off / alert.wav Play a sound file from the terminal Sounds folder on each alert

Visuals

Parameter Default Description
Show Signals on Chart On Draw divergence lines, arrows, labels and levels
Show Dashboard Panel On Display the dashboard panel
Panel Theme Navy Navy, Dark, Light or Custom (uses the panel colours below)
Panel X / Y 12 / 18 Initial panel position (drag to move)
Panel Font Size 9 Dashboard font size (6–24); rows, buttons and panel size follow it
Highlight New Signals / New Signal Colour On / Gold Highlight a newly alerted signal until its Open button is clicked
Signal Colours — Regular / hidden bullish and bearish colours
Panel Background Opacity 192 0-255, blended with the chart background
Panel Background / Header / Text — Panel colours used by the Custom theme

How the Statistics Are Calculated

For each past divergence the entry is the close of the bar that confirmed the pivot. The following closed bars are checked one by one: if the stop loss is touched first the signal counts as -1R, if the Statistics Target is reached first it counts as a win of that many R; a bar that touches both counts as a loss. Signals that reached neither level are shown as open. Spread, commission and slippage are not included. The statistics describe the past behaviour of the signals on your broker's data and are not a forecast of future results.

Push & Email Setup

  • Push: in MT5 open Tools > Options > Notifications, tick "Enable Push Notifications" and enter the MetaQuotes ID shown in the MT5 mobile app (Settings > Messages). The "Test" button there must reach your phone first. Allow notifications for the MetaTrader 5 app on the phone. Android phones without Google Play services cannot receive MetaQuotes push messages.
  • Email: fill in Tools > Options > Email (SMTP server, login, from / to). The indicator sends the mail at the moment of the alert; any further delay comes from the mail server.
  • If a message cannot be sent, the reason is printed in the Experts log.

Optimized Performance

  • MACD handle caching — indicator handles are created once and reused, avoiding the overhead of creating/releasing handles on every scan cycle.
  • Panel text caching — dashboard text is rebuilt only when signals change or every 5 seconds, not on every tick.
  • Smart drag rendering — during panel drag, only position properties are updated (no full redraw), ensuring smooth 60fps-like responsiveness.
  • New bar filtering — optional scan-on-new-bar-only mode reduces CPU usage to near zero between bars.

Broker Compatibility

The built-in smart symbol resolver automatically matches your input symbols (e.g., EURUSD) to your broker's naming convention (e.g., EURUSD.i, EURUSDm, EURUSD.pro). No manual suffix configuration needed — just type the base pair name and the indicator handles the rest.

Recommended Usage

  • Swing trading / Intraday: Use H1 or H4 timeframes for high-quality divergence signals.
  • Multi-timeframe confirmation: Set scanner timeframes to H1,H4 and look for divergence alignment across timeframes.
  • Combine with S/R levels: Divergence at key support/resistance zones can offer higher-probability entries.
  • Risk management: Use the "Max Same Direction Signals" setting to avoid over-trading in choppy markets, and the trend filter or a minimum strength in strongly trending markets.
  • Compare settings on history: change Pivot Span, filters or targets and watch the win rate and net R on the panel update for every pair.

Requirements

  • MetaTrader 5 (build 2500 or later recommended)
  • Any broker with standard OHLC data
  • Recommended: VPS or always-on PC for continuous scanner monitoring and push alerts
© 2026 MACD Divergence Radar Pro — Professional divergence detection for MetaTrader 5.
Рекомендуем также
MACD Titanium — это индикатор Zero-Lag MACD для MetaTrader 5, разработанный для предоставления более быстрых и чистых сигналов импульса по сравнению с классическим MACD. Используя расчёты Zero-Lag EMA, индикатор снижает задержку сигнала и быстрее реагирует на изменения рыночного импульса, сохраняя при этом привычную структуру MACD, на которую полагаются трейдеры. Что делает его отличным В отличие от стандартного MACD, MACD Titanium: • Использует Zero-Lag EMA для уменьшения запаздывания • Быстрее
FREE
Moving Average Convergence Divergence (MACD) торговая стратегия - это популярный инструмент технического анализа, который используется для выявления изменений в импульсе и направлении тренда. MACD рассчитывается путем вычитания 26-периодного экспоненциального скользящего среднего (EMA) из 12-периодного EMA. Затем на вершине MACD строится 9-периодное EMA, называемое "линией сигнала", которое действует как триггер для сигналов покупки и продажи. MACD считается находящимся в бычьей территории, когд
FREE
Индикатор Crypto_Forex "HTF Moving Averages Cross" для MT5. - Улучшите свои методы торговли с помощью мощного индикатора HTF Moving Averages Cross для MT5. HTF означает "старший таймфрейм". - Этот индикатор отлично подходит для трендовых трейдеров, использующих входы по ценовому действию. - Он позволяет прикреплять быстрые и медленные скользящие средние с более старшего таймфрейма к текущему графику --> это профессиональный метод. - HTF MAs Cross имеет встроенные оповещения для мобильных устрой
Добро пожаловать в HiperCube Renko Candles Код скидки на 25% на Darwinex Zero: DWZ2328770MGM Этот индикатор предоставляет вам реальную информацию о рынке, преобразуя ее в стиль Renko Candle. Определение Графики Renko — это тип финансовых диаграмм, которые измеряют и отображают изменения цен, используя кирпичи (или бары) для представления движения цен. В отличие от традиционных графиков свечей, графики Renko не отображают информацию, основанную на времени, а фокусируются исключительно на колеба
FREE
The CV MACD Indicator is a modern and professional momentum indicator designed to analyze trend strength, market direction and potential reversals. By combining the MACD line, signal line and histogram, the indicator helps traders identify market momentum and high-quality trading opportunities with clarity and precision. Features: Precise MACD momentum analysis Early trend reversal detection Clear histogram for market strength visualization Adjustable Fast, Slow and Signal periods Visual Buy & S
FREE
Buy CTS scalping indicator, provide buying and selling signals, automatic channeling and sending signals to mobile phones Using technical analysis and price action methods and modern methods, CTS indicator can draw price channels and recognize price trends with high accuracy and issue entry and exit signals according to them. Traders can easily fluctuate using this indicator in different time frames and in different markets. With the CTS indicator, you can signal in different ways. This indicato
Данный индикатор повторяет широко известную версию индикатора для MetaTrader 4, который есть в интернете в свободном доступе. Индикатор не перерисовывается. Индикатор реализует стратегию прорыва. Стрелки показывают направления рынка. Используйте индикатор на интервалах от M15 и выше. Индикатор рисует две полосы возле ценового действия и генерирует сигналы при закрытии цены под нижней и над верхней полосой. Для расчета нижнего и верхнего порога полос индикатор использует периодические максимумы и
FREE
Pivot Points Indicator – a fast, reliable, and fully customizable pivot detection for MetaTrader 5. This indicator uses MetaTrader’s native iHighest and iLowest functions to identify pivot highs and lows by scanning for the highest and lowest prices within a user-defined window of bars. A pivot is confirmed only when the current bar is the absolute maximum or minimum within the selected range, ensuring accurate and timely signals based on robust built-in logic. Key Features No Repainting : Onc
FREE
ToolBot Probabilistic Analysis - FREE   An effective indicator for your negotiations The toolbot indicator brings the calculation of candles and a probabilistic analysis so that you have more security on your own. Also test our  FREE tops and bottoms indicator: :   https://www.mql5.com/pt/market/product/52385#description Also test our  FREE (RSI, ATR, ADX, OBV) indicator:   https://www.mql5.com/pt/market/product/53448#description Try our EA ToolBot for free:   https://www.mql5.com/market/prod
FREE
Impulse MACD
Elie Baptiste Granger
5 (1)
The Impulse MACD is a technical indicator that combines the power of multiple moving averages to create a unique momentum oscillator. Unlike traditional MACD indicators, this tool uses three different moving averages applied to high, low, and weighted price data to generate more precise market impulse signals. Its strength is its excellent filtering capability during ranging markets. Visual Elements Color-coded Histogram : Dynamic green/red bars that change color based on momentum direction Sign
FREE
KS_RSI_Divergence Это индикатор дивергенции RSI для MetaTrader 5. Он выявляет обычные и скрытые дивергенции между ценой и RSI, которые являются сигналами о потенциальных разворотах и продолжении тренда.  Если вам нравится этот индикатор и вы его используете, пожалуйста, оставьте положительный отзыв для большей креативности в торговых концепциях. Основное назначение Он автоматически определяет, когда цена и RSI движутся не синхронно, выделяя: Сигналы разворота (обычные дивергенции) Синие ди
Price Magnet — Индикатор зон плотности цены и уровней притяжения Price Magnet — это профессиональный аналитический инструмент, который определяет ключевые уровни поддержки и сопротивления на основе статистической плотности распределения цены (Price Density). Индикатор анализирует заданный исторический период и находит ценовые значения, на которых рынок находился дольше всего. Эти зоны выступают в роли «магнитов» — они притягивают цену или служат фундаментом для разворота. В отличие от стандартны
Astral Oscillators
Affissou Marthis Gislain Goncalves
Here is the English version of the product description, fully optimized and ready for your MQL5 listing: Astral Oscillator - HTF Zones, Multi-TF Structure & Astral Divergences Astral Oscillator is a comprehensive technical indicator for MetaTrader 5, designed for market structure and Price Action traders. It combines the analysis of supply and demand zones (H/L & S/R), multi-timeframe structure tracking (BOS / CHoCH), and an exclusive oscillator with an automated detection engine for regular and
MACD Color Histogram
German David Nino Cifuentes
5 (1)
Индикатор MACD Histogram - это обновленная версия индикатора MACD, разработанная для того, чтобы трейдерам было легче понимать рыночные тенденции и изменения импульса. В отличие от оригинального MACD, эта версия включает в себя гистограмму, которая представляет собой гистограмму, показывающую разницу между двумя линиями: линией MACD и сигнальной линией. Вот как это работает: когда линия MACD находится выше сигнальной линии, это предполагает бычий рынок, и столбцы гистограммы отображаются зеленым
RBreaker Gold Indicators — это краткосрочная внутридневная торговая стратегия для фьючерсов на золото, которая сочетает в себе два подхода: трендовое следование и внутридневные развороты. Она позволяет не только получать прибыль при трендовом движении, но и своевременно фиксировать прибыль при развороте рынка, открывая позиции в новом направлении. Данная стратегия на протяжении 15 лет подряд входила в десятку самых прибыльных торговых стратегий по версии американского журнала Futures Truth. Она
Follow The Line MT5
Oliver Gideon Amofa Appiah
4.6 (35)
This indicator obeys the popular maxim that: "THE TREND IS YOUR FRIEND" It paints a GREEN line for BUY and also paints a RED line for SELL. (you can change the colors). It gives alarms and alerts of all kinds. IT DOES NOT REPAINT and can be used for all currency pairs and timeframes. Yes, as easy and simple as that. Even a newbie can use it to make great and reliable trades. NB: For best results, get my other premium indicators for more powerful and reliable signals. Get them here: https://www.m
FREE
The   Trendlines Oscillator   helps traders identify trends and momentum based on the normalized distances between the current price and the most recently detected bullish and bearish trend lines. The indicator features bullish and bearish momentum, a signal line with crossings, and multiple smoothing options. USAGE The   Trendlines Oscillator   works by systematically: Identifying pivot highs and lows. Connecting pivots to form bullish (support) and bearish (resistance) trendlines. Measuring
Blahtech VWAP - Volume Weighted Average Price (VWAP) is the ratio of price to total volume. It provides an average price over a specified time interval.  Links [  Install  |  Update  |  Documentation   ] Feature Highlights Configurable VWAP Line Sessions, intervals, anchored or continuous Previous day settlement line Standard Deviation bands Alerts at bar close or real time Automatic Broker or Tick volumes Significantly reduced CPU usage Input Parameters Expert Advisor Mode  - Reserved for iCu
FREE
SuperTrend Signal Alerts is a free SuperTrend indicator for MetaTrader 5. It colours the trend line blue or red, puts a buy or sell arrow on every trend change and sends alerts, with optional EMA and RSI filters on the arrows. It places no trades and does not touch your orders. Arrows and alerts come from closed bars, so a signal never appears and then disappears. The calculation follows the SuperTrend indicator as published on TradingView. Standalone: everything is built in. You do not need to
FREE
Heiken_Ashi_Bars - Усовершенствованный визуализатор тренда для MT5 Обзор Heiken_Ashi_Bars — это мощный, визуально интуитивный пользовательский индикатор, разработанный для фильтрации рыночного шума и выделения истинного базового тренда. Традиционные свечные графики часто бывают хаотичными, что приводит к ложным сигналам и преждевременным выходам. Усредняя ценовые данные, этот индикатор сглаживает движение цены, что значительно облегчает обнаружение продолжения тренда, разворотов и прибыльных зо
Enhanced Elliott Wave Pro – Advanced Market Structure & Wave Analysis   Enhanced Elliott Wave Pro is a lightweight, institutional-grade MT5 indicator that eliminates chart clutter by detecting and displaying only the current, active market structure: the 1-2-3-4-5 Impulse wave and the subsequent A-B-C Correction.   Built with classic Prechter wave rules and ATR-adaptive pivot detection, it delivers clean, real-time wave counts without bogging down your terminal.   ――――――――――――――――――――――――――――
Description of the MonteCarloBands Indicator The   MonteCarloBands   indicator is a forward-looking analytical tool that employs the Monte Carlo method to project potential future price scenarios of a financial asset. It appears as a set of five percentile bands extending into the future, visualizing a "probability cone" based on the historical behavior of the market. Visual Appearance: P50 (Median) : Solid green line at the center, representing the expected median path P25 and P75 : Two orange
FREE
Caicai L&S Yield Histogram Important Notice: This indicator is an integral tool of the automated EA Caicai Long and Short Pair Trading . This indicator visually displays the percentage deviation (Yield %) of a pair's current spread relative to its own historical mean. It is an excellent tool for quickly visualizing the gross financial potential of a market distortion in Long & Short operations. Main Features: Percentage Visualization: Understand the size of the distortion in palpable percentage
HLC bar MT5 Wyckoff
Eduardo Da Costa Custodio Santos
Индикатор «HLC_bar_MT5 Wyckoff» для MT5 был создан для облегчения анализа во время торговли. Панель HLC использовалась Ричардом Вайкоффом и в настоящее время широко используется в операциях VSA. Вайкофф обнаружил, что использование максимума, минимума и закрытия сделало график намного чище и проще для анализа. Индикатор «HLC_bar_MT5 Wyckoff» позволяет: # Изменить ширину полосы; # Оставьте полосу того же цвета; # И выделите бар, который открывался и закрывался по одной цене. Цвета и ширина легко
CosmiCLab SMC FIBO CosmiCLab SMC FIBO — это профессиональный торговый индикатор, основанный на концепциях Smart Money Concepts (SMC), анализе структуры рынка и уровнях Fibonacci. Индикатор автоматически определяет свинги рынка и строит уровни Fibonacci по последнему импульсному движению. Также индикатор определяет ключевые изменения структуры рынка: BOS — Break Of Structure CHOCH — Change Of Character Дополнительно отображаются сигнальные стрелки BUY / SELL при пробое структуры. Индикатор подход
Развитие идей, заложенных в популярный индикатор MACD: Находит и наглядно отображает классические и обратные дивергенции (два способа обнаружения дивергенций). Выделяет на индикаторе разными цветами тренд вверх, вниз. Два метода определения тренда: а) MACD пересекает уровень 0 (классический сигнал); б) MACD пересекает свою среднюю (ранний сигнал). Индикатор мультитаймфреймовый - может показывать данные MACD других таймфреймов. Два способа отрисовки индикатора: классическая гистограмма и линия. З
VolumeBasedColorsBars — Free Powerful Volume Analysis for All Traders Unlock the hidden story behind every price bar! VolumeBasedColorsBars is a professional-grade, 100% FREE indicator that colorizes your chart candles based on real, adaptive volume analysis. Instantly spot surges in market activity, identify exhaustion, and catch the moves that matter. This indicator gives you:    • Dynamic color-coded bars for instant volume context    • Adaptive thresholds based on historical, session-awar
FREE
Зоны коррекции Фибоначчи последнего свинг-движения FibRetrace Zones: бесплатный визуальный помощник к советнику FibRetrace. Индикатор строит уровни коррекции Фибоначчи и выделяет зону отката на последнем свинг-движении, чтобы вы видели, где находятся входы на откате, ещё до сделки. Зона окрашивается по направлению: зелёная для бычьих сетапов, красная для медвежьих. Работает на любом символе и любом таймфрейме. ОСНОВНЫЕ ВОЗМОЖНОСТИ Автоматическое определение свингов с настраиваемым периодом Класс
FREE
Original MACD
Kirill Paskhin
4.88 (8)
Moving Average Convergence/Divergence — схождение/расхождение скользящих средних — технический индикатор, разработанный Джеральдом Аппелем (Gerald Appel), используемый в техническом анализе для проверки силы и направления тренда, а также определения разворотных точек. Встроенный в MetaTrader 5 индикатор MACD не соответствует задумке автора (Gerald Appel): -линия MACD графически изображена в виде гистограммы, однако гистограммой отражается разница между линией MACD и сигнальной линией;  -сигнальн
FREE
Why use it A simple, readable rule: the EA trades when the MACD and its signal line both cross the zero line. Every position gets a stop loss and a take profit when you set them. Daily gain and daily loss limits in money: when one is hit, the EA closes its positions and stops for the day. A trading-hours window, plus a clear message if the volume does not fit the symbol. How the rule works MACD is calculated on every tick and the EA keeps the last three values. When the latest MACD value is abo
FREE
С этим продуктом покупают
Trend Sniper X
Sarvarbek Abduvoxobov
4.86 (44)
Trend Sniper X — это трендовый индикатор для MetaTrader 5, работающий на нескольких таймфреймах, который помогает трейдерам точно и ясно определять направление тренда и потенциальные точки разворота. для MT4: https://www.mql5.com/en/market/product/193245 Информация о цене: Текущая цена является промо-ценой и может измениться по мере выхода предстоящих обновлений и новых функций. Бонусное предложение: Чтобы получить БЕСПЛАТНЫЙ авто-трейд советник Assistant EA для этого индикатора, пожалуйста, на
Новый король в городе — Индикатор + управление ордерами (TP1 + TP2 + TP3) + опциональный Telegram-сигнал-сендер ВКЛЮЧЁН (БЕСПЛАТНО) (ПОЛНОЦЕННАЯ ТОРГОВАЯ И СИГНАЛЬНАЯ СИСТЕМА) Gold Slayer EA Этот индикатор включает в себя продвинутую стратегию, торговую систему с настраиваемым управлением ордерами и систему mean reversion, которая сочетает расширения Envelope и поддерживается несколькими интеллектуальными фильтрами подтверждения, такими как RSI, для поиска высоковероятных точек разворота с сигн
Smart Trend Trading System — MetaTrader 5 После покупки напишите мне на MQL5, чтобы БЕСПЛАТНО получить Smart Universal Expert Advisor, а также доступ к онлайн-курсу, руководство в формате PDF и доступ к закрытой группе. STTS объединяет направление тренда, сигналы входа и выхода, зоны разворота и важные ценовые уровни прямо на графике. Торгуйте по системе вручную или подключите отдельный совместимый советник для автоматического исполнения с выбранными вами настройками. ОДНА СИСТЕМА. ЧЕТЫРЕ ТОРГОВ
Entry Points Pro показывает, где входить, где ставить стоп и каким лотом торговать — до того, как вы поставите ордер. ЦЕНА Сейчас 199 USD: 8 копий по этой цене, затем 249 USD. Финальная цена — 349 USD. Я зарабатываю торговлей на рынке и показываю это, поэтому мне не нужно продавать этот индикатор всем подряд. Это инструмент для трейдеров, которые думают своей головой, а не волшебная кнопка. Нет пробоя — нет сделки. Серая стрелка — отменённый сигнал: цена не пробила сигнальную свечу, значит, н
Получите своё торговое преимущество в поле зрения! M5 Sniper — это новый индикатор от MeanFX. Он сочетает точные торговые сигналы с адаптивными уровнями TP/SL — в результате создавая лучшие возможные статистические сделки! Цена увеличивается каждые 5 покупок, следующая цена — 69$ Напишите мне после покупки, чтобы получить советы/руководство и бонусного EA Что выделяет его среди других? Проверенная статистическая эффективность на Gold XAUUSD ( работает практически на каждом активе , с акцентом н
Zoryk Gold
Reda El Koutbane
4.79 (19)
Скидка заканчивается через 24 часа — следующая цена $ 69 ZORYK — продвинутая сигнальная система для XAUUSD в MetaTrader 5 Вам знакомо это чувство. Вы долго анализируете золото. Ждёте подходящего момента для входа. Наконец открываете сделку — и цена сразу начинает двигаться против вас. Вы закрываете позицию слишком рано, передвигаете Stop Loss или сомневаетесь всего несколько секунд. После этого рынок достигает именно той цели, которую вы ожидали изначально, но уже без вас. Проблема не всегда за
ULTRA - это технический индикатор, который который работает по принципу “Все включено” - самостоятельно анализирует рынок, дает торговые сигналы, показывает уровни для установки стоп лосс, а также подсказывает когда нужно закрывать сделки, чтобы получить профит или минимизировать убыток. То есть, не важно, что ты не умеешь анализировать рынок, определять уровни - где поставить SL или плохо совладаешь с мани-менеджментом. ULTRA все это сделает вместо тебя! БОНУС ДЛЯ ПОКУПАТЕЛЯ : После покупки ULT
Gann Made Easy   - это профессиональная, но при этом очень простая в применении Форекс система, основанная на лучших принципах торговли по методам господина У.Д. Ганна. Индикатор дает точные BUY/SELL сигналы, включающие в себя уровни Stop Loss и Take Profit. ПОЖАЛУЙСТА, СВЯЖИТЕСЬ СО МНОЙ ПОСЛЕ ПОКУПКИ, ЧТОБЫ ПОЛУЧИТЬ ТОРГОВЫЕ ИНСТРУКЦИИ И ОТЛИЧНЫЕ ДОПОЛНИТЕЛЬНЫЕ ИНДИКАТОРЫ БЕСПЛАТНО! Вероятно вы уже не раз слышали о торговли по методам Ганна. Как правило теория Ганна отпугивает от себя не только
SuperScalp Pro
Van Minh Nguyen
4.54 (37)
SuperScalp Pro - Professional Multi-Layer Confluence Scalping System SuperScalp Pro — это продвинутый индикатор для скальпинга, который расширяет возможности классического Supertrend с помощью нескольких интеллектуальных фильтров подтверждения. Он помогает выявлять торговые возможности Buy/Sell с более высокой вероятностью успеха и значительно сокращать количество ложных сигналов. Чёткие стрелки Buy и Sell отображаются непосредственно на графике вместе с автоматически рассчитываемыми в реальном
SMC Intraday Formula
VividMind Digital Solutions
5 (26)
Давайте сначала будем честны. Ни один индикатор сам по себе не сделает вас прибыльным. Если кто-то говорит вам обратное — он продаёт вам мечту. Любой индикатор, который показывает идеальные стрелки покупки/продажи, можно сделать безупречным — просто увеличьте нужный участок истории и сделайте скриншот успешных сделок. Мы так делать не будем. SMC Intraday Formula — это инструмент. Он считывает структуру рынка за вас, определяет зоны с наивысшей вероятностью движения цены и точно показывает, как
GoldenX Entry MT5
VividMind Digital Solutions
5 (17)
GoldenX Entry — это индикатор для MT5 с адаптивным алгоритмом Smart Entry Trend, системой оценки сигналов, детектором рыночных режимов и фильтром волатильности. Каждый сигнал включает рассчитанный уровень входа, три уровня Take-Profit (TP1, TP2, TP3) и уровень Stop-Loss. Он построен на нескольких аналитических слоях, предназначенных для адаптации к различным рыночным условиям, объединяя многоуровневую аналитическую систему со встроенным оптимизатором и системой статистического отслеживания. Инди
Gold Trend Coach MT5
Cristhian Alexander Gaibor Cuasquer
4.27 (11)
Сигналы на покупку и продажу по золоту (XAUUSD) для MetaTrader 5 без перерисовки. У каждого сигнала есть stop loss и три take profit. Фильтр Smart Money Concepts с BOS и CHoCH, чтобы вы торговали по структуре, а не против неё. Живой Ментор на панели ведёт вас на каждом шаге, от входа до TP3. И алерты прямо на телефон и в ваш собственный Telegram-канал. Это Gold Trend Coach. Больше никакой торговли в одиночку. БЕСПЛАТНЫЙ НАБОР ПОКУПАТЕЛЯ к вашей покупке: 1. Telegram Alert Bridge: ваши сигналы пр
Boba Analysis Suite
Trade Ready Solutions LLC
5 (2)
Boba Analysis Suite Boba Analysis Suite — аналитический индикатор для MetaTrader 5. Он объединяет структуру рынка, значимые ценовые зоны и общий рыночный контекст в одном представлении на графике. Индикатор разработан на основе практического опыта трейдера и наставника по трейдингу. Он помогает выстроить последовательный процесс анализа: оценивать направление рынка, определять важные уровни и рассматривать несколько таймфреймов в совокупности. Анализ с учётом контекста Значение отдельных сигнало
FX Power: Анализируйте силу валют для более эффективной торговли Обзор FX Power — это ваш незаменимый инструмент для понимания реальной силы валют и золота в любых рыночных условиях. Определяя сильные валюты для покупки и слабые для продажи, FX Power упрощает принятие торговых решений и выявляет высоковероятные возможности. Независимо от того, хотите ли вы следовать за трендами или предсказывать развороты с использованием экстремальных значений дельты, этот инструмент идеально адаптируется под
Azimuth Pro
Ottaviano De Cicco
5 (7)
Azimuth Pro V2: Синтетический фрактальный структурный анализ и подтверждённые входы для MT5 Обзор Azimuth Pro — многоуровневый индикатор свинговой структуры от Merkava Labs . Четыре вложенных уровня свингов, привязанный к свингам VWAP, определение ABC-паттернов, трёхтаймфреймная структурная фильтрация и подтверждённые входы на закрытой свече — один график, один рабочий процесс от микро-свингов до макро-циклов. Это не слепой сигнальный продукт. Это рабочий процесс, основанный на структуре, для т
FiboSniper Pro – Multi-Filter Fibonacci System with Auto SL/TP and Control Panel FiboSniper Pro — это технический индикатор, который объединяет динамические Fibonacci Envelopes с несколькими фильтрами подтверждения для формирования отборных сигналов Buy и Sell. Уровни Fibonacci рассчитываются на основе Moving Average и ATR, а затем фильтруются с помощью ADX, EMA, RSI, ATR, Volume, Time и структуры свечи. Индикатор отображает на графике автоматические уровни Stop Loss и Take Profit на основе ATR,
M1 SNIPER   — это простая в использовании торговая система. Это стрелочный индикатор, разработанный для тайм фрейма M1. Индикатор можно использовать как отдельную систему для скальпинга на тайм фрейме M1, а также как часть вашей существующей торговой системы. Хотя эта торговая система была разработана специально для торговли на M1, ее можно использовать и с другими тайм фреймами. Первоначально я разработал этот метод для торговли XAUUSD и BTCUSD. Но я считаю этот метод полезным и для торговли на
Apex Patterns PRO Купите индикатор — получите Expert Advisor на его основе БЕСПЛАТНО. Самооптимизирующаяся система анализа графических паттернов и пробоев Традиционные сканеры паттернов полагаются на фиксированные входные параметры, что часто приводит к снижению их эффективности при изменении рыночной волатильности и структуры. Apex Patterns PRO разработан для адаптации к меняющимся рыночным условиям, объединяя распознавание структурных графических паттернов, фильтрацию по моментуму и статистич
Sqn Max Indicator Sqn Max is an exclusive indicator to trade the market with high effectiveness. The indicator is based on price action, volatility and trend. This indicator is as simple as possible but not too simple. The indicator can generate alerts to ease the trading process. You don't have to stay all day in front of your screen. The indicator can be used with any class of assets and with any time frame. It is possible to achieve better results trading our list of selected assets. We achi
Adaptive Price Action Engine Купи индикатор — получи советник (EA) к нему бесплатно Самооптимизирующийся мульти-таймфреймовый анализ тренда и свечных моделей Рынок постоянно меняется — и не каждая модель Price Action имеет одинаковую ценность в разных рыночных режимах. Adaptive Price Action Engine создан для адаптации к изменяющимся рыночным условиям, объединяя трендовую структуру, мульти-таймфреймовый анализ, свечные модели и статистическую оптимизацию в единой аналитической системе. Два адапти
Atomic Analyst — MetaTrader 5 После покупки напишите мне на MQL5, чтобы БЕСПЛАТНО получить Smart Universal Expert Advisor, а также доступ к онлайн-курсу, руководство в формате PDF и доступ к закрытой группе. Atomic Analyst объединяет анализ ценового движения, направление тренда, сигналы входа и выхода, уровни Stop Loss и несколько уровней Take Profit прямо на графике. УВИДЬТЕ СИГНАЛ. ОЦЕНИТЕ ТОРГОВУЮ СИТУАЦИЮ. Atomic Analyst представляет результаты анализа в понятном визуальном виде: • Стрелки п
Следующее обновление — версия 2.52 уже скоро! [НОВОЕ] Приготовьтесь к 4 новым важным функциям, призванным улучшить ваш анализ рынка и торговый процесс. Мы выводим анализ рынка на новый уровень с помощью 4 новых функций, разработанных с учётом ваших потребностей в трейдинге. Представляем: 1. TRADE OVERVIEW DASHBOARD 2. CONFLUENCE AT ZONE 3. STRONG & WEAK HIGH/LOW 4. OTE 1. TRADE OVERVIEW DASHBOARD Панель, которая помогает легче понимать общую картину рынка, предоставляя рекомендации для поддержк
Каждый покупатель этого индикатора получает дополнительно Бесплатно: Авторскую утилиту "Bomber Utility", которая автоматически сопровождает каждю торговую операцию, устанавливает уровни Стоп Лосс и Тейк профит и закрывает сделки согласно правилам этой стратегии, Сет-файлы для настройки этого индикатора на различных активах, Сет-файлы для настройки Bomber Utility в режимы: "Минимум Риска", "Взвешенный Риск" и "Стратегия Выжидания", Пошаговый видео-мануал, который поможет вам быстро установить, н
Индикатор Tokyo Indicator обеспечивает наглядное представление о направлении тренда, потенциальных торговых сигналах и текущей рыночной ситуации. Его ступенчатая линия тренда с цветовой индикацией позволяет различать «бычьи» фазы (выделены синим цветом) и «медвежьи» фазы (выделены пурпурным цветом). Соответствующие стрелки указывают на возможные точки входа в рынок (покупку или продажу) при смене тренда. Встроенная информационная панель объединяет данные о текущем сигнале, рыночном настроении,
Power Candles V3 — самооптимизирующийся индикатор силы Power Candles V3 преобразует силу валюты и инструмента в готовый к использованию торговый план на каждом графике, к которому он прикреплен. Вместо того, чтобы просто раскрашивать свечи, он выполняет автоматическую оптимизацию в режиме реального времени в фоновом режиме и предоставляет вам оптимальные значения Stop Loss, Take Profit и порог сигнала для выбранного вами символа. Один клик — и все готово для реальной торговли: на графике появляю
Currency Strength Wizard   — очень мощный индикатор, предоставляющий вам комплексное решение для успешной торговли. Индикатор рассчитывает силу той или иной форекс-пары, используя данные всех валют на нескольких тайм фреймах. Эти данные представлены в виде простых в использовании индексов валют и линий силы валют, которые вы можете использовать, чтобы увидеть силу той или иной валюты. Все, что вам нужно, это прикрепить индикатор к графику, на котором вы хотите торговать, и индикатор покажет вам
Naked Forex Tweezer Pro Indicator Tweezer Pro Indicator is a pattern recognition indicator for Forex, Stocks, Indices, Futures, Commodities and Cryptos. The standard Tweezer is a two bar pattern. Our enhanced version is a multi-bar pattern. We filter the patterns for you so that you only get the     best and most effective patterns   and ignore the noise. The Tweezer pattern is a simple and effective pattern to trade. The strategy that comes with the Tweezer is based on price action. The Twe
Auto Optimized SpeedAngle — это система векторизации импульса институционального уровня, которая исключает подгонку под исторические данные (curve-fitting) за счет непрерывной форвард-оптимизации (Walk-Forward Optimization, WFO). Вместо того чтобы полагаться на статические входные параметры, которые теряют эффективность при смене рыночных режимов, индикатор динамически перекалибрует свои настройки, используя валидацию на вневыборочных данных (Out-of-Sample, OOS). Это гарантирует, что отображаемы
Smc Pro ToolKit
Talal N Z Aljarusha
5 (13)
SMC PRO TOOLKIT — SMART MONEY ANALYSIS & STRUCTURED TRADE PLANNING SMC Pro ToolKit is a professional Smart Money Concepts analysis workspace for MetaTrader 5. It combines market structure, multi-timeframe analysis, institutional price zones, setup evaluation, confirmation tools, volume context, alerts, and risk planning inside one organized chart environment. One workspace. Multiple layers of confirmation. One structured trading plan. OPEN COMPLETE USER GUIDE MULTI-CONDITION SETUP ENGINE At
Мультивалютный индикатор силы и импульса MT5 Dynamic Forex28 Navigator — развитие наших давно популярных индикаторов, объединяющее силу пяти в одном: Advanced Currency Strength28 Indicator (700 отзывов) Advanced Currency IMPULSE with ALERT (530 отзывов) Currency Strength EXOTICS GOLD Impulse with Alert CS28 Combo Signals (текущий бонус) Не нужно покупать четыре индикатора и ставить их на графики. Всё объединено в одном мощном индикаторе: сила 28 пар Forex, импульс рынка, который их ведёт, и опов
Другие продукты этого автора
A chart overlay indicator for traders who want a structured view of Smart Money Concepts, market structure shifts, order block patterns, fair value gaps, equal highs and lows, and key multi-timeframe price levels directly inside MetaTrader 5. BOS and CHoCH · Internal and Swing Structure · Order Block Finder · Input-Controlled FVG Colors · EQH and EQL · Premium and Discount Zones Product Overview SMC Price Action Patterns is designed to convert raw price action into a clear, visual market map. T
FREE
Professional account protection for prop-firm challenges and funded accounts. It monitors drawdown, open risk, news windows, trading sessions, manual trades, profit targets, and challenge progress in real time, then warns, locks, de-risks, deletes orders, or closes managed exposure according to your rules. Two draggable on-chart panels — Economic Calendar and Performance Stats — keep news planning and account analytics on the chart without leaving MT5. Built for Prop-Firm Traders This EA does no
VoidFlow IFVG Trade Assistant Pro is a manual-first MetaTrader 5 trading panel for Inverse Fair Value Gap (IFVG) setups. It finds fair value gaps, confirms when price closes through them, scores every setup from 0 to 100, draws a complete trade plan and lets you place the order with one click and one confirmation. Automatic entries are available as an option you switch on yourself. Video walk-through: see the video on this page. Free demo: download it and run it in the Strategy Tester (the demo
Overview SR Confluence Pro is a professional MetaTrader 5 indicator for support & resistance and chart pattern analysis. It combines dual S&R engines (high-volume box engine + multi-timeframe pivot engine), automatic detection of 16+ classic chart patterns , and a confluence scoring system that rates how closely price structure and S&R levels align. Every zone is back-tested on the chart history — touches, bounces, breaks, false breaks and bounce rate are combined into a 0–100 strength score — a
ICT Market Structure Pro ICT Market Structure Pro is a Smart Money Concepts / ICT trading tool designed to automatically draw the most important structural and liquidity elements directly on the chart. The indicator helps traders read price action through an institutional lens by mapping market structure shifts, liquidity pools, order blocks, imbalances, premium/discount zones, and key ICT session windows in one place. It supports both single-timeframe and multi-timeframe analysis modes, with a
Trade Assistant Risk Calculator is an all-in-one floating trading panel (Expert Advisor) designed for professional manual traders on MetaTrader 5. It combines Visual Chart Trading , Automatic Risk Calculation , and Advanced Position Management into a single, compact interface. Stop calculating lot sizes manually. Stop guessing your Risk:Reward ratio. Simply drag lines on the chart, and the EA calculates the exact lot size to match your risk percentage, equity, or money target. Important Notes Th
Trade Assistant Risk Calculator is an all-in-one floating trading panel Expert Advisor for MetaTrader 5, built for professional manual traders. It combines visual chart trading , automatic risk calculation , and advanced position management in one compact interface. Stop calculating lot sizes manually. Stop guessing your Risk:Reward ratio. Drag the planning lines on the chart and the EA calculates the exact lot size for your selected risk percentage, equity, fixed-money risk, or fixed-lot workfl
MT5 Indicator · All Markets · Non-Repainting Signals · Entry / SL / TP1-TP3 · MTF + Scanner Momentum Pulse colors every candle by the real momentum behind it, not by price alone. Each bar is scored on five dimensions and placed in one of nine strength states . On top of that you get buy/sell signals with Entry, Stop Loss and three Take Profit levels , a multi-timeframe bias dashboard , a multi-symbol scanner , a forward test of every past signal with win rate and profit factor, and a risk-based
Supertrend core · 11 click-to-toggle confirmation filters · Multi-timeframe trend dashboard · Entry / SL / TP1-TP3 levels · Higher-timeframe filter · Trend cloud · 5,000-bar performance simulation with profit factor & drawdown TrendGuard Pro is a professional-grade MT5 scalping indicator that fortifies every entry signal with up to 11 independent confirmation filters . False breakouts are systematically eliminated before an arrow ever appears on the chart, letting you trade only the highest-pro
ICT Market Structure EA ICT Market Structure EA trades fair value gaps in the direction of market structure, only inside the ICT Silver Bullet hours, and only when the H4 and D1 structure agree. One EA on one chart trades a whole portfolio — by default EURUSD, XAUUSD, USTEC and US500 . Its higher-timeframe context uses the same detection code as the indicator ICT Market Structure Pro (swings, BOS / CHoCH, order blocks, FVGs, premium / discount). The default portfolio and settings were checked wi
Price Action 10 Setups EA Price Action 10 Setups EA automates ten classic bar-by-bar price-action setups — the patterns that discretionary price-action traders consider the most reliable: major trend reversals, final flags, breakouts, High 2 / Low 2 pullbacks, wedges, channels, measured moves, trading-range reversals, opening reversals and magnet (breakout) tests. Every setup is a fully coded rule set with a precise entry, stop and target, so the EA trades the patterns the same way every time. O
MACD Divergence Radar EA MACD Divergence Radar EA trades MACD divergences automatically. It uses the same signal engine as the indicator MACD Divergence Radar Pro — price pivots compared with the MACD histogram (OsMA) or the MACD main line, regular and hidden divergences, bullish and bearish — and turns every freshly confirmed divergence into a trade with a stop beyond the divergence pivot and a fixed reward-to-risk target. One EA on one chart can trade a whole portfolio; by default EURUSD, GBPU
TrendGuard Pro Auto EA is a fully automated trend-following Expert Advisor built on the TrendGuard Pro signal engine. It enters when the Supertrend flips and the confirmation filters agree, protects every trade with an ATR stop loss, can bank profits in steps at TP1 / TP2 / TP3, lets winners run with an ATR trailing stop, and exits on the opposite signal. It trades the chart symbol, or a whole portfolio of symbols from one chart, and is controlled from an interactive on-chart dashboard. Signal e
Price Action 10 Setups Indicator Price Action 10 Setups Indicator finds ten classic bar-by-bar price-action setups on your chart and turns every one of them into a complete trade plan: entry, stop loss and target , drawn on the chart, tracked bar by bar and summarised in a modern dashboard with per-setup statistics, a multi-symbol scanner and alerts. The detection is the same code as in Price Action 10 Setups EA (the automated version on the MQL5 Market): the indicator shows a signal exactly whe
Momentum Pulse EA trades the signals of the Momentum Pulse indicator automatically. The complete Momentum Pulse signal engine is built into the EA: every closed bar is coloured in one of nine momentum states, and a change of state becomes a buy or sell signal with its own Entry, Stop Loss and three take-profit levels. The EA takes those trades with risk-based position sizing, banks profit in steps at TP1 / TP2 / TP3 and manages the rest with breakeven and an ATR trailing stop. One chart can trad
Harmonic patterns with an honest track record. The indicator finds Gartley, Bat, Alt Bat, Butterfly, Crab, Deep Crab, Shark, Cypher, 5-0 and AB=CD patterns on your chart and on dozens of symbols and timeframes at once, draws the XABCD shape with its Potential Reversal Zone (PRZ) and Fibonacci ratios, gives entry, stop loss and three targets, and shows how often each pattern actually worked on each symbol: PRZ hold rate, TP1 and TP2 hit rate and average result in R , measured with exactly the sam
Currency Strength Matrix measures the strength of the 8 major currencies from all 28 pairs , plus gold and any indices you add, and shows it three ways on one chart: a multi-timeframe heatmap (M5 to D1), strength lines in a sub-window, and an automatic strongest-vs-weakest pair picker . Click any cell or pair and the chart switches to it. Closed bars never repaint, and the indicator shows you how its own picks behaved on the history you have loaded. How strength is measured Each currency is comp
Bitcoin Trend Rider EA Bitcoin Trend Rider EA is a trend-following and volatility-breakout Expert Advisor for BTCUSD , ETHUSD and other crypto CFDs. It stays out of sideways and dead markets, enters only when a trend is confirmed, puts a hard ATR stop on every order and lets winning trends run with a chandelier trailing stop. No grid, no martingale, no averaging down, no hedging tricks. Everything is visible: every input is in the Inputs window, the ready-made setups are listed below, and the lo
Gold Edge Portfolio EA trades XAUUSD with six independent, simple strategies at the same time . Each engine has its own on/off switch, its own magic number and its own risk per trade, and every trade is placed with a hard stop loss . There is no grid, no martingale, no averaging and no hedging — one position per engine at most. What makes it different is transparency : a dashboard on the chart shows the live state and the real statistics of every engine — trades, win rate, profit factor, net pro
Session Breakout Portfolio EA A session-range breakout portfolio for gold, the Nikkei and the yen, traded from one chart. Every market has a quiet session and an active open. The EA builds the range in the quiet session (Asian range, pre-open or opening range), in the exchange's own time zone with automatic daylight saving, and trades the breakout at the active session open with OCO stop orders. One stop-protected trade per market per day. No grid, no martingale, no averaging. Default portfolio
Trend Signal Navigator – trend, signals, targets and honest statistics in one indicator Trend Signal Navigator is an all-in-one trend signal system for MetaTrader 5. It shows the trend direction and regime, gives confirmed non-repainting BUY/SELL signals with an adaptive stop loss and three take-profit targets , marks reversal zones and key levels, and measures how its own signals performed on your chart in a live statistics panel. No hidden rules: every number in the panel can be re-counted fro
EA Performance Ledger shows what every Expert Advisor on your account really earns. MetaTrader shows one balance for the whole account; when several EAs, manual trades and copied signals share it, you cannot see which one carries the account and which one drains it. The Ledger reads the account history, rebuilds every closed position and splits the results by EA, symbol, strategy tag, direction and manual vs automated trading, in one clear dashboard. Read-only. The Ledger never places, modifies
Local Trade Copier Pro copies trades between MetaTrader 5 terminals running on the same Windows PC or VPS . One EA, two modes: run it as Master on the account that trades and as Receiver on every account that should follow. Positions, pending orders, SL/TP changes, partial closes and closes are copied within a few hundred milliseconds including the broker's execution (median 333 ms in our live test), through the terminals' shared Common Files folder: no DLL, no internet connection, no extra soft
Currency Strength Matrix EA — Strength Exhaustion on all 28 FX pairs Currency Strength Matrix EA measures the strength of the 8 major currencies ( EUR, GBP, AUD, NZD, USD, CAD, CHF, JPY , optionally plus gold) from all 28 currency pairs on three timeframes, and trades the moment when the strongest and the weakest currency are stretched too far. It is the automated companion of our Currency Strength Matrix Pro indicator and uses the same strength engine. Attach it to one chart (any symbol, any ti
Turn your MT5 account into a signal channel. TradeCast posts every trade action of your account to up to three Telegram channels, groups or private chats: new trades, pending orders, stop-loss and take-profit changes, breakeven, partial and full closes with the result in money, pips and R , a chart screenshot, and daily, weekly and monthly performance summaries. Trades opened by hand, by any Expert Advisor or from the MT5 mobile app are all detected, because TradeCast watches the account itself.
Custom Charts Pro builds seconds charts (S1 … S3600, any value), Renko , Range bars and Tick charts as real MetaTrader 5 custom symbols, from your broker's real ticks . It fills the history first, then keeps every chart updated live, for as many symbols and chart types as you like, from one control panel. The generated charts are normal MT5 charts: your indicators, templates, drawings and Expert Advisors work on them, and so does the Strategy Tester . Chart types Seconds : bars of N seconds (S1,
EA Robustness Lab tells you whether an Expert Advisor's results are robust or overfitted. A good backtest is not proof: it can come from a lucky order of trades, a few outsized wins, costs that were too optimistic, parameters fitted to the past, or a market regime that is gone. The Lab takes the closed trades of a strategy, puts them through Monte Carlo, walk-forward, stability, regime and optimisation tests, compares live trading with the backtest, and sums it all up in one robustness score fro
Volume Profile OrderFlow Suite puts volume profiles, VWAP and tick order flow on one MetaTrader 5 chart, with one panel. It also measures how price actually reacted at the profile levels on your symbol, so you can see from your broker's own data whether a level has been worth watching. The panel always shows which data is used. Forex and CFD symbols in MT5 only have tick volume (the number of price changes), so on those symbols the buy/sell side is an estimate. Symbols with exchange trades use r
Bar Replay Simulator turns any MetaTrader 5 chart into a trading practice room. Pick a symbol and a date in the past, press Start , and the market is replayed bar by bar or tick by tick while you trade on a virtual account : market and pending orders, stop loss and take profit lines you can drag, partial close, break-even, statistics in R, a trade journal and a report. One Expert Advisor, one click: no second program, no setup steps. It never sends an order to your broker. A real replay: only th
Cointegration Pair Trading EA — market-neutral statistical arbitrage for MetaTrader 5 Trade the relationship, not the direction. Cointegration Pair Trading EA runs a portfolio of linked currency pairs from one chart. For every pair it measures the spread between the two symbols, tests whether that spread really mean-reverts, and when it stretches far enough it buys the cheap leg and sells the expensive leg at the same time. The position is closed when the spread returns to its mean. Statistics,
Фильтр:
Нет отзывов
Ответ на отзыв