Peak Trough Analysis Tool MT5
- Индикаторы
-
Young Ho Seo
 Harmonic Pattern Indicator - Repainting + Japanese Candlestick Pattern Scanner + Automatic Channel + Many more
https://www.mql5.com/en/market/product/4488 - Версия: 1.5
- Обновлено: 5 февраля 2020
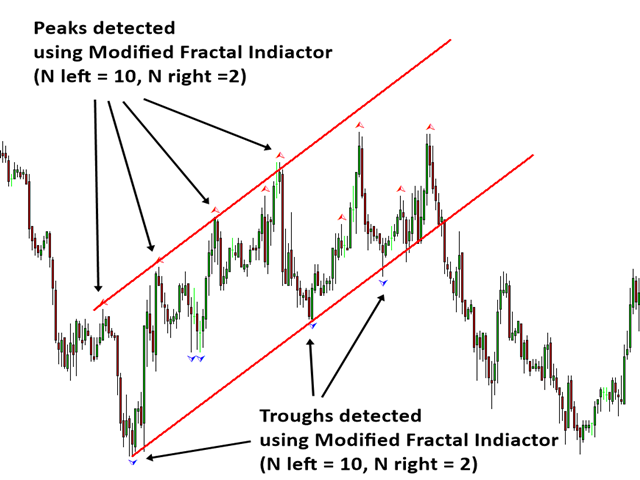
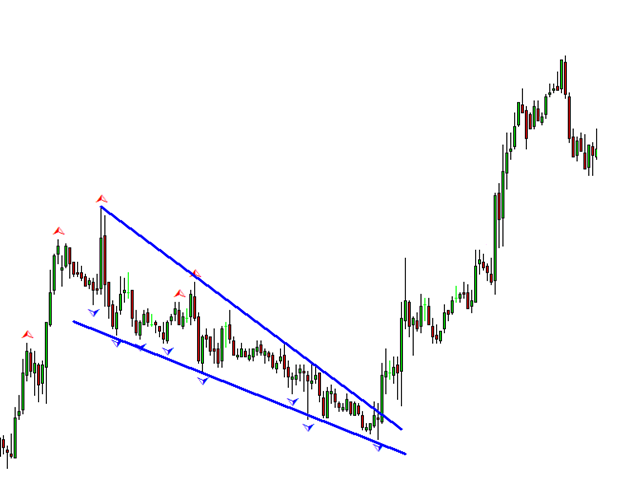
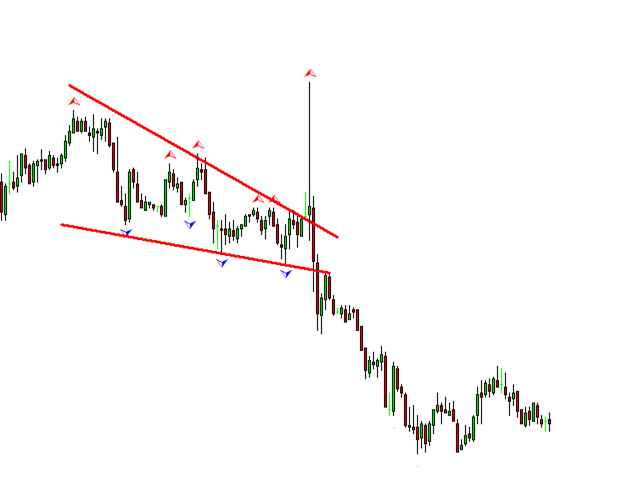
Peak Trough Analysis - отличный инструмент для обнаружения пиков и впадин на графике. Peak Trough Analysis может использовать три разных алгоритма обнаружения пиков и впадин. Эти три алгоритма включают в себя оригинальный индикатор Fractals Билла Вильямса, модифицированный индикатор Fractals и индикатор ZigZag. Вы можете использовать этот инструмент анализа пиков и впадин для обнаружения паттернов, составленных Равновесным Фрактально-Волновым процессом. Для дальнейшего использования имеется хорошее руководство по применению этого инструмента для анализа пиков и впадин в 11 главе книги "Introduction to Price Action and Pattern Trading" ("Введение в Price Action и торговлю по паттернам"). Это бесплатная утилита, вы можете использовать этот мощный инструмент в своих целях на свой страх и риск.
Инструкция по применению
Вы можете использовать его в трех режимах.
- Режим 1: индикатор Fractals Билла Вильямса
- Режим 2: Модифицированный индикатор Fractals
- Режим 3: индикатор Zig Zag
Для использования алгоритма на основе модифицированного индикатора Fractals установите “Use Modified Fractals” = true.
Для использования алгоритма на основе индикатора Zig Zag установите “Modified Fractals” = false.
Для использования алгоритма на основе оригинального индикатора Fractals Билла Вильямса установите “Use Modified Fractals” = true. Установите N left = N right = 2.
Входные параметры
1. Настройки модифицированного Fractals
- N left - N = количество баров, отсчитываемых влево
- N right - N = количество баров, отсчитываемых вправо
2. Настройки Zig Zag
Используйте настройки по умолчанию, если вы не знакомы с индикатором ZigZag.
- ZigZag Depth - глубина зигзага
- ZigZag Deviation - отклонение Зигзага
- ZigZag Backstep - количество баров в истории
3. Общие настройки
- Arrow Shift in Pixels - сдвиг стрелки в пикселях, по умолчанию 10
- Use White Background Chart - использовать белый фон графика, true/false
- Enable sound alert - включить звуковые оповещения, true/false
- Send email if peak or trough is found - отправлять оповещения по электронной почте при обнаружении пика или впадины, true/false
- Send notification if peak or trough is found - отправлять уведомления при обнаружении пика или впадины, true/false


The indicator is one of those hidden gems that does exactly what it promises—identify turning points in the market with clarity and flexibility. I love that it offers three different detection modes, which gives you the freedom to adapt the tool to your own strategy and timeframe. Yes, it does repaint (like most tools of this nature), but that’s not a dealbreaker—you’re not meant to trade it blindly. Used smartly, especially alongside other confirmation tools, it becomes a powerful filter to spot potential reversals, swing highs/lows, or wave structure formations. Setup is super easy, and the visual arrows make chart analysis clean and intuitive. For a free indicator, the value is outstanding. And if you’re into fractal-wave or price action pattern trading, this tool makes life so much easier. Whether you're a beginner trying to understand market swings, or a more advanced trader looking to fine-tune entries and exits, this indicator deserves a place in your toolbox. Simple, smart, and highly practical.