Multi TF Trend Dashboard

Multi-TF Trend Dashboard

Short Description / Slogan:

See the entire market trend in a single glance! A simple, clean, and powerful dashboard for every trader.

Full Description:

(1. For Free Distribution)

Hello MQL5 Community,

I am excited to share the Multi-TF Trend Dashboard, a tool I developed to simplify trend analysis. This indicator is offered completely free as a contribution to this amazing community.

(2. Indicator's Functionality)

Are you tired of constantly switching between timeframes to get a clear picture of the market's direction? The Multi-TF Trend Dashboard solves this problem by displaying a clean and intuitive panel directly on your chart.

This powerful utility allows you to instantly see the current trend across 9 key timeframes, from the 1-Minute (M1) chart all the way up to the Monthly (MN1) chart.

How it Works:

The logic is simple and classic. The indicator determines the trend by analyzing the slope of a Moving Average on each timeframe.

  • If the MA on the current bar is higher than the previous bar: Trend is UP (▲)

  • If the MA on the current bar is lower than the previous bar: Trend is DOWN (▼)

  • If the MA value is the same: Trend is FLAT (●)

This provides an immediate, at-a-glance overview of market momentum, helping you make more informed trading decisions.

Key Features:

  • Multi-Timeframe Analysis: Monitors 9 essential timeframes simultaneously (M1, M5, M15, M30, H1, H4, D1, W1, MN1).

  • Instant Visual Feedback: Uses clear and simple symbols for UP, DOWN, and FLAT trends.

  • Lightweight & Fast: Built with clean code that is light on your system's resources.

  • Fully Customizable: You can easily adjust the following settings to fit your trading style.

Indicator Inputs:

  • MA Period : The period for the Moving Average calculation.

  • MA Method : The type of Moving Average (EMA, SMA, etc.).

  • TF Text Color : The display color of the timeframe labels (M1, M5, etc.).

(3. How to Adjust Settings if TF Symbols are Not Visible)

IMPORTANT NOTE: If the dashboard panel is not visible on your chart, please follow these simple steps!

This issue is almost always caused by a chart setting that draws the price bars on top of indicator objects.

To fix this:

  1. Right-click on your chart.

  2. Select "Properties..." (or press the F8 key).

  3. Go to the "Common" tab.

  4. Find the option named "Chart on foreground" and UNCHECK the box next to it.

  5. Click OK.

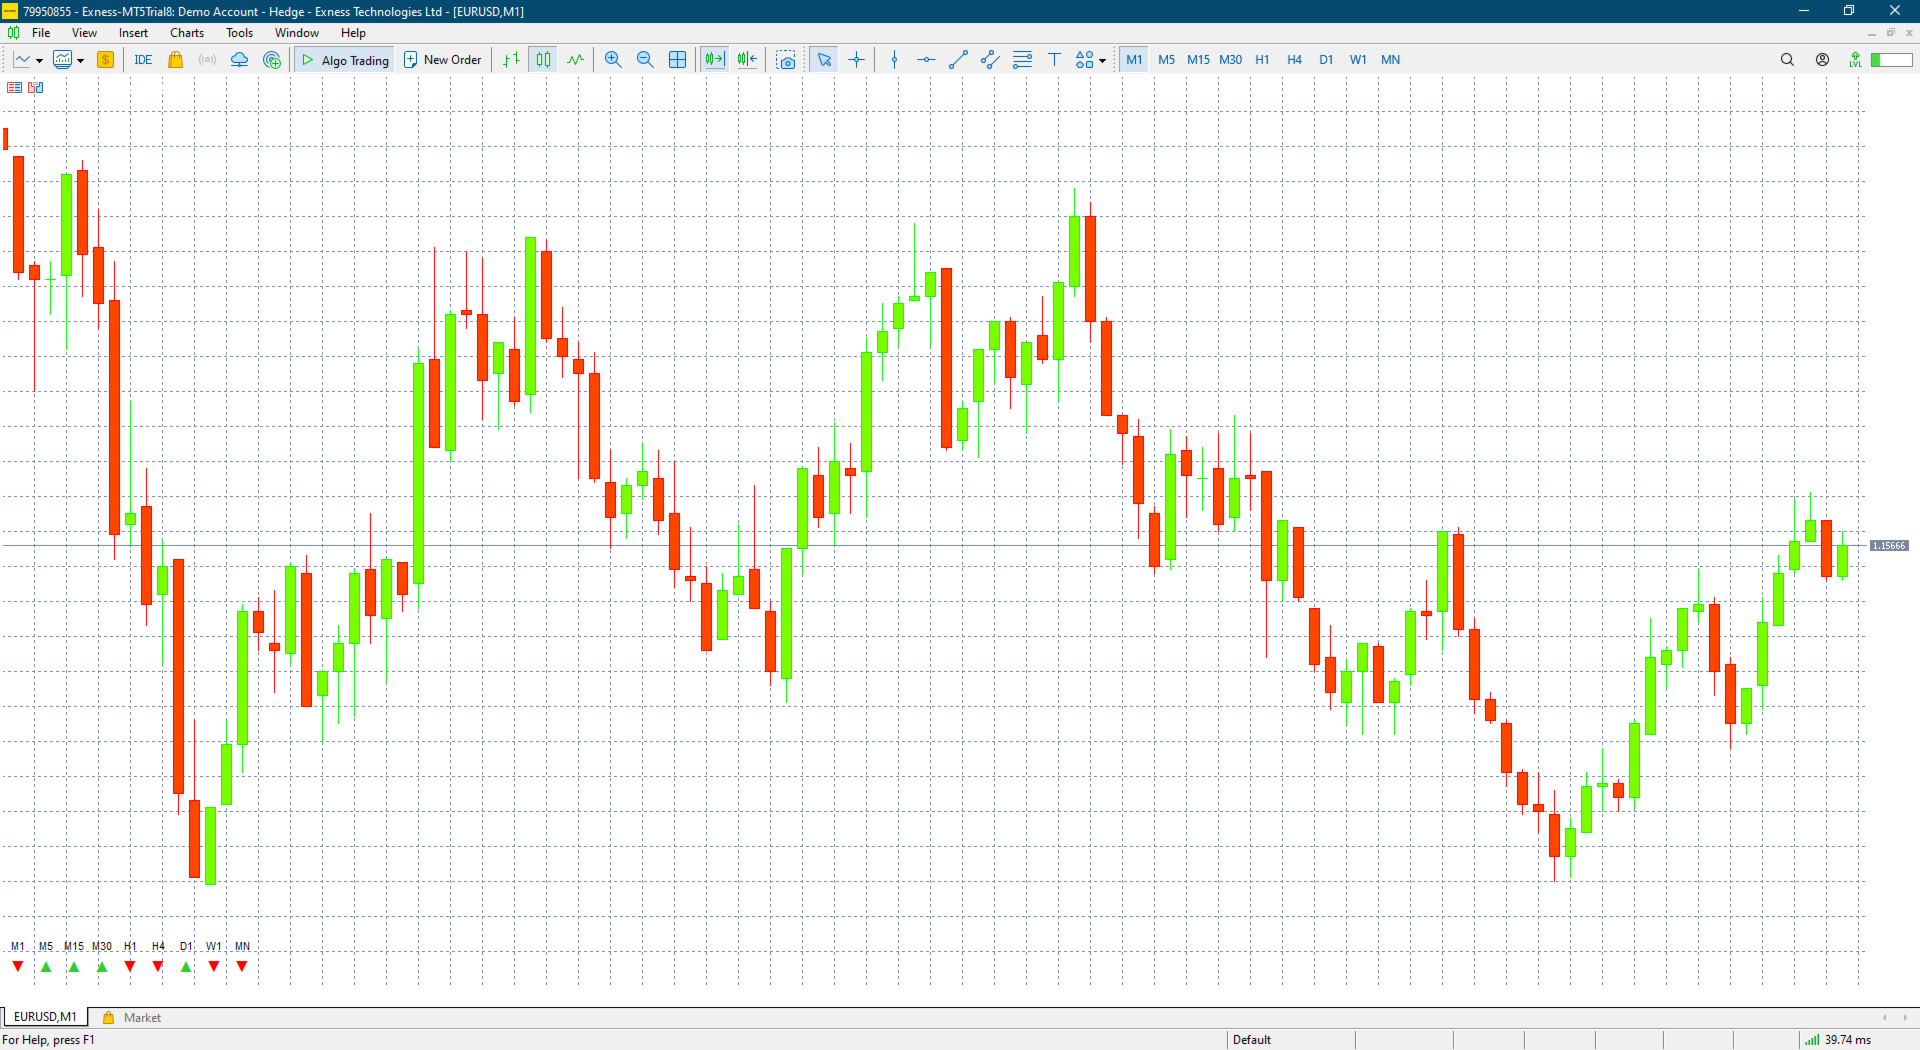
The dashboard should now be visible in the bottom-left corner of your chart.

(4. Please Leave a Review!)

As this is a free tool, your feedback is incredibly valuable for my development. Please consider leaving a review with your thoughts or suggestions for new features. Your input will help me improve this indicator and create better tools for the community in the future.

Thank you for your support!


Рекомендуем также
TilsonT3
Jonathan Pereira
5 (1)
Скользящая средняя Т3 Тиллсона была представлена ​​миру технического анализа в статье «Лучшая скользящая средняя», опубликованной в американском журнале Technical Analysis of Stock Commodities. Разработанный Тимом Тиллсоном, аналитики и трейдеры фьючерсных рынков вскоре увлеклись этой техникой, которая сглаживает ценовой ряд, уменьшая при этом лаг (лаг), типичный для систем следования за трендом.
FREE
Estratégia de negociação MACD O cálculo do MACD é executado uma vez a cada tick, e são considerados para fim de cálculo os três últimos resultados, para analisar o cruzamento da linha de zero, ou seja quando o último resultado for maior que 0 e o antepenúltimo não então há um cruzamento para cima e analogamente para baixo, quando um cruzamento é constatado o estado de uma variável de controle é alterado de "false" para "true", permitindo o abertura de uma posição caso a média de sinal também cru
FREE
This indicator uses a different approach from the previous version to get it's trendlines. This method is derived from Orchard Forex, and the process of making the indicator is demonstrated in there video   https://www.youtube.com/watch?v=mEaiurw56wY&t=1425s . The basic idea behind this indicator is it draws a   tangent line   on the highest levels and lowest levels of the bars used for calculation, while ensuring that the lines don't intersect with the bars in review (alittle confusing? I know
FREE
Daily HiLo
Nicanor Jr Cagape Layco
DailyHiLo Indicator Master the daily range like a pro. This indicator automatically plots the previous day’s high and low levels —a core element in the (Beat The Market Maker) trading approach—directly on your chart. These levels act as natural boundaries for intraday price action, helping traders identify potential reversal zones, breakout points, and liquidity targets. Key Features Accurate plotting of yesterday’s high and low for any symbol and timeframe. Works seamlessly with BTMM-inspired
FREE
TickChart Indicator plots tick line on the main window of MetaTrader. In the Lite version, the number of ticks is limited to 20 and the alert function described below is omitted.  The tick-line shows the most detailed, fastest and real-time activities of the market, which are usually hidden in bars or candles longer than 1 minute. Usually, several new tick-line segments appear while a bar of M1 time frame is completed. After the release of an important economic indicator, the number of ticks per
FREE
Slow RSI
Flavio Javier Jarabeck
4.8 (5)
For those who feel that regular RSI is too fast and too noisy to be used on regular trades or in EAs and want to have an alternative to meter the Momentum of the Price, here is a solution presented on the great article of the Technical Analysis of Stocks & Commodities magazine (April, 2015), by Vitali Apirine, called: Slow Relative Strenght Index . Its reading is almost the same as the regular RSI, but its levels of Overbought and Oversold are 80 and 20 instead. SRSI is very powerful to show div
FREE
Equidistant bands indicator with calculated moving average, allows you to configure the band size and can be used freely as an entry / exit indicator. Buffer 0 = price, buffer 1 = upper band, buffer 2 = lower band. you can also configure the periods of moving averages used in the calculations and also the shift to previous bars in addition to the price that can CLOSE (default) or OPEN. Excellent for fast daily moving pairs and frequent returns.
FREE
Rejection Zones
Paulo Henrique Faquineli Garcia
Este poderoso indicador analisa o gráfico e mostra zonas de Rejeição de Preços! Isto é, locais onde o preço foi, mas não foi aceito pelo mercado! A visualização desta zona de Rejeição, facilita o entendimento do trader na tomada de decisões de onde operar e como operar! O indicador é composto por 4 linhas, sendo classificadas em 2 grupos: Linhas Vermelha e Amarela: Denotam os extremos onde o preço conseguiu chegar, mas não foi aceito! Linhas Laranja e Azul: A partir delas, denotam o Início da z
FREE
EMA Multi Timeframe (MTF) – MT5 Indicator Description: The EMA Multi Timeframe (MTF) indicator for MT5 allows you to display an Exponential Moving Average (EMA) from a higher (or lower) timeframe directly on your current chart. Example: You can see the Daily (D1) EMA 9 plotted directly on your H1 chart, or even on an M5 chart, helping you align your entries with higher timeframe trends without switching between charts. Key Features: Display EMA from selectable timeframes (M1, M5, M15, M30, H1
FREE
LT Force
Thiago Duarte
5 (5)
For those who like trend the Force will be a very useful indicator. This is because it is based on the famouse ADX, which measure the strenght of a trend, but without its 3 confusing lines. Force has its very simple interpretation: if the histogram is above zero level the trend is up, otherwise it is down. You can use it to find divergences too, which is very profitable. Thanks to Andre Sens for the version 1.1 idea. If you have any doubt or suggestion, please, contact me. Enjoy! MT4 version: 
FREE
CoioteCandlePVA
Alexandre Moraes De Souza Lima
5 (1)
Candle com coloração de Volume Price Analysis  (VPA) segundo as definições da Anna Coulling, é possível configurar períodos de  climax e rising, fator de extreme e fator de rising. Pode-se usar volume real ou volume de ticks. O VPA considera a variação de preço por volume do período, indicando se um movimento está recebendo ignição, está em seu climax ou se já não existe mais interesse.
FREE
The MTF Support/Resistance & Trendline Analyzer is a powerful multi-timeframe indicator that automatically detects key support and resistance levels , draws dynamic trendlines , and provides a real-time market structure dashboard — all in one clean, lightweight display. It combines fractal logic and price action detection across three timeframes to give you a unified view of market direction and structure. Whether you trade reversals, breakouts, or trends, this tool highlights the zones that mat
FREE
Pinbar MT5
Nedyalka Zhelyazkova
Pin bar pattern   is characterized by a long upper or lower wick with a small body relative to the size of the wick with little to no lower or upper shadows. Pin bars are not to be traded in isolation , but need to be considered within the larger context of the chart analysis. A pin bar entry signal, in a trending market, can offer a very high-probability entry and a good risk to reward scenario. Inputs Multiplier ; AlertOn   - enable alerts; EmailAlert   - enable email alerts; PushAlert   - en
FREE
Nyse Usdxy
Mitchell Dean Ede
5 (1)
Displays a USD DXY chart in a seperate window below the main chart. YOUR BROKER MUST HAVE THESE SYMBOLS FOR THE INDICATOR TO WORK Based on EUR/USD, USD/JPY, GBP/USD, USD/CAD, USD/CHF and USD/SEK All these pairs must be added to Market Watch for the indicator to work correctly As this is calculated using a formula based on the 6 pairs it will only work when the market is open. YOUR BROKER MUST HAVE THESE SYMBOLS FOR THE INDICATOR TO WORK Displays a USD DXY chart in a seperate window below the m
FREE
Supertrend Line
Flavio Javier Jarabeck
4.87 (23)
The Supertrend indicator was originally created by a french fellow named Olivier Seban , and its goal is to identify the Primary Trend of prices . Its calculation is easy and based on the average of Highs and Lows and then we add the volatility of a custom period, plus a multiplier. This way we get the Supertrend Line. You can find in the web several approaches and trading strategies using this very useful indicator. HOW TO "READ" THIS INDICATOR If the closing prices are above Supertrend Line,
FREE
Color Trend
Bruno Goncalves Mascarenhas
Combining the best of Price Action , Directional Movement , and Divergence / Convergence analysis, the Candle Color Trend is the easy and reliable way to identify the direction of the trend. The indicator automatically paints the candles according to the premise that the upward trend is defined by prices that form a series of ascending tops and bottoms. On the other hand, the downward trend is defined by prices that form a series of descending tops and bottoms. Color Trend is certainly one of
FREE
Индикатор Magic EMA очень помогает в определении направления тренда. Он может стать отличным дополнением к вашей существующей стратегии или основой для новой. Мы, люди, можем принимать лучшие решения, когда лучше видим визуально. Поэтому мы разработали его, чтобы отображать разные цвета для восходящих и нисходящих трендов. Каждый может настроить это так, как ему больше всего подходит. Установив период тренда, мы можем оптимизировать его для более длинных или коротких трендов для нашей стратегии
FREE
The Graphic Alignment Context (GAC) Technical Indicator measures the vertical difference of the simple average price of a financial instrument in the context of three different timeframes determined by a defined number of bars or candles (periods) to determine the strength of the buy or sell trend. sale. Ascending average prices indicate Buying strength (1), Descending average prices indicate Selling strength (-1) and any scenario different from the previous two conditions indicates Neutrality
FREE
Ищет сильные движения цены и  по их завершении рисует уровни. Силу движения вы определяете самостоятельно, указав в настройках количество пунктов и количество свечей одинакового цвета подряд в одном направлении.  В настройках есть 2 типа построения:  extrenum - high/low close - цена закрытия Так же можно регулировать количество отображаемых уровней и число свечей для расчетов. По умолчанию в настройках указано 5 уровней для 360 свечей. То есть будет вычислено 5 уровней для сильных движений вверх
FREE
EA PRO Risk Panel — панель управления торговлей и риском для MetaTrader 5 Благодарности: Разработано Sayed Ali Ordibehesht и AliReza Asefpour. Кратко EA PRO Risk Panel помогает рассчитать риск, просматривать ордера на графике и исполнять рыночные и отложенные ордера с понятными настройками объёма, Stop Loss и Take Profit. Это не сигнальный сервис и не даёт гарантии прибыли. Функции >> Рыночные и отложенные ордера BUY/SELL по текущим Bid/Ask. BUY/SELL по отложке с перетаскиваемой линией входа
FREE
If you like to use traditional Moving Averages (like SMAs and EMAs) to provide your trades for dynamic levels of Support and Resistance, you will love the Adaptive Moving Average (AMA). Created in 1995 by Perry Kaufman and presented to the world in his book " Smarter   Trading :  Improving   Performance   in   Changing   Markets ", the Adaptive Moving Average (also known as KAMA - Kaufman Adaptive Moving Average) has the goal to be the perfect companion for following a trend without noise, but s
FREE
Crystal FVG Touch Detector – продвинутый индикатор концепции Smart Money Crystal FVG Touch Detector — это профессиональный индикатор, созданный для трейдеров, применяющих Smart Money Concepts (SMC) и методологию ICT. Он автоматически определяет Fair Value Gaps (FVG) на любом инструменте и таймфрейме, визуально отображая их цветными зонами и отмечая моменты касания. Благодаря нерисующему алгоритму и оптимизированной производительности, помогает выявлять институциональные дисбалансы в реальном вре
FREE
Добро пожаловать в индикатор Provlepsis "Provlepsis" - это высокоуровневый индикатор, разработанный для рынка MQL. Анализируя предыдущие бары в тот же самый час дня, он точно рассчитывает потенциальный диапазон движения рынка, предоставляя ценную информацию о будущих колебаниях цен. В отличие от традиционного индикатора ATR, "Provlepsis" учитывает фактор времени, что делает его более мощным инструментом, адаптирующимся к различным рыночным условиям. В ночное время индикатор предсказывает более у
FREE
Объем - широко используемый индикатор в техническом анализе, однако есть вариант, который даже более полезен, чем сам объем: скользящее среднее объема. Это не что иное, как скользящая средняя, ​​применяемая к популярному индикатору Volume. Как следует из названия, Volume + MA служит для отображения объема транзакций (совершенных покупок и продаж) определенного финансового актива в заданный момент времени вместе со скользящей средней этого же объема с течением времени. Для чего это? С помощью
FREE
CFN -  Multi MA & EMA Indicator for MT5 – with Alerts Take your chart analysis to the next level with the Multi MA & EMA Indicator for MetaTrader 5 – a versatile, efficient tool designed for traders who rely on Moving Averages and Exponential Moving Averages to interpret trends and make smarter trading decisions. Key Features: Supports up to 5 Moving Averages (MA) & 5 Exponential Moving Averages (EMA): Easily plot and manage up to 10 customizable averages directly on your MT5 charts.
FREE
Normal Parabolic SAR with label of long or short state. Tells also "Parabolic long" and "short". Can be used in multitimeframe layouts together with Swiss HolyGrail indicator or in different timeframes. So, if all the indicators show "long" or "short" you can be sure that the risk of a wrong direction is small. The standard values for Parabolic SAR are 0.02 for step and 0.2 for maximum. You may experiment with changing the maximum to get smother curves.  Note that changes in parabolic SAR are la
FREE
Inspired by the popular beat the market maker Multi MA. Now available for MT5 to be utilized. Multi Exponential Moving Average (Multi-EMA) Indicator for MT5 The Multi-EMA Indicator is designed to help traders visualize multiple exponential moving averages on one chart with precision and clarity. It plots five customizable EMA lines, each with distinct colors, making it easy to identify market trend direction, strength, and potential reversal zones at a glance. Key Features: Plots five indepen
Clean RSI Alerts
Silviu Madalin Clapa
5 (1)
This is a simple RSI indicator, but unlike the original one, it sends alerts when volume falls below the upper level or rises above the lower level, so you never miss a trading opportunity. Combined with support and resistance levels, it can provide strong entry opportunities into the market. I recommend keeping the levels as they are, i.e. 75 above and 25 below Check out my signal " PipStorm Invest ", save it to your favorites and  come back from time to time to check it again :)
FREE
Orderblock alerts
Favour Noguosatile Edobor
This is a simple Orderblock alert indicator. it alerts you once it spots a bullish or bearish OB. what you choose to do with the alert, is left to you. Feel free to test on demo before use. (I'll be working on a combo i.e this and an EA working side by side, anticipate) Bullish OB has a light blue color and bearish has a light red color (rectangle box drawn on chart). Please trade wisely and don't forget to leave a positive review. thanks More blues to you, and Happy Trading!
FREE
How the Sell Signal Works 1. Bollinger Band condition The current candle must close at or above the Upper Bollinger Band . This signals potential overbought conditions. 2. OBV confirmation (On Balance Volume) OBV must be falling → OBV_now < OBV_prev . Stronger confirmation: OBV decreasing for 2–3 consecutive bars. This shows that buying pressure is weakening . 3. ATR filter (Average True Range) Current ATR must be below its moving average (e.g., ATR_now < ATR_SMA(14) * 1.2 ). Purpose: avoid ente
FREE
С этим продуктом покупают
Каждый покупатель этого индикатора получает дополнительно Бесплатно: Авторскую утилиту "Bomber Utility", которая автоматически сопровождает каждю торговую операцию, устанавливает уровни Стоп Лосс и Тейк профит и закрывает сделки согласно правилам этой стратегии, Сет-файлы для настройки этого индикатора на различных активах, Сет-файлы для настройки Bomber Utility в режимы: "Минимум Риска", "Взвешенный Риск" и "Стратегия Выжидания", Пошаговый видео-мануал, который поможет вам быстро установить, на
Если вы покупаете этот индикатор, вы получите мой профессиональный Trade Manager + EA БЕСПЛАТНО. Прежде всего стоит подчеркнуть, что эта торговая система является индикатором без перерисовки, без повторной отрисовки и без задержки, что делает ее идеальной как для ручной, так и для роботизированной торговли. Онлайн курс, руководство и загрузка пресетов. «Smart Trend Trading System MT5» - это комплексное торговое решение, созданное для новичков и опытных трейдеров. Он объединяет более 10 премиаль
Gold Sniper Scalper Pro - Торговая Система для Золота (XAU/USD) на MetaTrader 5 Для серьезного трейдера: Подходите к торговле Золотом со структурированной, основанной на данных методологией, которая сочетает в себе несколько факторов рыночного анализа. Этот инструмент создан для поддержки вашего анализа торговли Золотом. Ограниченная Ценовая Возможность Это шанс приобрести Gold Sniper Scalper Pro до повышения цены. Цена продукта будет увеличиваться на $50 после каждых 10 последующих покупок. О
*** Entry In The Zone и SMC Multi Timeframe — это инструмент для анализа рынка в реальном времени, разработанный на основе концепции Smart Money Concepts (SMC). Мы разработали Entry In The Zone и SMC Multi Timeframe, чтобы помочь трейдерам анализировать рыночную структуру более систематично и ясно, с целью повышения эффективности торговли и создания долгосрочной устойчивости вашей стратегии. Этот инструмент основан на концепции Smart Money Concepts (SMC). Он автоматически анализирует точки разв
Smart Stop Indicator – Интеллектуальная точность стоп лоссов прямо на графике Обзор Smart Stop Indicator это специализированное решение для трейдеров, которые хотят устанавливать стоп лоссы чётко и методично, а не на интуитивной основе. Индикатор объединяет классическую логику прайс экшн (higher highs, lower lows) с современной системой распознавания пробоев, чтобы определить действительно логичный уровень стопа. В трендах, диапазонах или фазах резких движений он показывает оптимальные зоны SL
Прежде всего стоит подчеркнуть, что этот торговый индикатор не перерисовывается, не перерисовывает и не отставает, что делает его идеальным как для ручной, так и для роботизированной торговли. Руководство пользователя: настройки, вводы и стратегия. Атомный аналитик - это индикатор ценового действия PA, который использует силу и импульс цены, чтобы найти лучший край на рынке. Оборудованный расширенными фильтрами, которые помогают убирать шумы и ложные сигналы, и повышают торговый потенциал. Испо
FX Power: Анализируйте силу валют для более эффективной торговли Обзор FX Power — это ваш незаменимый инструмент для понимания реальной силы валют и золота в любых рыночных условиях. Определяя сильные валюты для покупки и слабые для продажи, FX Power упрощает принятие торговых решений и выявляет высоковероятные возможности. Независимо от того, хотите ли вы следовать за трендами или предсказывать развороты с использованием экстремальных значений дельты, этот инструмент идеально адаптируется под
Game Changer — это революционный трендовый индикатор, разработанный для использования с любым финансовым инструментом, который превратит ваш MetaTrader в мощный анализатор трендов. Индикатор не перерисовывается и не запаздывает. Он работает на любом таймфрейме и помогает определять тренд, сигнализирует о потенциальных разворотах, служит механизмом трейлинг-стопа и выдает оповещения в режиме реального времени для оперативной реакции рынка. Независимо от того, являетесь ли вы опытным трейдером, пр
Раскройте силу торговли трендами с помощью индикатора Trend Screener: вашего идеального решения для торговли трендами, основанного на нечеткой логике и мультивалютной системе! Повысьте уровень своей торговли по тренду с помощью Trend Screener, революционного индикатора тренда, основанного на нечеткой логике. Это мощный индикатор отслеживания тренда, который сочетает в себе более 13 инструментов и функций премиум-класса и 3 торговые стратегии, что делает его универсальным выбором для превращения
- Real price is 80$ - 45% Discount (It is 45$ now) Contact me for extra bonus   indicator, instruction or any questions! - Lifetime update free - Non-repaint - Related product: Gann Gold EA - I just sell my products in Elif Kaya Profile, any other websites are stolen old versions, So no any new updates or support. Advantages of  M1 Scalper Pro  Profitability: M1 Scalper Pro is highly profitable with a strict exit strategy. Frequent Opportunities: M1 Scalper Pro  takes advantage of numerous smal
Представляю Вам отличный технический индикатор GRABBER, который работает, как готовая торговая стратегия "Все включено"! В одном программном коде интегрированы мощные инструменты для технического анализа рынка, торговые сигналы (стрелки), функции алертов и Push уведомлений.  Каждый покупатель этого индикатора получает дополнительно БЕСПЛАТНО:  Grabber Утилиту для автоматического управления открытыми ордерами, Пошаговый видео-мануал : как установить, настроить и торговать, Авторские сет-файлы дл
Индикатор Trend Ai - отличный инструмент, который улучшит анализ рынка трейдером, сочетая идентификацию тренда с точками входа и предупреждениями о развороте. Этот индикатор позволяет пользователям уверенно и точно ориентироваться в сложностях рынка Форекс Помимо первичных сигналов, индикатор Trend Ai определяет вторичные точки входа, возникающие во время откатов или коррекций, позволяя трейдерам извлекать выгоду из коррекции цены в рамках установленного тренда. Важные преимущества: · Работае
Скринер поддержки и сопротивления находится в одном индикаторе уровня для MetaTrader, который предоставляет несколько инструментов внутри одного индикатора. Доступные инструменты: 1. Скринер структуры рынка. 2. Зона бычьего отката. 3. Зона медвежьего отката. 4. Ежедневные опорные точки 5. еженедельные опорные точки 6. ежемесячные опорные точки 7. Сильные поддержка и сопротивление, основанные на гармоническом паттерне и объеме. 8. Зоны уровня берега. ПРЕДЛОЖЕНИЕ ОГРАНИЧЕННОЕ ВРЕМЯ: Индикатор подд
FX Volume MT5
Daniel Stein
4.86 (21)
FX Volume: Оцените подлинную динамику рынка глазами брокера Краткий обзор Хотите вывести свою торговлю на новый уровень? FX Volume дает вам информацию в реальном времени о том, как розничные трейдеры и брокеры распределяют свои позиции — задолго до появления запаздывающих отчетов типа COT. Независимо от того, стремитесь ли вы к стабильной прибыли или ищете дополнительное преимущество на рынке, FX Volume поможет выявлять крупные дисбалансы, подтверждать пробои и совершенствовать управление риск
AriX
Temirlan Kdyrkhan
1 (4)
AriX Indicator for MT5 A powerful trend-following and signal-evaluation tool AriX is a custom MT5 indicator that combines Moving Averages and ATR-based risk/reward logic to generate clear buy/sell signals. It visualizes dynamic SL/TP levels, evaluates past trade outcomes, and displays win/loss statistics in a clean on-chart panel. Key features include: Buy/Sell signals based on MA crossovers ATR-based SL/TP1/TP2/TP3 levels with visual lines and labels Signal outcome tracking with real-time stat
FX Levels: Исключительно точные уровни поддержки и сопротивления для всех рынков Краткий обзор Ищете надежный способ определить уровни поддержки и сопротивления для любых инструментов—валют, индексов, акций или сырьевых товаров? FX Levels сочетает традиционный «Lighthouse» метод с современным динамическим подходом, обеспечивая почти универсальную точность. Благодаря сочетанию опыта реальных брокеров и автоматических ежедневных плюс «в реальном времени» обновлений, FX Levels поможет вам выявлят
FX Dynamic: Отслеживайте волатильность и тренды с помощью настраиваемого ATR-анализа Обзор FX Dynamic — это мощный инструмент, который использует расчёты среднего истинного диапазона (ATR) для предоставления трейдерам непревзойдённой информации о дневной и внутридневной волатильности. Настраивая понятные пороги волатильности (например, 80%, 100% и 130%), вы можете быстро определять потенциальные возможности для прибыли или получать предупреждения, когда рынок выходит за типичные рамки. FX Dyna
ARICoin is a powerful trading companion designed to generate high-probability entry signals with dynamic TP/SL/DP levels based on volatility. Built-in performance tracking shows win/loss stats, PP1/PP2 hits, and success rates all updated live. Key Features: Buy/Sell signals with adaptive volatility bands Real-time TP/SL/DP levels based on ATR Built-in MA Filter with optional ATR/StdDev volatility Performance stats panel (Success, Profit/Loss, PP1/PP2) Alerts via popup, sound, push, or email Cust
ARIScalp is a powerful trading companion designed to generate high-probability entry signals with dynamic TP/SL/DP levels based on volatility. Built-in performance tracking shows win/loss stats, PP1/PP2 hits, and success rates all updated live. Key Features: Buy/Sell signals with adaptive volatility bands Real-time TP/SL/DP levels based on ATR Built-in MA Filter with optional ATR/StdDev volatility Performance stats panel (Success, Profit/Loss, PP1/PP2) Alerts via popup, sound, push, or email Cus
Следующее поколение автоматизированных зон спроса и предложения. Новый инновационный алгоритм, работающий на любом графике. Все зоны создаются динамически в соответствии с ценовым действием рынка. ДВА ТИПА СИГНАЛОВ --> 1) ПРИ ПОПАДАНИИ ЦЕНЫ В ЗОНУ 2) ПРИ ФОРМИРОВАНИИ НОВОЙ ЗОНЫ Вы не получите еще один бесполезный индикатор. Вы получаете полную торговую стратегию с проверенными результатами.     Новые особенности:     Оповещения, когда цена достигает зоны спроса/предложения     Оповещения
Сколько раз вы покупали торговый индикатор с отличными бэк-тестами, подтверждением производительности на реальном счете с фантастическими цифрами и статистикой повсюду , но после использования в итоге сливали свой счет? Не стоит доверять только сигналу, необходимо знать, почему он появился в первую очередь, и это то, что RelicusRoad Pro делает лучше всего! Руководство пользователя + Стратегии + Обучающие видео + Приватная группа с VIP доступом + Доступна мобильная версия Новый взгляд на рынок
This indicator uses support and resistance, volume and some special formula to calculate the volume to filter the candles. If the volume reaches a specific value, And at the same time, Candle breaks the support/resistance line, There would be a signal and we can enter the market. Signals appear when the current candle closes. then you can enter the trade when a new candle appears. Please don't forget to follow your money management plan. MT4 Version Support/Resistance Breakout MT4 :   https:/
Shock Pullback
Suleiman Alhawamdah
5 (1)
Проще говоря, вы можете начать торговлю, когда рядом с текущей свечой начинают появляться белые цифры — так называемые «пипсы». Белые «пипсы» указывают на то, что сделка на покупку или продажу в данный момент активна и движется в правильном направлении, что обозначается их белым цветом. Когда движение белых пипсов прекращается и превращается в статичный зелёный цвет, это сигнализирует об окончании текущего импульса. Зелёный цвет цифр представляет собой общий заработанный профит в «пипсах», незав
SuperScalp Pro  — гибридный Supertrend-скальпер SuperScalp Pro расширяет классическую концепцию Supertrend, превращая её в гибридный инструмент для скальпинга, предназначенный для краткосрочных и среднесрочных сетапов на нескольких таймфреймах (M1–H1). Индикатор сочетает визуально понятную зону Supertrend с несколькими опциональными фильтрами подтверждения, обеспечивая входы с высокой вероятностью при простом управлении риском: уровни стоп-лосса и тейк-профита динамически рассчитываются по ATR и
Step into the world of Forex trading with confidence, clarity, and precision using Gold Indicator a next-generation tool engineered to take your trading performance to the next level. Whether you’re a seasoned professional or just beginning your journey in the currency markets, Gold Indicator equips you with powerful insights and help you trade smarter, not harder. Built on the proven synergy of three advanced indicators, Gold Indicator focuses exclusively on medium and long-term trends elimina
IX Power MT5
Daniel Stein
4.91 (11)
IX Power: Получите рыночные инсайты для индексов, сырьевых товаров, криптовалют и форекс Обзор IX Power — это универсальный инструмент для анализа силы индексов, сырьевых товаров, криптовалют и форекс. В то время как FX Power предлагает наивысшую точность для валютных пар, используя данные всех доступных пар, IX Power фокусируется исключительно на данных рынка базового символа. Это делает IX Power отличным выбором для некорреляционных рынков и надежным инструментом для форекса, если вам не нуж
Atbot
Zaha Feiz
4.62 (55)
AtBot: Как это работает и как его использовать ### Как это работает Индикатор "AtBot" для платформы MT5 генерирует сигналы на покупку и продажу, используя комбинацию инструментов технического анализа. Он интегрирует простую скользящую среднюю (SMA), экспоненциальную скользящую среднюю (EMA) и индекс средней истинной амплитуды (ATR) для выявления торговых возможностей. Кроме того, он может использовать свечи Heikin Ashi для повышения точности сигналов. Оставьте отзыв после покупки и получите спе
Gold Entry Sniper – Профессиональная Мульти-Таймфрейм ATR Панель для Скальпинга и Свинг-Трейдинга на Золоте Gold Entry Sniper — это передовой индикатор для MetaTrader 5, разработанный для точных сигналов на покупку/продажу по XAUUSD и другим инструментам. Основан на логике ATR Trailing Stop и мульти-таймфрейм анализе , этот инструмент идеально подходит как для скальперов, так и для среднесрочных трейдеров, обеспечивая чёткие точки входа с высокой вероятностью . Основные возможности и преимуществ
Trend Trading - это индикатор, предназначенный для получения максимальной прибыли от трендов, происходящих на рынке, путем определения времени отката и прорыва. Он находит торговые возможности, анализируя, что делает цена во время установленных тенденций. [ Руководство по установке | Руководство по обновлению | Устранение неполадок | FAQ | Все продукты ] Торгуйте на финансовых рынках с уверенностью и эффективностью Прибыль от устоявшихся тенденций без проволочек Признать прибыльные откаты, пр
Топовый индикатор МТ5, дающий сигналы для входа в сделки без перерисовки! Идеальные точки входа в сделки для  валют, крипты, металлов, акций, индексов !  Смотрите  видео  (6:22) с примером отработки всего одного сигнала, окупившего индикатор. Версия индикатора для MT4 Преимущества индикатора Сигналы на вход без перерисовки Если сигнал появился, он никуда НЕ исчезает! В отличие от индикаторов с перерисовкой, которые ведут к потере депозита, потому что могут показать сигнал, а потом убрать его. Б
Другие продукты этого автора
GridWeaverFX
Watcharapon Sangkaew
Introducing GridWeaverFX  - A Grid/Martingale EA for XAUUSD | Free Download! Hello, fellow traders of the MQL5 community! I am excited to share an Expert Advisor (EA) that I have developed and refined, and I'm making it available for everyone to use and build upon. It's called GridWeaverFX , and most importantly, it is completely FREE! This EA was designed to manage volatile market conditions using a well-known strategy, but with enhanced and clear safety features. It is particularly suited fo
FREE
Название продукта: Quantum Grid Matrix Краткое описание: Продвинутый экспертный советник, интеллектуально управляющий рынком с помощью динамической сеточной системы. Quantum Grid Matrix разработан для управления рыночными колебаниями путем создания расчетной сетки ордеров с целью получения прибыли от естественных колебаний цен. Полное описание: Управляйте ритмом рынка с помощью интеллектуальной сеточной торговли. Ищете стратегический инструмент, работающий методично и без эмоций? Quantum Gri
Фильтр:
Нет отзывов
Ответ на отзыв