Th3 BarPlay Signals Mt4

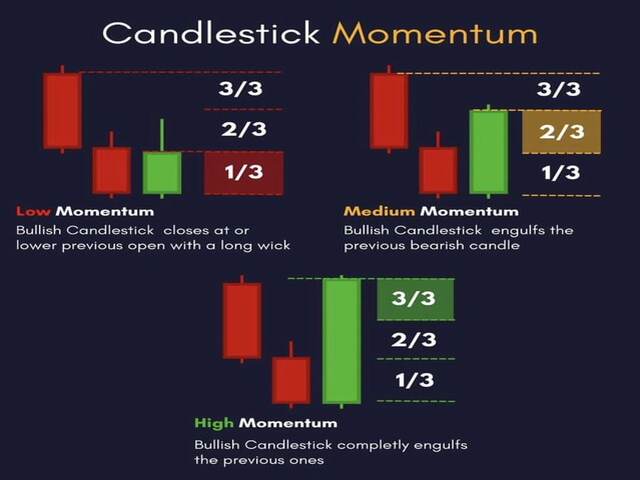
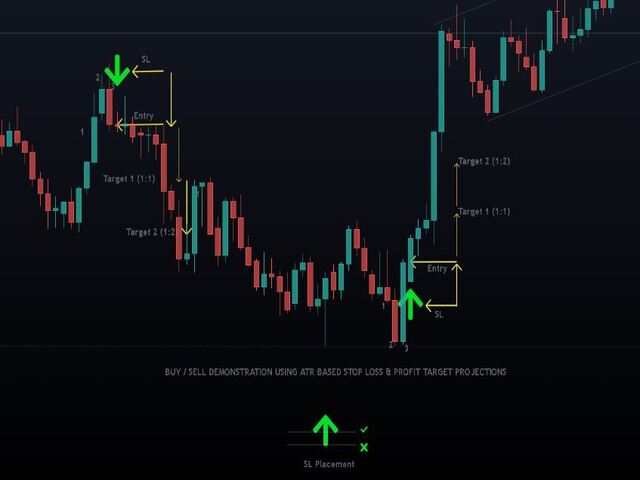
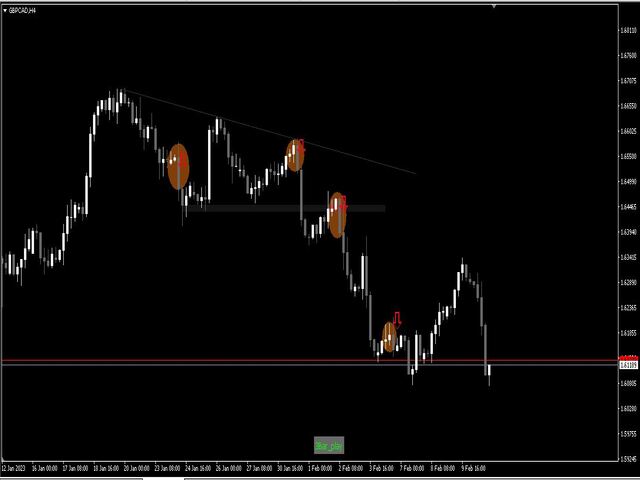
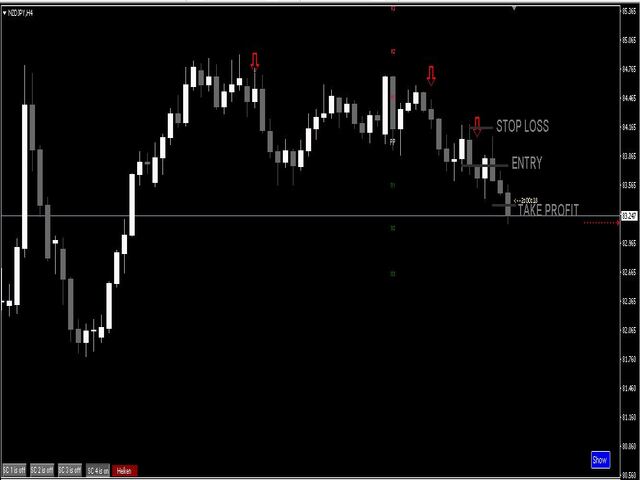
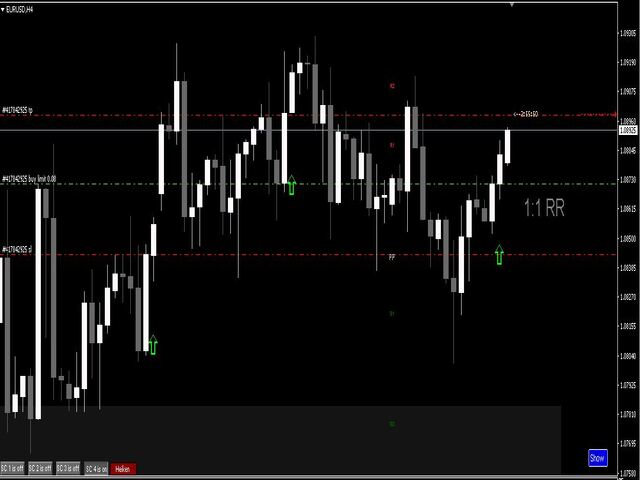
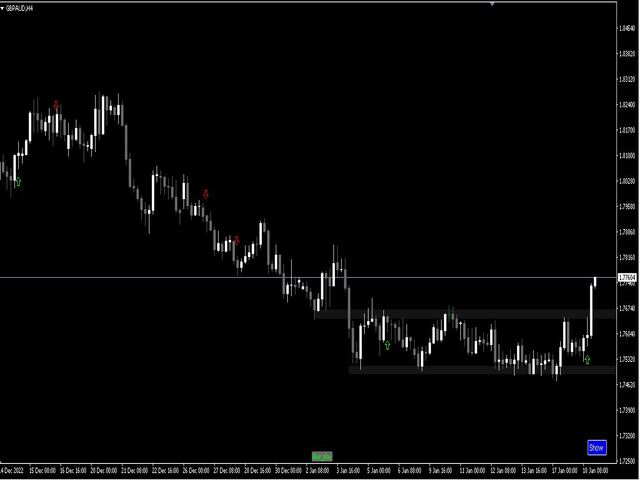
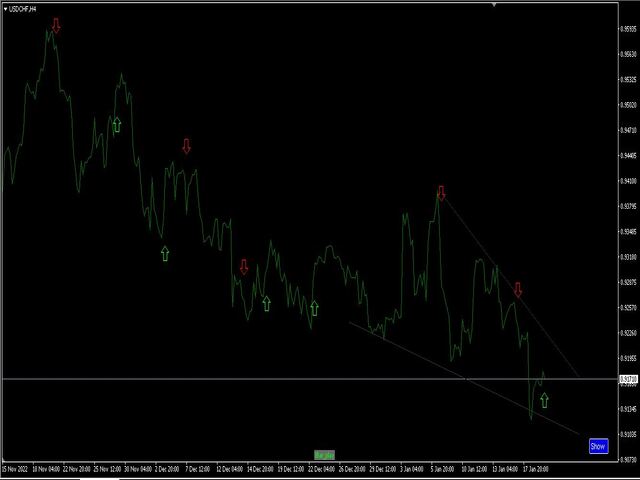
Esta é uma estratégia baseada em ação de preço conhecida como 3Bar_Play e é baseada na formação do padrão de velas 3Bar. Indicadores adicionais são adicionados para filtro e confirmações antes de aparecer as setas de sinal de compra/venda. Pode ser negociado em um mercado de tendência de alta, tendência de baixa ou lateral. Os indicadores adicionados incluem: Estocástico - Momento Fisher - Tendência ATR - Volatilidade que também define claramente a colocação de Stop-Loss na base da seta de sinal (usando o método ATR Stop-loss). Risco para Recompensa pode ser de 1:1 a 1:4 com um bom gerenciamento de risco. Compra - Quando o sinal de compra aparece após 2 barras de baixa e 1 barra de alta. Venda - Quando o sinal de venda aparece após 2 barras de alta e 1 barra de baixa. Recurso adicional Um botão de alternância para ligar/desligar os sinais no gráfico, mas não alerta. Parâmetros ajustáveis ​​no painel de configurações (configuração preferencial no download). Ative as notificações por e-mail/push para alertá-lo sobre sinais quando estiver longe da tela. Um indicador muito simples de usar e para todos os mercados. Instila disciplina e ajuda o trader a se concentrar no processo. Bom para novatos/traders lutando com posições de Stop Loss e Take Profit. Os comerciantes profissionais também não são uma exceção. suporte 24 horas. NB Se o indicador não aparecer na tela do gráfico, você precisará entrar em contato comigo e instalar o indicador de peixe personalizado.


Produtos recomendados
PTW NON REPAINT TRADING SYSTEM + HISTOGRAM Non-Repainting ,   Non-Redrawing   and   Non-Lagging  Trading System. Does the following: - Gives Accurate Entry and Exit Points - Scalping, Day and Swing Trading  - 95% Accuracy  - Targets, where to take profits. - Shows Trends, Support and resistance levels - Works on All Brokers - Works on All Currencies, CFDs and Stocks - It does not place trades for you, it only shows you what trades to place. - It works on All Timeframes - It is for Trend or ran
WARNING:    This indicator is powerful, very high probability, not based on publically available algorithms. It's a matrix of 10 different entries, from 10 other pairs, determined by a machine learning algorithm and wave analysis (Fourier Series) over 2 years. it can detect major buy and sell signals, as well as trendless, narrow range, hours on the 30minute and H1 chart (for scalping strategies during the usually trendless Asian session), scalping breakout risk is eliminated. It tells you if E
Unlock Smarter Trading with the Bands Breakout! Are you tired of confusing charts and missed opportunities? Get clear, high-probability entry and exit signals right on your chart with the Bands Breakout  indicator! This isn't just another indicator; it's a complete, trend-aware system designed to simplify your trading decisions and focus only on the best moves. Our unique engine combines the momentum power of the EMA 10 with the volatility framework of the Bollinger Bands to find definitive buy
FREE
on demo mode, use date for testing. for people purchase thise indicator, there is bonus ,price chanell and timing indicator  and tma  control periot and .complate trading system high low levels indicator is non repaint trend reversal indicator.and works all pairs and all timeframes. there is a histogram move up and down. and there is a level red and blue. when histogram reach the up red level that is top.and reversal is possible. when histogram down and reach blue level that is prices oversold a
Este indicador é um indicador para análise automática de ondas que é perfeito para negociações práticas! Caso... Nota:   Não estou acostumado a usar nomes ocidentais para classificação de ondas. Devido à influência da convenção de nomenclatura de Tang Lun (Tang Zhong Shuo Zen), nomeei a onda básica como   uma caneta   e a banda de onda secundária como   um segmento   . ao mesmo tempo, o segmento tem a direção da tendência.   O segmento de tendência principal   é nomeado (esse método de nomencl
BinaryIndi
Andrey Kravchenko
This is an arrow indicator for binary options. It does not redraw, arrows do not disappear. The indicator implements an optional tester for visual monitoring of the number of signal and win rate. Does not require adjustment or fitting. Works on all pairs and gold. The signal appears at the close of a candle. Entry is made on the next bar. Optional alert. For trading with robots, there is a setting for the number of bars in history. If 0, the entire history is used. The EA operation time: 24/5 Wo
The Strong Volume Trend  MT4 indicator is a powerful tool designed to help traders identify and capitalize on significant volume trends in the financial markets. With its advanced algorithm, this indicator accurately detects the strength and direction of volume movements, allowing traders to make informed trading decisions. Features: Volume Strength Analysis: The indicator analyzes the volume data and identifies strong volume trends, helping traders spot potential market reversals, breakouts, or
Using multiple timeframes for analysis with Multi Timeframe Average Directional Index  can provide several significant benefits for traders: Comprehensive Market View: By applying Mtf ADX Standard across different timeframes, traders gain a broader perspective on market dynamics. This allows them to identify trends, patterns, and potential reversal points that might be more apparent or consistent across various scales. Enhanced Pattern Recognition: Multiple timeframes help in identifying repeati
FREE
What is the Super Ichi Indicator? Super Ichi is an advanced combination of Ichimoku Kinko Hyo and SuperTrend indicators. This powerful technical analysis tool is designed to identify market trends and generate trading signals. What Does It Do? Dual-Level Trend Analysis : Uses customized versions of Tenkan-sen and Kijun-sen lines Automatic Signal Generation : Displays visual markers (arrows) at crossover points Real-Time Alert System : Provides audio and visual alerts when new signals occur Dynam
FREE
Reversal Overlap Bot is an automated trading strategy. No technical indicators are used in the work. At the beginning of trading, the first order is placed in a certain direction (at your option). When you open a new candle, this order is closed if it is in profit. Otherwise, the next order opens in the opposite direction. Orders are closed when profit is reached. If there are unprofitable orders on the chart, the robot will close one of them. When closing loss-making orders, the profit covers t
Accumulated Rsi
Muhammed Emin Ugur
Introducing the Accumulated RSI,  your ultimate tool for precise trend identification and momentum analysis in the world of Forex and financial markets. This cutting-edge MetaTrader 4 (MT4) indicator, designed for traders seeking unparalleled insight and accuracy, empowers you to make well-informed trading decisions like never before. Features Accurate Trend Detection: The Accumulated RSI utilizes the Relative Strength Index (RSI) in an innovative way to pinpoint the prevailing market trends wit
Trend surfer is indicator based on volume calculation in combination with algorithm that recognize trend changes . For aditional filtering, user can choose from 3 different oscillators, or can use their combination. Basic idea of indicator is to give signal when current volume is above value defined as Volume MA period*Volume MA multiplier, and trend change algorithm detects start of new trend wave. When all conditions are met and new trend wave is detected, indicator plot arrow on chart. Arrows
Desenvolvi metodos para negociacao coletados em um indicador. Na forma de setas, define entradas na direcao da tendencia. Possui 2 tipos de setas - guias de tendencia e de sinal, informando sobre o movimento potencial na direcao da tendencia. Funciona sem redesenho, pronto para uso em todos os simbolos/ferramentas. Os prazos mais adequados para usar sao M15, M30, H1, H4. Como usar O indicador encontra a direcao da tendencia na forma de uma seta de sinal, um retangulo grafico se estende ao long
Note : The slow loading of the indicator issue has been addressed . This new version loads fast and does not slow the platform. Version 1.3 : We have updated the indicator to include an historical bar scanning option . So instead of scanning all bars in the history (which can make the indicator slow sometimes ) , you can select the maximum number of bars it can scan which can increase the performance and make the indicator faster. This indicator scans the 1-3 Trendline pattern . The indicato
Some informations on the chart with the single attachment. RangeBorder Buy Sell (RBBS) Non Repaint Indicator will provide trend line, buy sell arrows,reversal arrows, range channel, order exit area,high average price line and low average price line.All arrows and lines don't repaint and not lagging. Once candle closed it won't  repaint. Reading Indicator: 1. Small Stars , Indicates oversold and overbought with certain logic and price may reverse when this small star triggers. Useful to identify
SFO Trend Racer
Tevin Marshall
5 (1)
SFO Trend Racer system is a trend indicator created by the CEO and Founder of " Simple Forex Options ", Tevin Marshall . It serves 6 different functions all in one. It shows the trader the entry signals as well as exit signals, whether it is a take profit or a stop loss. It also uses trend filters and signal confirmations so that the trader is able to make the most logically fit decision. Trend Racer uses various filters and specific settings from a plethora of indicators. The beauty in this ind
Um indicador técnico que estrutura gráficos e identifica movimentos cíclicos de preços. Pode funcionar em qualquer gráfico. Vários tipos de notificações. Existem setas adicionais no próprio gráfico. Sem redesenhar a história, trabalha no fecho da vela. TF recomendado a partir de M5 e superior. Parâmetros fáceis de utilizar e configurar. Ao utilizar 2 indicadores com parâmetros diferentes, pode utilizá-los sem outros indicadores. Tem 2 parâmetros de entrada Ciclicidade e duração do sinal Estes
O indicador MT4 "Binary Smart Eye" foi projetado para fornecer sinais de negociação tanto para opções binárias quanto para mercados Forex, operando em uma ampla gama de prazos, de M1 a W1. Ele emprega uma estratégia proprietária que combina níveis de tendência, uma média móvel inteligente e períodos de negociação otimizados para identificar potenciais pontos de entrada. Aqui está um detalhamento de suas principais características: Análise de Múltiplos Prazos: A versatilidade do indicador permite
ADR/AWR/AMR Lines Indicator - Professional Range Boundary Display Advanced Multi-Timeframe Range Analysis Tool for Professional Traders Overview The ADR/AWR/AMR Lines Indicator is a sophisticated visual analysis tool that displays dynamic range boundaries across multiple timeframes on your chart. This professional-grade indicator calculates and projects Average Daily Range (ADR), Average Weekly Range (AWR), and Average Monthly Range (AMR) boundaries, providing traders with precise entry/exit l
The indicator is like a mother-in-law, who talks often, talks a lot and often inappropriately. The indicator, in addition to giving us an entry signal on parameters which I will then list, monitors the trend of the hourly timeframe, OSMA to understand the entry direction, RSI to sense any overbought or oversold conditions from which to abstain, ATR for the volatility and ADX for the trend. Indicator not recommended for newbies. Only the human judgment of these parameters, combined with the entr
Scalping arrows not redraw - an indicator that shows price reversal points on the chart and does not redraw its signals. Also, the indicator sends signals to the trader via Email and Push. The accuracy of the signals of this indicator is approximately 92-94% on the M5 timeframe and more than 95% on the H1 timeframe. Thus, this indicator allows the trader to accurately open trades and predict further price movement. Price reversal points on the chart are indicated using simple and understandable
KT Candlestick Patterns Scanner is a Multi-Symbol and Multi-Timeframe scanner that fetches and shows various candlestick patterns on 28 currency pairs and 9 time-frames concurrently . The scanner finds the candlestick patterns by loading the KT Candlestick Patterns indicator as a resource in the background. Features The scanner can find the candlestick patterns on 252* combinations of symbols and time-frames from a single chart. Open the signal's chart loaded with a predefined template with a s
Yawabeh SD Pro –  Professional Supply and Demand Indicator Trade Smarter with Volume-Confirmed Supply/Demand Zones Our institutional-grade algorithm identifies high-probability reversal zones before price reacts, giving you the edge in Forex, Crypto, and Stocks. Key Features Multi-Timeframe Confirmation – View trend strength across multiple timeframes simultaneously – Align your trades with higher timeframe momentum Smart Alert System – Real-time notifications for: – Strong demand/supply zone
BinaryMartini
Abdulkarim Karazon
um indicador para negociação binária baseado no cruzamento 3ma com macd, fornece sinais de compra e venda na barra aberta e não repinta ou retrocede o indicador não está focado na alta taxa de ganhos, pois é feito para negociação de martingale, o indicador se concentra na menor contagem de sinais de perda consecutiva. Estratégia : O depósito mínimo é 1.000 unidades, iniciamos a negociação com 1 unidade (o tamanho da negociação é 1 unidade para cada 1.000 capitais) dobramos o tamanho da negociaçã
Altopium Trend is an indicator that identifies short-term trends. The signals it generates can be used to open long or short positions or can be integrated with other indicators/strategies. This is a trend indicator, be careful during narrow sideways phases. I recommend using it as a short-term trend indicator, complemented by other indicators that show the best times to enter the market. Wait for the bar to close to confirm the signal.
FREE
The indicator sends messages to e-mail and mobile terminal when the price approaches the horizontal levels and trend lines that are drawn using the handy panel! The levels and trend lines are deleted and placed to the chart using one click on the panel, and they can be dragged on the chart by mouse! It is possible to set the interval between messages in the settings, the interval is applied to each object separately! Indicator Settings ===*** Main settings ***=== - below is the list of the main
This is a simple PriceTMA bands, non repaint! it can be used for a trend following system or sometimes reversals. as a main signal or a filter for others strategies, it depends on the trader main strategy. calculations for this indicator are a combined Algorithm between moving averages "MA" and average true range"ATR". good luck with your trading! i hope it is helpful Cheers
Impulse fractals indicator - is counter-trend oriented complex market fractal pattern.  Market creates bull/bear impulse, trend starts, fractals on impulsed wave are an agressive pullback signals. Buy arrow is plotted when market is bearish and it's impulse showed up-side fractal, and sell arrow is plotted when market is bullish and it's impulse showed dn-side fractal. Main indicator's adjustable inputs : impulsePeriod - main period of impulse histogram  filterPeriod  - smoothes impulse accordi
MACD Alerts MT4
KEENBASE SOFTWARE SOLUTIONS
KT MACD Alerts é uma implementação personalizada do indicador MACD padrão disponível no MetaTrader. Ele fornece alertas e também desenha linhas verticais quando ocorrem os seguintes dois eventos: Quando o MACD cruza acima da linha zero. Quando o MACD cruza abaixo da linha zero. Recursos Possui um scanner MTF embutido que exibe a direção do MACD em todos os períodos de tempo.  Uma escolha ideal para traders que operam com base nos cruzamentos do MACD com a linha zero. Além de alertas, desenha li
Never miss a price breakout again with the   Price Alert Line Indicator . This tool is designed for traders who need speed and simplicity. Instead of navigating complex menus to set price alerts, the   Price Alert Line Indicator  places a button directly on your chart. With a single click, you can deploy a horizontal line that monitors price action and alerts you immediately when the price crosses it. Key Features: - One-Click Deployment:   A convenient button allows you to instantly draw or d
Os compradores deste produto também adquirem
Indicador Miraculous – Ferramenta 100% Não Repintável para Forex e Opções Binárias Baseada no Quadrado de Nove de Gann Este vídeo apresenta o Indicador Miraculous , uma ferramenta de negociação altamente precisa e poderosa, desenvolvida especificamente para traders de Forex e Opções Binárias . O que torna este indicador único é a sua base no lendário Quadrado de Nove de Gann e na Lei da Vibração de Gann , tornando-o uma das ferramentas de previsão mais precisas disponíveis na negociação moderna.
BinaryIndicator
Andrey Spiridonov
BinaryIndicator is a highly accurate indicator for trading binary options. It shows excellent results in scalping. This indicator is based in multifactor analysis of trend indicators, as well as confirmation oscillators, which in the end gives an increased accuracy of signals. Advantages of the indicator Increased accuracy of signals. Excellent results when trading binary options with a short expiration time from M30 to M1 . It works on any timeframes. Works with any trade symbols. Parameters
The Hurricane Indicator
Paul Nicholas Clevett
5 (1)
Currently switched to the 4 hour chart - but use other time frames for confirmation. :-)  I change my main time frame based on the market movement at the time. The Hurricane Forex Indicator is a multi time frame indicator that includes such things as Trade Notifications, Trade Calculator, Momentum Indicator, risk reward and much more. We have a free Trade room for our users as well. Please check out the video for full details of how this indicator works as it has over 15 years worth of developme
This indicator is a multifunctional technical analysis tool based on the combination of an adaptive exponential moving average and volatility filters calculated through the Average True Range (ATR). It is designed to accurately identify the current price direction, highlight key trend reversal areas, and visualize potential turning zones. The algorithm is built upon the dynamic construction of a trend ribbon using two levels of volatility — outer and inner ranges. The outer boundaries serve as i
Rtc ML Ai Predictor MT4
Muhammad Faisal Sagala
Rtc ML Ai | Predictor CORE MACHINE LEARNING ENGINE Adaptive ML Market Predictor – Multi-Bar Trend & Candle Forecast What This Indicator Does This indicator is a  real-time market prediction engine  designed to analyze price behavior and estimate  future market tendencies . Unlike conventional indicators, this system  does not rely on static parameters or historical curve-fitting , but adapts its internal state dynamically during live market operation. Instead of using static rules, the indic
FFx Engulfing Setup Alerter gives trade suggestions with Entry, Target 1, Target 2 and StopLoss. Below are the different options available: Entry suggestion - pips to be added over the break for the entry 3 different options to calculate the SL - by pips, by ATR multiplier or at the pattern High/Low 3 different options to calculate the 2 TPs - by pips, by ATR multiplier or at Risk/Reward Offset the dashboard - any place on the chart Remove the suggestion once the price reached the SL line Lines
FFx InsideBar Setup Alerter gives trade suggestions with Entry, Target 1, Target 2 and StopLoss. Below are the different options available: Entry suggestion - pips to be added over the break for the entry Minimum candle size - to avoid too close buy/sell entry suggestions 3 different options to calculate the SL - by pips, by ATR multiplier or at the pattern High/Low 3 different options to calculate the 2 TPs - by pips, by ATR multiplier or at Risk/Reward Offset the dashboard - any place on the c
FFx OutsideBar Setup Alerter gives trade suggestions with Entry, Target 1, Target 2 and StopLoss. Below are the different options available: Entry suggestion - pips to be added over the break for the entry. 3 different options to calculate the SL - by pips, by ATR multiplier or at the pattern High/Low. 3 different options to calculate the 2 TPs - by pips, by ATR multiplier or at Risk/Reward. Offset the dashboard - any place on the chart. Remove the suggestion once the price reached the SL line.
FFx PinBar Setup Alerter gives trade suggestions with Entry, Target 1, Target 2 and StopLoss. Below are the different options available: Entry suggestion - pips to be added over the break for the entry Minimum candle size - to avoid too small candles 3 different options to calculate the SL - by pips, by ATR multiplier or at the pattern High/Low 3 different options to calculate the 2 TPs - by pips, by ATR multiplier or at Risk/Reward Offset the dashboard - any place on the chart Remove the sugges
Automatic, live & interactive picture of all trendlines. Assign push, email and sound alerts to the lines of your choice and be informed about price rollback, breakout, rollback after breakout, number of rollbacks, line expiration by double breakout. Correct, drag or delete the lines and interactively tune the line system. https://youtu.be/EJUo9pYiHFA . Chart examples https: //www.mql5.com/en/users/efficientforex Price Interaction Events All events are effective immediately and only after one
The purpose of this new version of the MT4 standard indicator provided in your platform is to display in a sub-window multiple timeframes of the same indicator with its divergences. See the example shown in the picture below. But the display isn't like a simple MTF indicator. This is the real display of the indicator on its timeframe. Here's the options available in the FFx divergences indicator: Select the timeframes to be displayed (M1 to Monthly) Define the width (number of bars) for each tim
The purpose of this new version of the MT4 standard indicator provided in your platform is to display in a sub-window multiple timeframes of the same indicator with its divergences. See the example shown in the picture below. But the display isn't like a simple MTF indicator. This is the real display of the indicator on its timeframe. Here's the options available in the FFx divergences indicator: Select the timeframes to be displayed (M1 to Monthly). Define the width (number of bars) for each ti
The FFx Dashboard MTF alerter will show you on a single chart all the timeframes (M1 to Monthly) with their own status for the indicator. 2 Alert Options: Single timeframe: each selected timeframe alert separately when a signal occurs Multi timeframes: all selected timeframes must agree for an alert to be triggered Both options have an input to select the timeframes to be used for the alert(s). How to Understand the Status: Green/Red square: histogram above/below 0 line Green square + Red bord
The FFx Dashboard MTF alerter will show you on a single chart all the timeframes (M1 to Monthly) with their own status for the indicator. 2 Alert Options: Single timeframe: each selected timeframe alert separately when a signal occurs Multi timeframes: all selected timeframes must agree for an alert to be triggered Both options have an input to select the timeframes to be used for the alert(s). How to understand the status: Green/Red square: RSI above/below 50 line Green square + Red border: R
The FFx Dashboard MTF alerter will show you on a single chart all the timeframes (M1 to Monthly) with their own status for the indicator. 2 Alert Options: Single timeframe: each selected timeframe alert separately when a signal occurs Multi timeframes: all selected timeframes must agree for an alert to be triggered Both options have an input to select the timeframes to be used for the alert(s). How to understand the status: Green/Red square: Stoch above/below 50 line Green square + Red border:
The FFx Dashboard MTF alerter will show you on a single chart all the timeframes (M1 to Monthly) with their own status for the indicator. 2 Alert Options: Single timeframe: each selected timeframe alert separately when a signal occurs Multi timeframes: all selected timeframes must agree for an alert to be triggered Both options have an input to select the timeframes to be used for the alert(s). How to understand the status: Green/Red square: Price above/below Cloud (Kumo) Green square + Red bo
The FFx Dashboard MTF alerter will show you on a single chart all the timeframes (M1 to Monthly) with their own status for the indicator. 2 Alert Options: Single timeframe: each selected timeframe alert separately when a signal occurs Multi timeframes: all selected timeframes must agree for an alert to be triggered Both options have an input to select the timeframes to be used for the alert(s). How to understand the status: Green/Red square: MA pointing Up/Down Green square + Red border: MA po
The FFx Dashboard MTF alerter will show you on a single chart all the timeframes (M1 to Monthly) with their own status for the indicator. 2 Alert Options: Single timeframe: each selected timeframe alert separately when a signal occurs. Multi timeframes: all selected timeframes must agree for an alert to be triggered. Both options have an input to select the timeframes to be used for the alert(s). How to understand the status: Green square: Price above PSAR Red square: Price below PSAR Options
The FFx Dashboard MTF alerter will show you on a single chart all the timeframes (M1 to Monthly) with their own status for the indicator. 2 Alert Options: Single timeframe: each selected timeframe alert separately when a signal occurs Multi timeframes: all selected timeframes must agree for an alert to be triggered Both options have an input to select the timeframes to be used for the alert(s). How to understand the status: Green/Red square: CCI above/below levels (ie. 100/-100) Grey square: C
The FFx Dashboard MTF alerter will show you on a single chart all the timeframes (M1 to Monthly) with their own status for the indicator. 2 Alert Options: Single timeframe: each selected timeframe alert separately when a signal occurs Multi timeframes: all selected timeframes must agree for an alert to be triggered Both options have an input to select the timeframes to be used for the alert(s). How to understand the status: Green/Red square: ADX above level Grey square: ADX below level Red bor
The FFx Dashboard MTF alerter will show you on a single chart all the timeframes (M1 to Monthly) with their own status. 2 Alert Options: Single timeframe: each selected timeframe alert separately when a signal occurs Multi timeframes: all selected timeframes must agree for an alert to be triggered Both options have an input to select the timeframes to be used for the alert(s). How to understand the status: Green/Red square: bullish/bearish candle Options available in the FFx Dashboard Alerter
The [GRAFF] III manual trading system is based on multiple MetaTrader (MT4) indicators. Together, the entire PACK of GRAFF III indicators makes an advanced trading tool. The system consists of over 20 different custom-built indicators which have been carefully selected and tested in the long term to produce strong and efficient trading signals. The particular indicators are based on different mathematical formulas, so the entire system is calibrated to remove false signals from its own indicator
FFx Universal Strength Meter PRO is more than a basic strength meter. Instead of limiting the calculation to price, it can be based on any of the 19 integrated strength modes + 9 timeframes. With the FFx USM, you are able to define any period for any combination of timeframes. For example, you can set the dashboard for the last 10 candles for M15-H1-H4… Full flexibility! Very easy to interpret... It gives a great idea about which currency is weak and which is strong, so you can find the best pai
A simplistic indicator informing a user on RSI divergence by sending messages to mobile device and email. The indicator draws 2 vertical lines, marking two RSI extrema that formed the divergence. You get the alert, open the charts and make a decision. The indicator does not show past divergences, thus when you attach it to a chart for the first time you see nothing. Graphics and alerts will appear as soon as divergences do. Drop it in Tester to see how it works. Parameters: RSIPeriod - number of
Pan PrizMA CD Phase is an analogue of the МetaТrader 5 indicator , and is an option based on the Pan PrizMA indicator. Details . Averaging by a quadric-quartic polynomial increases the smoothness of lines, adds momentum and rhythm. Extrapolation by the sinusoid function near a constant allows adjusting the delay or lead of signals. The value of the phase - wave status parameter (which is close in meaning to the trigonometric phase or the angle of the radius-vector rotation in the trigonometric p
Green Wall Arrows
Daniel Luchinger
1 (1)
The Name Green Wall : Arrows hits a lot of TP, by changing the idea of non using SL as something bad, but instead use Small TP and a lot of free Margin and Patience. Use micro TP and a lot of Free Margin with this indicator on Forex. It also can be used with Binary Options. This strategy is intended to be traded Manually. This Indicator runs on Open Bar, arrows will delete when price are against it. The only Indicator Parameter is Alerts true/false, all the rest is included inside the code. Arro
Golden Monowave
Ahmed Mohamed Ali
Golden Monowave is monowave indicator, the monowave theory is one of Elliott wave approach and one of most complicate and accurate method. Golden Monowave can shortcut many major steps to identify and describe the monowave. It works on any timeframe and with any trading instrument, including currencies, indices, futures, etc. Input Parameters initial_Bars - set the initial number of bars to calculate. wave_color - select the color of the wave. label_color - select the color of labels. temp_labe
Mais do autor
FisherYur4ik by Yuri
Nnamdi Kennedy Ifeorah
Fisher Yur4ik Indicator is a momentum indicator originated by Yuri Prokiev (Russian). I combined the Fisher Test indicator with other indicators to sieve/filter signals. It is not used as a standalone indicator but in combination to filter out Price Action signals.  I have uploaded this indicator (Fisher test) for download alongside the 3Bar_Play signal indicator for signals to appear. It is free.
FREE
The GT_SqueezeBreakOut signal indicator is a momentum based strategy using the bollinger bands and standard deviation indicators (which indicate periods of low volatility and eventual breakout) as well as the Fisher momentum/trend indicator to filter quality trade signals.  It shows the squeeze (price consolidation) periods on chart and also signals on breakout of squeeze/price consolidation. You get instant alert/ push notification both on chart and on any other device used to receive alert sig
MT4 Trade Journal
Nnamdi Kennedy Ifeorah
This MT4 Trading Journal Indicator is a   powerful, professional-grade tool   that transforms the standard MetaTrader 4 platform into a comprehensive trading management system. Its unique multi-instance capability, customizable interface, and automatic tracking features make it an exceptional value proposition for traders seeking organization and discipline in their trading activities. 1. VISUAL BRANDING & CUSTOMIZATION Dynamic Color Coordination : The title bar automatically matches the toggle
GOLD vs USD
Nnamdi Kennedy Ifeorah
The Gold Standard in Gold Trading: Multi-Confirmation RSI System with Real-Time Alerts INTRODUCTION GOLD vs USD RSI Cross Indicator   is a professional-grade trading system that revolutionizes Gold/USD analysis by providing multi-dimensional confirmation signals. Built for serious traders who demand precision, this indicator combines traditional RSI momentum with advanced relative strength analysis to identify high-probability trading opportunities with unprecedented clarity.  It provides  alig
Filtro:
Sem comentários
Responder ao comentário