Advanced Arrow

3.9

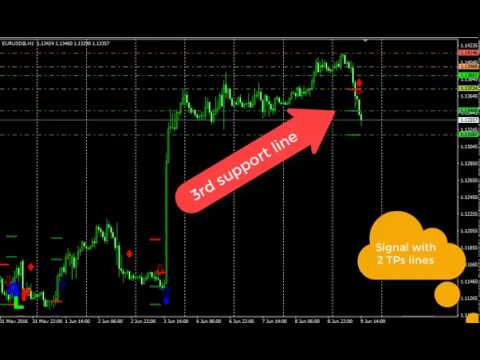
This indicator depends on some secrets equations to draw Signals with Stop loss and maximum 4 Take profits.

There is a free EA depends on this indicator as a gift when you purchase/rent it.


Features

  • Simply it gives you entry point as Ready sign (Buy / Sell) and arrow (Buy / Sell) after candle closed, also SL line and 4 TP lines or less.
  • Once SL-TP lines are shown with the arrow, they remains as they are until signal change.
  • It is historical indicator.
  • No Repaint.
  • user manual for V5 please click here for V6 please click here


Indicator parameters

  • Indicator Version: choose V5 or V6.
  • TP 1 Line color: TP1 color.
  • TP 2 Line color: TP2 color.
  • TP 3 Line color: TP3 color.
  • TP 4 Line color: TP4 color.
  • Signal line Style: Choose (Solid, dashed,.).
  • TP-SL Lines Style: Choose (Solid, dashed,.).
  • Buy Signal color: Buy signal color.
  • Sell Signal color: Sell signal color.
  • Historical Bars: Number of history bars on chart for the indicator calculation.
  • Show Vertical line: (true / false).
  • Place of Vertical line: you can choose (On Diamond / On Signal).
  • Buy Vertical line color: Buy Vertical Line color.
  • Sell Vertical line color: Sell Vertical Line color.
  • Vertical line Style: Choose (Solid, dashed,.).
  • Ready Sign location from H/L candle in pips: you can adjust the place of ready sign in pips.
  • Ready to buy Sign: Type the code of symbol you want indicator to draw as ready to buy sign (see codes table).
  • Ready to Sell Sign: Type the code of symbol you want indicator to draw as ready to sell sign (see codes table).
  • Signal location from H/L candle in pips: you can adjust the place of signal sign in pips.
  • Buy Signal Sign: Type the code of symbol you want indicator to draw as buy signal.
  • Sell Signal Sign: Type the code of symbol you want indicator to draw as sell signal.
  • Show Resistances: (True / False) to let indicator drawing the R for:
    • 1. Current day if you use (H1 or less).
    • 2. Current week if you use H4.
    • 3. Current month if you use D1.
  • Resistance 1: R1 color.
  • Resistance 2: R2 color.
  • Resistance 3: R3 color.
  • Resistance 4: R4 color.
  • Show Supports: (True / False) to let indicator drawing the S.
  • Support 1: S1 color.
  • Support 2: S2 color.
  • Support 3: S3 color.
  • Support 4: S4 color.
  • R/S Lines Style: Choose (Solid, dashed,.).
  • TPs lines depends on R/S for: choose between
    • 1. Auto: same R/S levels on the chart.
    • 2. M5: R/S for time frame 5 minutes.
    • 3. M15: R/S for time frame 15 minutes.
    • And so on.
  • Show Information: show information about last signal.
  • Information Color (Buy): color of buy signal information.
  • Information Color (Sell): color of sell signal information.
  • Show: you can choose between (Signal ,TP, SL Lines / Just Signal).
  • Notifications: (True / False) enable or Disable notifications system at all.
  • Start Time (From): Duration time in day for notifications system as From Time.
  • End Time (To): Duration time in day for notifications system as To Time.
  • Alert Type: Choose between below for which information you want indicator telling you:
    • 1. Signal,TPs,SL and Candles between Ready Sign and Signal.
    • 2. Signal,TPs and SL.
    • 3. Signal.
  • Diamond / Vertical line Alert: (true / false).
  • Alert: Displays a message in a separate window.
  • Send push message: Sends push notifications to the mobile, whose MetaQuotes IDs are specified in the "Notifications" tab.
  • Send an email: Sends an email at the address specified in the settings window of the "Email" tab.
  • Message Header.Long: The header of message send to you in long signal case.
  • Message Header.Short: The header of message send to you in short signal case.
  • Message Content.Long: The message content send to you in long signal case.
  • Message Content.Short: The message content send to you in short signal case.

Buffering read from indicator (For Developers)

For Version 5 and For version 6

Comentários 45
Sohaieb Zayana
562
Sohaieb Zayana 2017.06.30 13:33 
 

I'm using the AA since 2 months. Unfortunately I wasn't able to use it regular as I had lack off time, but history candles shows the profits I would have made.

Being grateful Alfred released an EA free of charge for AA owner. Profit is less than it would be using it manually as some filters are still missing. But overall very good and stable AA.

Support worth more than 5 stars

Looking forward for new releases

Luis Plascencia
206
Luis Plascencia 2017.06.19 11:08 
 

Good job Alfred!! Thank you!!

Ravi Luke
643
Ravi Luke 2017.06.10 15:35 
 

Great indicator if you use some judgement of your own. Thanks!

Produtos recomendados
Forex Gump
Andrey Kozak
2.4 (5)
Forex Gump is a fully finished semi-automatic trading system. In the form of arrows, signals are displayed on the screen for opening and closing deals. All you need is to follow the instructions of the indicator. When the indicator shows a blue arrow, you need to open a buy order. When the indicator shows a red arrow, you need to open a sell order. Close orders when the indicator draws a yellow cross. In order to get the most effective result, we recommend using the timeframes H1, H4, D1. There
O indicador Crypto_Forex "Auto FIBO Pro" é uma ótima ferramenta auxiliar na negociação! - O indicador calcula e coloca automaticamente no gráfico os níveis de Fibonacci e as linhas de tendência locais (cor vermelha). - Os níveis de Fibonacci indicam áreas-chave onde o preço pode reverter. - Os níveis mais importantes são 23,6%, 38,2%, 50% e 61,8%. - Pode utilizá-lo para scalping de reversão ou para negociação de grelha de zona. - Existem muitas oportunidades para melhorar o seu sistema atual u
"Dynamic Scalping Oscillator" - um indicador avançado e personalizado para Crypto_Forex - uma ferramenta de negociação eficiente para MT4! - Nova geração de osciladores - veja as imagens para saber como usá-lo. - O Dynamic Scalping Oscillator possui zonas adaptáveis de sobrevenda/sobrecompra. - O oscilador é uma ferramenta auxiliar para encontrar pontos de entrada exatos em áreas dinâmicas de sobrevenda/sobrecompra. - Valores de sobrevenda: abaixo da linha verde, valores de sobrecompra: acima
Night ghost
Dmitriy Kashevich
Night Ghost - Indicador de seta para opções binárias. Este é um assistente confiável para você no futuro! - Sem redesenho no gráfico -Funciona muito bem em todos os pares de moedas! -Precisão do indicador de até 90% (especialmente à noite) -Não há necessidade de configurar por um longo tempo (Configurar perfeitamente para Opções Binárias) - Sem sinais de atraso - O aparecimento de um sinal na vela atual -Perfeito para o período M1 (não mais!) - Cor de vela amigável aos olhos (vermelho
VR Cub
Vladimir Pastushak
VR Cub é um indicador para obter pontos de entrada de alta qualidade. O indicador foi desenvolvido para facilitar cálculos matemáticos e simplificar a busca por pontos de entrada em uma posição. A estratégia de negociação para a qual o indicador foi escrito tem provado a sua eficácia há muitos anos. A simplicidade da estratégia de negociação é a sua grande vantagem, o que permite que até mesmo os comerciantes novatos negociem com sucesso com ela. VR Cub calcula os pontos de abertura de posição e
Indicador Crypto_Forex "Morning Star pattern" para MT4. - O indicador "Morning Star pattern" é um indicador muito poderoso para negociação de Price Action: sem repintura, sem atraso. - O indicador detecta padrões Morning Star otimistas no gráfico: sinal de seta azul no gráfico (veja as imagens). - Com alertas para PC, celular e e-mail. - Também seu irmão - o indicador bearish "Evening Star pattern" está disponível (siga o link abaixo). - O indicador "Morning Star pattern" é excelente para comb
Introducing the "Magic Trades" for MetaTrader 4 – your ultimate tool for precision trading in dynamic markets. This innovative indicator revolutionizes the way you perceive market trends by harnessing the power of advanced analysis to detect subtle changes in character, paving the way for optimal trading opportunities. The Magic Trades Indicator is designed to empower traders with insightful entry points and well-defined risk management levels. Through its sophisticated algorithm, this indicato
Fibonacci recontratar e extensão linha de desenho ferramenta Fibonacci recontratar e estender a ferramenta de desenho de linha para a plataforma MT4 é adequado para comerciantes que usam método de negociação de pontos e negociação de secções douradas Vantagens: Não há linha extra, não há linhagem muito longa, e é fácil observar e encontrar oportunidades de negociação Versão experimental: https://www.mql5.com/zh/market/product/35884 Principais funções: 1. Podem ser desenhados diretamente vári
Chart Patterns Detect 15 patterns (Ascending Triangle, Descending Triangle, Rising Wedge, Falling Wedge, Bullish Flag, Bearish Flag, Bullish Rectangle, Bearish Rectangle Symmetrical triangle, Head and Shoulders, Inverted Head and Shoulders, Triple top, Triple Bottom, Double Top, Double Bottom) Use historical data to calculate the probability of each pattern to succeed (possibility to filter notification according to the chance of success) gives graphic indication about the invalidation level and
Trendlines Chart Patterns Indicator (MT4) Automated Chart Patterns & Breakout Signals for MT4: Trade with Precision! The "Trendlines Chart Patterns Indicator" is an advanced trading tool for MetaTrader 4 (MT4) , meticulously designed to identify high-probability buy and sell signals based on dynamically forming, robust trend lines and popular chart patterns . This powerful forex indicator automates the complex process of identifying patterns like triangles, flags, ranges, ascending/descending tr
Gvs Undefeated Trend   indicator is designed for trend and signal trading. This indicator generates trend signals.  It uses many algorithms and indicators to generate this signal. It tries to generate a signal from the points with the highest trend potential. This indicator is a complete trading product. This indicator does not need any additional indicators.  You can only trade with this indicator. The generated signals are displayed on the graphical screen.  Thanks to the alert features you ca
EARLY REMINDER: The Starting price is 65 price will rise soon up to 365$ and then 750$ after first 10 copies of sales. Grab this offer now! Introduction Hello, traders! Welcome to the demonstration of the Forex Beast Indicator , a comprehensive tool designed to assist aspiring traders in navigating the complexities of the forex market. This indicator incorporates seven essential components to provide a well-rounded trading experience: Moving Averages Colored Zones Support and Resistance Levels
The Th3Eng PipFinite indicator is based on a very excellent analysis of the right trend direction with perfect custom algorithms. It show the true direction and the best point to start trading. With StopLoss point and Three Take Profit points. Also it show the right pivot of the price and small points to order to replace the dynamic support and resistance channel, Which surrounds the price. And Finally it draws a very helpful Box on the left side on the chart includes (take profits and Stop loss
Gold Titan King Scalper
Dodong Christian Arnon
Indicator Description GOLD TITAN KING SIGNAL INDICATOR High-Precision Gold Scalping Buy/Sell Signals – Manual Trading Assistant Overview The Gold Titan King Signal Indicator is a manual trading assistant tool designed for high-frequency scalping on Gold (XAUUSD) and other major pairs. It generates clear BUY/SELL signals with precise entry levels, along with adjustable Stop Loss and Take Profit levels displayed directly on the chart. ️ This tool is NOT an EA. It does not execute trades
Os indicadores [ZhiBiCCI] são adequados para todo o ciclo de uso e também são adequados para todas as variedades do mercado. [ZhiBiCCI] Linha sólida verde é uma inversão da divergência de alta. A linha pontilhada verde é uma divergência de alta clássica. [ZhiBiCCI] A linha sólida para o vermelho é uma divergência de baixa reversa. A linha pontilhada vermelha é uma divergência clássica de baixa. [ZhiBiCCI] pode ser definido nos parâmetros (Alerta, Enviar e-mail, Enviar notificação), definido c
Super Reversal Pattern
Parfait Mujinga Ndalika
Super Reversal Pattern Indicator Unlock the power of advanced pattern recognition with our Super Reversal Pattern Indicator. Designed for traders seeking precision and reliability, this indicator identifies one of the most effective reversal patterns in technical analysis, offering a significant edge in your trading strategy. Key Features: Non-Repainting Accuracy: Enjoy the confidence of non-repainting technology. Once a Super Reversal Pattern is detected, it remains static, providing consiste
PZ ABCD Retracement
PZ TRADING SLU
4 (5)
Este indicador encontra os padrões de retração AB = CD. O padrão AB = CD Retracement é uma estrutura de preço de 4 pontos em que o segmento de preço inicial é parcialmente retraído e seguido por um movimento equidistante da conclusão da retirada, e é a base básica para todos os padrões harmônicos. [ Guia de instalação | Guia de atualização | Solução de problemas | FAQ | Todos os produtos ] Tamanhos de padrão personalizáveis Proporções AC e BD personalizáveis Períodos de interrupção personali
Binary Options Support Resistance Indicator This indicator is designed for binary options trading and effectively shows retracements from support and resistance levels. Signals appear on the current candle. A red arrow pointing downwards indicates a potential selling opportunity, while a blue arrow pointing upwards suggests buying opportunities. All that needs adjustment is the color of the signal arrows. It is recommended to use it on the M1-M5 timeframes as signals are frequent on these timef
RSI Speed mp
DMITRII GRIDASOV
Indicador Crypto_Forex "RSI SPEED" para MT4 - ótima ferramenta preditiva, sem necessidade de repintura. - O cálculo deste indicador é baseado em equações da física. O RSI SPEED é a primeira derivada do próprio RSI. - O RSI SPEED é bom para entradas de scalping na direção da tendência principal. - Use-o em combinação com um indicador de tendência adequado, por exemplo, HTF MA (como nas imagens). - O indicador RSI SPEED mostra a rapidez com que o próprio RSI muda de direção - ele é muito sensíve
QuantumEdge Trader
Hossam Ali Ahmed Ali
QuantumEdge Trader v1.0 AI-Powered Precision Signals for Serious Traders QuantumEdge Trader is a smart and reliable indicator that delivers accurate BUY and SELL signals using advanced market analysis and trend detection. Designed for M1 to M60 timeframes, it's ideal for scalping and intraday strategies. --- Key Features: No Repaint – Signals never change after appearing Smart trend filters to reduce noise Adjustable sensitivity and alerts Perfect for XAUUSD, EURUSD, and m
PZ Harmonacci Patterns
PZ TRADING SLU
3.17 (6)
Este é sem dúvida o indicador de reconhecimento automático de formação de preço harmônico mais completo que você pode encontrar para a MetaTrader Platform. Ele detecta 19 padrões diferentes, leva as projeções de Fibonacci tão a sério quanto você, exibe a Zona de Reversão Potencial (PRZ) e encontra níveis adequados de stop loss e take-profit. [ Guia de instalação | Guia de atualização | Solução de problemas | FAQ | Todos os produtos ] Detecta 19 formações harmônicas de preços diferentes Traça
We present you the indicator "Candle closing counter", which will become your indispensable assistant in the world of trading. That’s why knowing when the candle will close can help: If you like to trade using candle patterns, you will know when the candle will be closed. This indicator will allow you to check if a known pattern has formed and if there is a possibility of trading. The indicator will help you to prepare for market opening and market closure. You can set a timer to create a pre
Antes de tudo, vale ressaltar que esta Ferramenta de Negociação é um Indicador Não Repintante, Não Redesenhante e Não Atrasado, o que a torna ideal para negociação profissional. Curso online, manual do utilizador e demonstração. O Indicador de Conceitos de Ação de Preço Inteligente é uma ferramenta muito poderosa tanto para traders novos quanto experientes. Ele combina mais de 20 indicadores úteis em um único, combinando ideias avançadas de negociação como Análise do Trader do Círculo Interno e
Owl smart levels
Sergey Ermolov
4.24 (37)
Versão MT5  |  FAQ O   Indicador Owl Smart Levels   é um sistema de negociação completo dentro de um indicador que inclui ferramentas populares de análise de mercado, como   fractais avançados de Bill Williams , Valable ZigZag que constrói a   estrutura de onda correta   do mercado e   níveis de Fibonacci que marcam os níveis exatos de entrada no mercado e lugares para obter lucros. Descrição detalhada da estratégia Instruções para trabalhar com o indicador Consultor de negociação Owl Helper Ch
Atomic Analyst
Issam Kassas
5 (3)
Primeiramente, vale ressaltar que este Indicador de Negociação não repinta, não redesenha e não apresenta atrasos, tornando-o ideal tanto para negociação manual quanto automatizada. Manual do utilizador: configurações, entradas e estratégia. O Analista Atômico é um Indicador de Ação de Preço PA que utiliza a força e o momentum do preço para encontrar uma vantagem melhor no mercado. Equipado com filtros avançados que ajudam a remover ruídos e sinais falsos, e aumentam o potencial de negociação.
The   True Magic Oscillator   indicator is designed for signal trading. This indicator generates trend signals. It uses many algorithms and indicators to generate this signal. It tries to generate signals from the points with the highest trend potential. This indicator is a complete trading product. This indicator does not need any additional indicators. The indicator is never repainted. The point at which the signal is given does not change.         Features and Recommendations Works wit
KT Renko Patterns MT4
KEENBASE SOFTWARE SOLUTIONS
2.33 (3)
O KT Renko Patterns analisa o gráfico Renko tijolo por tijolo para identificar padrões gráficos conhecidos que são amplamente utilizados por traders em diversos mercados financeiros. Em comparação com gráficos baseados em tempo, os gráficos Renko tornam a identificação de padrões muito mais fácil e visualmente clara, graças à sua aparência limpa e objetiva. O KT Renko Patterns possui vários padrões Renko, muitos dos quais são explicados com profundidade no livro "Profitable Trading with Renko
O indicador SMC Venom Model BPR é uma ferramenta profissional para os traders que trabalham com o conceito Smart Money (SMC). Identifica automaticamente dois padrões principais no gráfico de preços: FVG   (Fair Value Gap) é uma combinação de três velas, em que existe um gap entre a primeira e a terceira velas. Forma uma zona entre níveis onde não há suporte de volume, o que geralmente leva a uma correção de preço. BPR   (Balanced Price Range) é uma combinação de dois padrões FVG que formam uma “
Indicator for binary options arrow is easy to use and does not require configuration works on all currency pairs, cryptocurrencies buy signal blue up arrow sell signal red down arrow tips do not trade during news and 15-30 minutes before their release, as the market is too volatile and there is a lot of noise it is worth entering trades one or two candles from the current period (recommended for 1 candle) timeframe up to m 15 recommended money management fixed lot or fixed percentage of the depo
Noize Absorption Index MT4
Ekaterina Saltykova
5 (1)
Noize Absorption Index - is the manual trading system that measures the difference of pressure between bears forces and bulls forces. Green line - is a noize free index that showing curent situation. Zero value of index shows totally choppy/flat market.Values above zero level shows how powerfull bullish wave is and values below zero measures bearish forces.Up arrow appears on bearish market when it's ready to reverse, dn arrow appears on weak bullish market, as a result of reverse expectation. S
Os compradores deste produto também adquirem
Pulse Scalping Line - an indicator for identifying potential pivot points. Based on this indicator, you can build an effective Martingale system. According to our statistics, the indicator gives a maximum of 4 erroneous pivot points in a series. On average, these are 2 pivot points. That is, the indicator shows a reversal, it is erroneous. This means that the second signal of the indicator will be highly accurate. Based on this information, you can build a trading system based on the Martingale
Product Name:   Quantum Regime Indicator Short Description:   A multi-engine structural regime and volatility filter. Description: Quantum Regime Indicator (QRI) is a sophisticated technical analysis algorithm designed to identify market structure shifts and volatility regimes. Unlike standard indicators that rely on immediate price action, QRI utilizes a hierarchical logic architecture to filter market noise and identify statistical extremes. The indicator is built on the philosophy of "Market
Indicador Miraculous – Ferramenta 100% Não Repintável para Forex e Opções Binárias Baseada no Quadrado de Nove de Gann Este vídeo apresenta o Indicador Miraculous , uma ferramenta de negociação altamente precisa e poderosa, desenvolvida especificamente para traders de Forex e Opções Binárias . O que torna este indicador único é a sua base no lendário Quadrado de Nove de Gann e na Lei da Vibração de Gann , tornando-o uma das ferramentas de previsão mais precisas disponíveis na negociação moderna.
Apresentamos o Indicador de Avião F-16, uma ferramenta de ponta para o MT4 projetada para revolucionar sua experiência de negociação. Inspirado na velocidade e precisão incomparáveis do caça F-16, este indicador combina algoritmos avançados e tecnologia de última geração para oferecer um desempenho sem igual nos mercados financeiros. Com o Indicador de Avião F-16, você vai decolar acima da concorrência, pois ele fornece análises em tempo real e gera sinais de negociação altamente precisos. Suas
Meravith
Ivan Stefanov
5 (1)
O indicador analisa o volume de cada ponto e calcula os níveis de exaustão do mercado para esse volume. Ele consiste em três linhas: Linha de exaustão do volume altista Linha de exaustão do volume baixista Linha que indica a tendência do mercado. Esta linha muda de cor para refletir se o mercado é altista ou baixista. Você pode analisar o mercado a partir de qualquer ponto inicial que escolher. Uma vez que uma linha de exaustão de volume seja atingida, identifique um novo ponto de início para o
O indicador " Dynamic Scalper System " foi desenvolvido para o método de scalping, operando dentro de ondas de tendência. Testado nos principais pares de moedas e ouro, é possível a compatibilidade com outros instrumentos de negociação. Fornece sinais para a abertura de posições de curto prazo ao longo da tendência, com suporte adicional para o movimento dos preços. O princípio do indicador: As setas grandes determinam a direção da tendência. Um algoritmo para gerar sinais de scalping sob a fo
Gold Channel   é um indicador baseado na volatilidade, desenvolvido com um algoritmo de tempo especifico para o par XAUUSD que consiste em encontrar possíveis correções no mercado. Este indicador mostra duas linhas exteriores, uma interior (linha de retração) e um sinal de seta, onde a teoria do canal consiste em ajudar a identificar condições de sobrecompra e sobrevenda no mercado. O preço do mercado cairá geralmente entre os limites do canal. Se os preços tocarem ou se moverem para fora do can
OrderFlow Absorption – Indicador Profissional de Delta e Sinais de Absorção para MT4 Desbloqueie o poder da verdadeira análise de fluxo de ordens com o OrderFlow Absorption – o indicador definitivo de histograma de delta e sinais de absorção para MetaTrader 4. Desenvolvido para traders que desejam enxergar o que realmente acontece por trás de cada movimento de preço, esta ferramenta revela pressões ocultas de compra/venda e eventos de absorção que movimentam o mercado. Recursos Visualização do H
The Hurricane Indicator
Paul Nicholas Clevett
5 (1)
Currently switched to the 4 hour chart - but use other time frames for confirmation. :-)  I change my main time frame based on the market movement at the time. The Hurricane Forex Indicator is a multi time frame indicator that includes such things as Trade Notifications, Trade Calculator, Momentum Indicator, risk reward and much more. We have a free Trade room for our users as well. Please check out the video for full details of how this indicator works as it has over 15 years worth of developme
Everyone who purchases the Scalping signals M1 indicator receives a FREE BONUS — a fully automated Expert Advisor that trades based on the indicator’s signals. The indicator shows the arrows — the robot can execute the trades for you, following all signals and risk-management rules. Scalping signals M1 – a ready-made trend-following entry system for M1 Scalping signals M1 is an indicator that turns your chart into a clear action map: a colored trend channel shows the direction of the market, and
BinaryIndicator
Andrey Spiridonov
BinaryIndicator is a highly accurate indicator for trading binary options. It shows excellent results in scalping. This indicator is based in multifactor analysis of trend indicators, as well as confirmation oscillators, which in the end gives an increased accuracy of signals. Advantages of the indicator Increased accuracy of signals. Excellent results when trading binary options with a short expiration time from M30 to M1 . It works on any timeframes. Works with any trade symbols. Parameters
Shows price reversal points with arrows. Works on all timeframes and all currency pairs. Suitable for both scalping and long-term trading. When the blue arrow appears, you need to open a buy order. When the red arrow appears, you need to open a sell order. Recommended timeframes M5, M15, H1, H4. The indicator shows the best results on GBPUSD, XAUUSD, EURUSD, USDJPY, AUDUSD, USDCHF, EURGBP, EURJPY, EURCHF and other major pairs. This indicator is well suited for intraday scalping because it show
Scalpetronix Indicator — o núcleo de sinais do robô Scalpetronix Este indicador implementa os algoritmos e sinais nos quais o Expert Advisor Scalpetronix se baseia. Todas as entradas do robô são geradas a partir destes cálculos: combinação de médias móveis exponenciais (EMA), filtragem de tendência através do ADX, normalização da volatilidade pelo ATR e análise da estrutura das velas. Vantagens do indicador funciona com um sistema multinível de EMA (rápida e lenta) com limiar dinâmico; elimina s
This indicator is a multifunctional technical analysis tool based on the combination of an adaptive exponential moving average and volatility filters calculated through the Average True Range (ATR). It is designed to accurately identify the current price direction, highlight key trend reversal areas, and visualize potential turning zones. The algorithm is built upon the dynamic construction of a trend ribbon using two levels of volatility — outer and inner ranges. The outer boundaries serve as i
Rtc ML Ai Predictor MT4
Muhammad Faisal Sagala
Rtc ML Ai | Predictor CORE MACHINE LEARNING ENGINE Adaptive ML Market Predictor – Multi-Bar Trend & Candle Forecast What This Indicator Does This indicator is a  real-time market prediction engine  designed to analyze price behavior and estimate  future market tendencies . Unlike conventional indicators, this system  does not rely on static parameters or historical curve-fitting , but adapts its internal state dynamically during live market operation. Instead of using static rules, the indic
FFx Engulfing Setup Alerter gives trade suggestions with Entry, Target 1, Target 2 and StopLoss. Below are the different options available: Entry suggestion - pips to be added over the break for the entry 3 different options to calculate the SL - by pips, by ATR multiplier or at the pattern High/Low 3 different options to calculate the 2 TPs - by pips, by ATR multiplier or at Risk/Reward Offset the dashboard - any place on the chart Remove the suggestion once the price reached the SL line Lines
FFx InsideBar Setup Alerter gives trade suggestions with Entry, Target 1, Target 2 and StopLoss. Below are the different options available: Entry suggestion - pips to be added over the break for the entry Minimum candle size - to avoid too close buy/sell entry suggestions 3 different options to calculate the SL - by pips, by ATR multiplier or at the pattern High/Low 3 different options to calculate the 2 TPs - by pips, by ATR multiplier or at Risk/Reward Offset the dashboard - any place on the c
FFx OutsideBar Setup Alerter gives trade suggestions with Entry, Target 1, Target 2 and StopLoss. Below are the different options available: Entry suggestion - pips to be added over the break for the entry. 3 different options to calculate the SL - by pips, by ATR multiplier or at the pattern High/Low. 3 different options to calculate the 2 TPs - by pips, by ATR multiplier or at Risk/Reward. Offset the dashboard - any place on the chart. Remove the suggestion once the price reached the SL line.
FFx PinBar Setup Alerter gives trade suggestions with Entry, Target 1, Target 2 and StopLoss. Below are the different options available: Entry suggestion - pips to be added over the break for the entry Minimum candle size - to avoid too small candles 3 different options to calculate the SL - by pips, by ATR multiplier or at the pattern High/Low 3 different options to calculate the 2 TPs - by pips, by ATR multiplier or at Risk/Reward Offset the dashboard - any place on the chart Remove the sugges
Automatic, live & interactive picture of all trendlines. Assign push, email and sound alerts to the lines of your choice and be informed about price rollback, breakout, rollback after breakout, number of rollbacks, line expiration by double breakout. Correct, drag or delete the lines and interactively tune the line system. https://youtu.be/EJUo9pYiHFA . Chart examples https: //www.mql5.com/en/users/efficientforex Price Interaction Events All events are effective immediately and only after one
The purpose of this new version of the MT4 standard indicator provided in your platform is to display in a sub-window multiple timeframes of the same indicator with its divergences. See the example shown in the picture below. But the display isn't like a simple MTF indicator. This is the real display of the indicator on its timeframe. Here's the options available in the FFx divergences indicator: Select the timeframes to be displayed (M1 to Monthly) Define the width (number of bars) for each tim
The purpose of this new version of the MT4 standard indicator provided in your platform is to display in a sub-window multiple timeframes of the same indicator with its divergences. See the example shown in the picture below. But the display isn't like a simple MTF indicator. This is the real display of the indicator on its timeframe. Here's the options available in the FFx divergences indicator: Select the timeframes to be displayed (M1 to Monthly). Define the width (number of bars) for each ti
The FFx Dashboard MTF alerter will show you on a single chart all the timeframes (M1 to Monthly) with their own status for the indicator. 2 Alert Options: Single timeframe: each selected timeframe alert separately when a signal occurs Multi timeframes: all selected timeframes must agree for an alert to be triggered Both options have an input to select the timeframes to be used for the alert(s). How to Understand the Status: Green/Red square: histogram above/below 0 line Green square + Red bord
The FFx Dashboard MTF alerter will show you on a single chart all the timeframes (M1 to Monthly) with their own status for the indicator. 2 Alert Options: Single timeframe: each selected timeframe alert separately when a signal occurs Multi timeframes: all selected timeframes must agree for an alert to be triggered Both options have an input to select the timeframes to be used for the alert(s). How to understand the status: Green/Red square: RSI above/below 50 line Green square + Red border: R
The FFx Dashboard MTF alerter will show you on a single chart all the timeframes (M1 to Monthly) with their own status for the indicator. 2 Alert Options: Single timeframe: each selected timeframe alert separately when a signal occurs Multi timeframes: all selected timeframes must agree for an alert to be triggered Both options have an input to select the timeframes to be used for the alert(s). How to understand the status: Green/Red square: Stoch above/below 50 line Green square + Red border:
The FFx Dashboard MTF alerter will show you on a single chart all the timeframes (M1 to Monthly) with their own status for the indicator. 2 Alert Options: Single timeframe: each selected timeframe alert separately when a signal occurs Multi timeframes: all selected timeframes must agree for an alert to be triggered Both options have an input to select the timeframes to be used for the alert(s). How to understand the status: Green/Red square: Price above/below Cloud (Kumo) Green square + Red bo
The FFx Dashboard MTF alerter will show you on a single chart all the timeframes (M1 to Monthly) with their own status for the indicator. 2 Alert Options: Single timeframe: each selected timeframe alert separately when a signal occurs Multi timeframes: all selected timeframes must agree for an alert to be triggered Both options have an input to select the timeframes to be used for the alert(s). How to understand the status: Green/Red square: MA pointing Up/Down Green square + Red border: MA po
Mais do autor
PipsFactoryDailyDemo
Alfred Kamal
4.5 (2)
This is Demo Version of PipsFactoryDaily This indicator depends on High and Low price of currency in the last day, and then I made some secret equations to draw 10 lines. Features You will know what exactly price you should enter the market. You will know when to be out of market. You will know what you should do in market: Buy Sell Take profit, and there are three levels to take your profit Support Resistance Risk to buy Risk to sell Signal Types and Timeframes Used You can use this indicator
FREE
This is Demo Version of PipsFactoryMonthly This indicator depends on High and Low price of Currency in last Month and then i made some secret equations to draw 10 lines. Features You will know what exactly price you should enter the market. You will know when to be out of market. You will know you what should you do in market: Buy Sell Take profit and there are 3 levels to take your profit Support Resistance Risk to buy Risk to Sell Signal Types and Timeframe Used You can use this indicator ju
FREE
FiboRecDemo
Alfred Kamal
4 (1)
This indicator is Demo version of FiboRec and works only on EURUSD This indicator depends on Fibonacci lines but there are secret lines I used. By using FiboRec indicator you will be able to know a lot of important information in the market such as: Features You can avoid entry during market turbulence. You can enter orders in general trend only. You will know if the trend is strong or weak. Signal Types and Frame used You can use this indicator just on H1 frame. Enter buy order in case Candle
FREE
It is a demo version of Advanced Arrow indicator It works only on GBPJPY but the full version works on all currency pairs. Features Simply it gives you entry point ,SL line and 4 TP lines or less. Once SL-TP lines are shown with the arrow, they remains as they are until signal change. It is historical indicator. No Repaint. Indicator parameters Indicator Version : choose V5 or V6. TP 1 Line color : TP1 color. TP 2 Line color : TP2 color. TP 3 Line color : TP3 color. TP 4 Line color : TP4 colo
FREE
This is Demo version of PipsFactoryWeekly This indicator depends on High and Low price of Currency in last Week and then i made some secret equations to draw 10 lines. Features: You will know what exactly price you should enter the market . You will know when to be out of market. You will know you what should you do in market: Buy Sell Take profit and there are 3 levels to take your profit Support Resistance Risk to buy Risk to Sell Signal Types and Frame used: You can use this indicator just
FREE
Features It is a demo version of All inOne indicator It works only on EURUSD, but the full version works on all currency pairs. All in One indicator is a simple indicator, it makes you know about 8 indicators in all timeframes simultaneously at a single glance. Stochastic RSI Moving Average (MA) Parabolic SAR ADX MACD CCI Last Candle (Candle) In all timeframes (M1, M5, M15, M30, H1, H4, D1, MN) at the same time. Parameters Stochastic: PercentK : Period of the %K line. PercentD : Period of the %
FREE
This is a Demo version of PipsFactoryInd it is works only NZD/USD but full version is works on all currency pair. This indicator is a collection of three indicators, it is 3 in 1: PipsFactoryDaily Click Here PipsFactoryWeekly Click Here PipsFactoryMonthly Click Here This indicator depends on High and Low price of currency in the (Last day / Last week / Last Month) depends on user input, and then I made some secret equations to draw 10 lines. Features: You will know what exactly price you shoul
FREE
FiboRec
Alfred Kamal
This indicator depends on Fibonacci lines but there is a secret lines i used them, by using FiboRec indicator you will be able to know a lot of important information in the market such as: Features You can avoid entry during market turbulence. You can enter orders in general trend only. You will know if the trend is strong or weak. Signal Types and Frame used You can use this indicator just on H1 frame. Enter buy order in case Candle break out the square area and closed over it, at least 20 pi
This indicator depends on High and Low price of Currency in last Week and then i made some secret equations to draw 10 lines. Features: You will know what exactly price you should enter the market . You will know when to be out of market. You will know you what should you do in market: Buy Sell Take profit and there are 3 levels to take your profit Support Resistance Risk to buy Risk to Sell Signal Types and Frame used: You can use this indicator just on H4 frame and you have to download the h
This indicator depends on High and Low price of Currency in last Month and then i made some secret equations to draw 10 lines. Features You will know what exactly price you should enter the market . You will know when to be out of market. You will know you what should you do in market: Buy Sell Take profit and there are 3 levels to take your profit Support Resistance Risk to buy Risk to Sell Signal Types and Timeframe Used You can use this indicator just on H4 timeframe and you have to downloa
PipsFactoryDaily
Alfred Kamal
5 (1)
This indicator depends on High and Low price of currency in the last day, and then I made some secret equations to draw 10 lines. Features You will know what exactly price you should enter the market. You will know when to be out of market. You will know what you should do in market: Buy Sell Take profit, and there are three levels to take your profit Support Resistance Risk to buy Risk to sell Signal Types and Timeframes Used You can use this indicator just on (M1, M5, M15, M30, H1) timeframe
Description: This indicator is a collection of three indicators , it is 3 in 1: PipsFactoryDaily Click Here PipsFactoryWeekly Click Here PipsFactoryMonthly Click Here If you are interesting in all of them, you can save money - this collection indicator is cheaper. This indicator depends on High and Low price of currency in the (Last day / Last week / Last Month) depends on user input, and then I made some secret equations to draw 10 lines. Features: You will know what exactly price you should
Features All in One indicator is a simple indicator. It makes you know about eight indicators in all timeframes at just one view in the same time. Stochastic RSI Moving Average (MA) Parabolic SAR ADX MACD CCI Last Candle (Candle) in all timeframes (M1, M5, M15, M30, H1, H4, D1, MN) in the same time. Parameters Stochastic PercentK : period of the %K line. PercentD : period of the %D line. Slowing : slowing value. RSI RSIP1 : period 1 RSIP2 : period 2 Fast Moving Average MA averaging period: aver
All Pivot Points
Alfred Kamal
5 (1)
Pivot Points is used by traders to objectively determine potential support and resistance levels. Pivots can be extremely useful in Forex since many currency pairs usually fluctuate between these levels. Most of the time, price ranges between R1 and S1. Pivot points can be used by range, breakout, and trend traders. Range-bound Forex traders will enter a buy order near identified levels of support and a sell order when the pair nears resistance. But there is more one method to determine Pivot po
This indicator draws the Fibonacci -38.2, -17, 38.2, 61.8, 117, 138 levels for the last closed H1, H4, Daily, Weekly and Monthly candle. Features Automatic display of the most important Fibonacci levels. Parameters TimeFrame: Choose which timeframe you want Fibonacci levels to be based on. SetLabels: Visible/invisible Fibonacci level labels. Labels Position : Position of Fibonacci level labels (Right - Left - Middle). FontSize: Font size of Fibonacci level labels. c38: Color of level 38.2%.
It is the same of Advanced Arrow indicator but shows the signal of 8 currencies pairs at the same time on 5 Timeframes without any TPs line or SL. Features You will know when exactly you should enter the market. This indicator does not repaint it's signals. Signal Types and Timeframes Used You can use this indicator on any timeframes but i recommend you to use it on H1, H4 frames. The indicator gives you four signals (Ready to Buy "RBuy", Ready to Sell "RSell", Buy, Sell). When RBuy appear you
This indicator show you the begin of the Trend by drawing (Up/Down) arrow. It works using compatibility of current fame and the next 3 frames to make it more professional and more profitable. Features:- Simply it gives you entry point as arrow (Buy / Sell) after candle closed. You can use it on time frames ( M1 , M5 , M15 , M30 ) are more profitable. You can use it on any currencies pair. It is historical indicator. No Repaint. No additional indicator needed. Easy to use. Indicator parameters:-
Filtro:
homjung
194
homjung 2019.05.16 15:23 
 

O usuário não deixou nenhum comentário para sua avaliação

ABCD
241
ABCD 2017.12.30 21:59 
 

This is probably the most overrated indicator on MQL5. I fell for the many 5-star ratings it received early on, but I noticed afterwards that many of those ratings are from buyers who have given 5-star ratings to many other indicators and even some EA's. It begs the question, if these traders have so many 5-star indicators, why do they need to keep buying new ones? These are foolish individuals who get excited after a few successful trades and rush to give the indicator a high rating, and then when the losses pile up, they abandon it and go on to buy the next new indicator and repeat the same sad cycle over and over again. The lesson here is do not trust 5-star ratings from buyers who have not tested a particular indicator or EA for at least a few months.

Back to the indicator, my testing has shown me that this indicator is not profitable over the long term. The positive results that are posted in the Comments section are very selective, showing charts and EA results only from certain periods when there are breakouts with a good trend. Charts and EA results are not shown on a continuous basis since that would also reveal the many losses that occur when the market behavior changes.

Meshari alsafi Safi
167
Meshari alsafi Safi 2017.12.10 03:26 
 

للاسف مؤشر في الفترة الاخيرة خلال 8 اشهر اثبت فشله الذريع اشارات كثيرة كاذبة

وسبب لي كثير من الخسائر

يجب فلترة الاشارات في التحديث

Adam Goman
936
Adam Goman 2017.09.22 12:54 
 

15.9.17 - Enough. The advisor can not make a profit. All that he earns he loses.

10.8.17 - I recovered all the losses. Now profit began to grow. I continue testing.

6.7.17 - After all. Not good.

Jtrader
212
Jtrader 2017.08.09 00:49 
 

How people have been making profit is open to question...But for me and the many ,simply losses.

The fact the EA is free ,but loses money is no reason for appreciation .

Only performance should matter and constant losses = waste of money..sorry have to post such a review...

ahsanxm
122
ahsanxm 2017.07.13 13:34 
 

rrrrubbiishhhhhhh! don't bother please. all results are flukes and rely heavily on external indicators. EA does not perform well either, its all a fraud, go to your banks and get a chargeback.

asilkan
190
asilkan 2017.07.07 22:08 
 

If ea is not developed, We do not get good results..

Ted NO FX
1792
Ted NO FX 2017.07.05 22:53 
 

UPDATE 2: So far I do not see how this indicator EA can bring a stable profit. Only show myfxbook demo account. Author dont help me out about EA, seems he dont care of his buyers of this indicator. waste of time and money!

UPDATE: Author made EA with this indicator and EA doesnt even works, even on my pc or vps. He says everytime: Please make sure that you update the indicator to V8 , if you did , tell me and i will check. I have done that. Why make an EA that doesnt work? (yes he claims he is professional!)-------------------------------------------------------//-------------////////----------///----Very bad indicator, Does not give any real indication of which direction the market will move. Dont buy this crap Indicator. 1 star from me

TheSkylord
48
TheSkylord 2017.07.04 01:17 
 

O usuário não deixou nenhum comentário para sua avaliação

Md Tanvir Islam
34
Md Tanvir Islam 2017.07.03 18:51 
 

O usuário não deixou nenhum comentário para sua avaliação

Sohaieb Zayana
562
Sohaieb Zayana 2017.06.30 13:33 
 

I'm using the AA since 2 months. Unfortunately I wasn't able to use it regular as I had lack off time, but history candles shows the profits I would have made.

Being grateful Alfred released an EA free of charge for AA owner. Profit is less than it would be using it manually as some filters are still missing. But overall very good and stable AA.

Support worth more than 5 stars

Looking forward for new releases

Luis Plascencia
206
Luis Plascencia 2017.06.19 11:08 
 

Good job Alfred!! Thank you!!

Ravi Luke
643
Ravi Luke 2017.06.10 15:35 
 

Great indicator if you use some judgement of your own. Thanks!

Norbert
111
Norbert 2017.06.09 21:43 
 

Well done Alfred. thank you.

Yuan Liu
1129
Yuan Liu 2017.06.05 14:04 
 

AA EA is good, you need test and optimize by yourselfe.

Mohamed Alghedefe
1750
Mohamed Alghedefe 2017.06.01 21:55 
 

O usuário não deixou nenhum comentário para sua avaliação

alejoarcilacano
264
alejoarcilacano 2017.06.01 05:27 
 

Amazing product! The EA is even better! Very profitable and recommended!

Vincent Visoiu
958
Vincent Visoiu 2017.06.01 00:57 
 

By itself the indicator gives way too many false signals to be profitable even with the rules correctly applied. So I stopped using it altogether for manual trading. Alfred released the EA that applies the rules 100% properly and the 99% backtests show that the EA is not profitable enough to be used on a live account. Developer does not believe in 99% backtests (yes he claims he is professional!) so he will not improve the EA before release. Very frustrating to deal with such a backwards thinking person. At this time I don't recommend the indicator to anyone since it cannot possibly be profitable on a live account due to the many false signals and losses. You win 1 lose 2, win 1 lose 3 etc. Clearly you can see with the rules applied 100% in the EA the tests are not good as will the live performance. It is only profitable for the seller. I will update my review if anything changes.

Chin Kean Wei
316
Chin Kean Wei 2017.05.31 07:27 
 

Great stuff worth using... reduce the stress in trading as all the system has provide Buy SL and TP with logic... great stuff

Ertac Hassan
1897
Ertac Hassan 2017.05.26 10:53 
 

Great support

123
Responder ao comentário