ECM Channel MT4
- Indicadores
- Versão: 1.0
- Ativações: 10

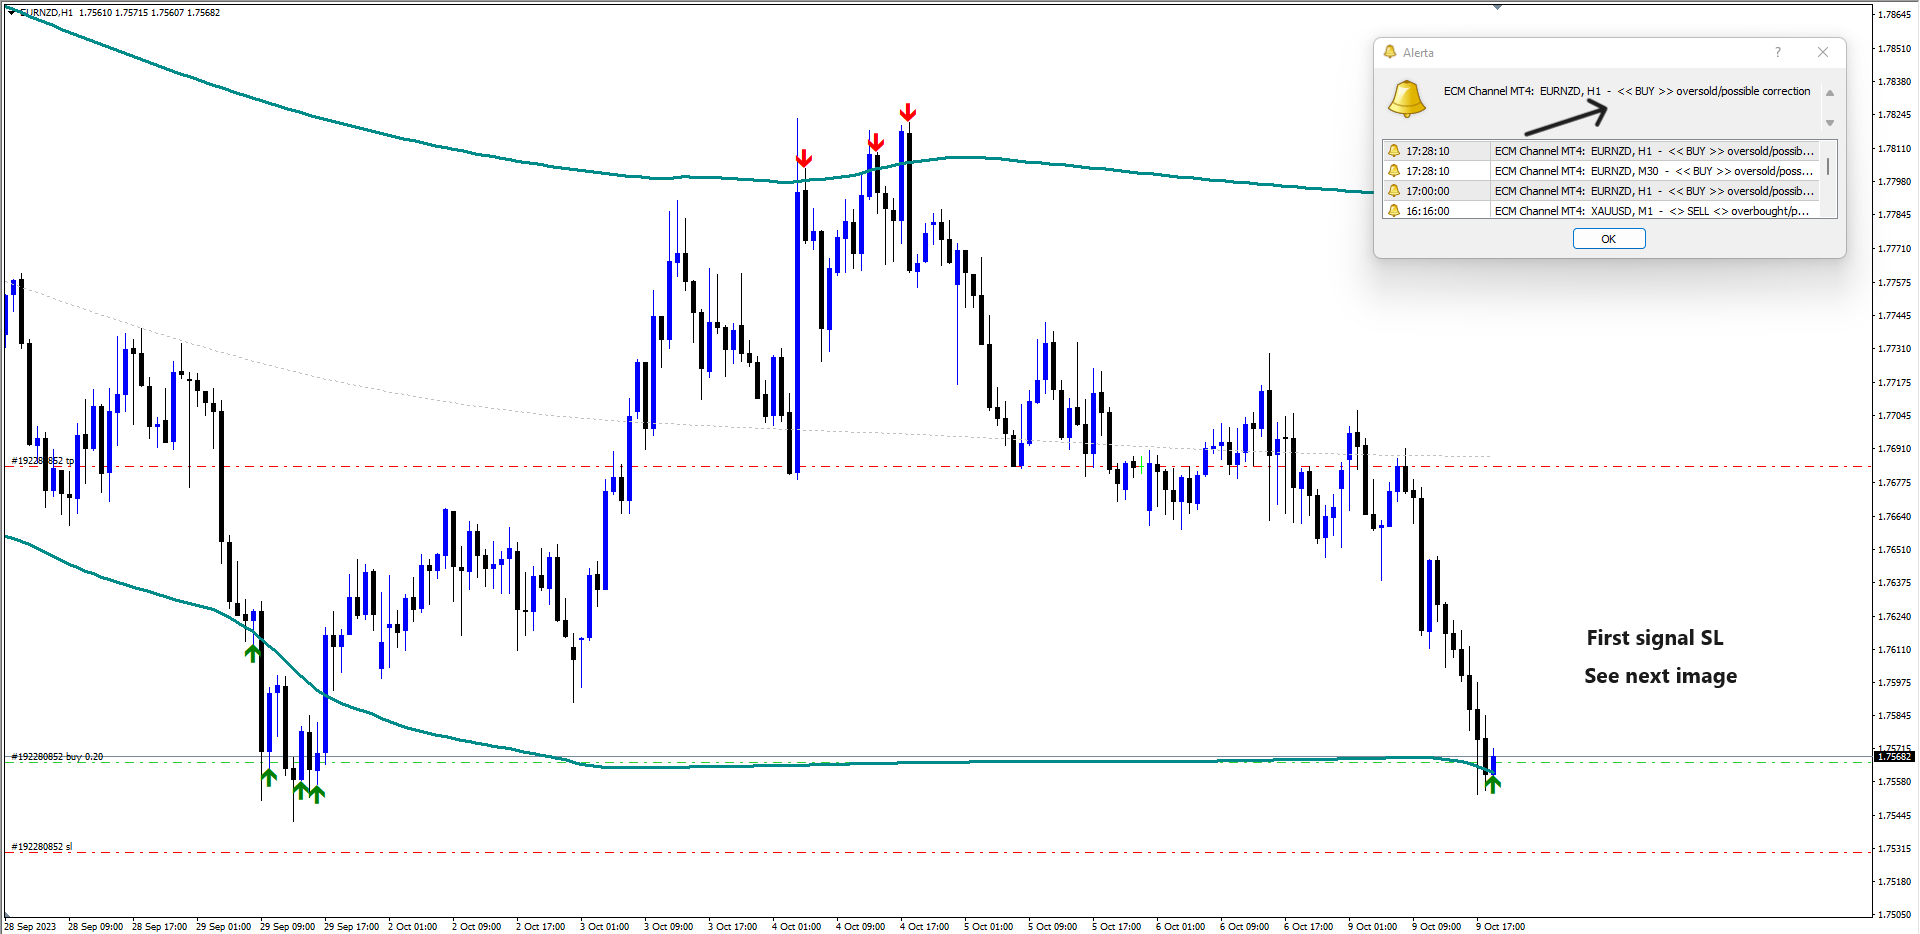
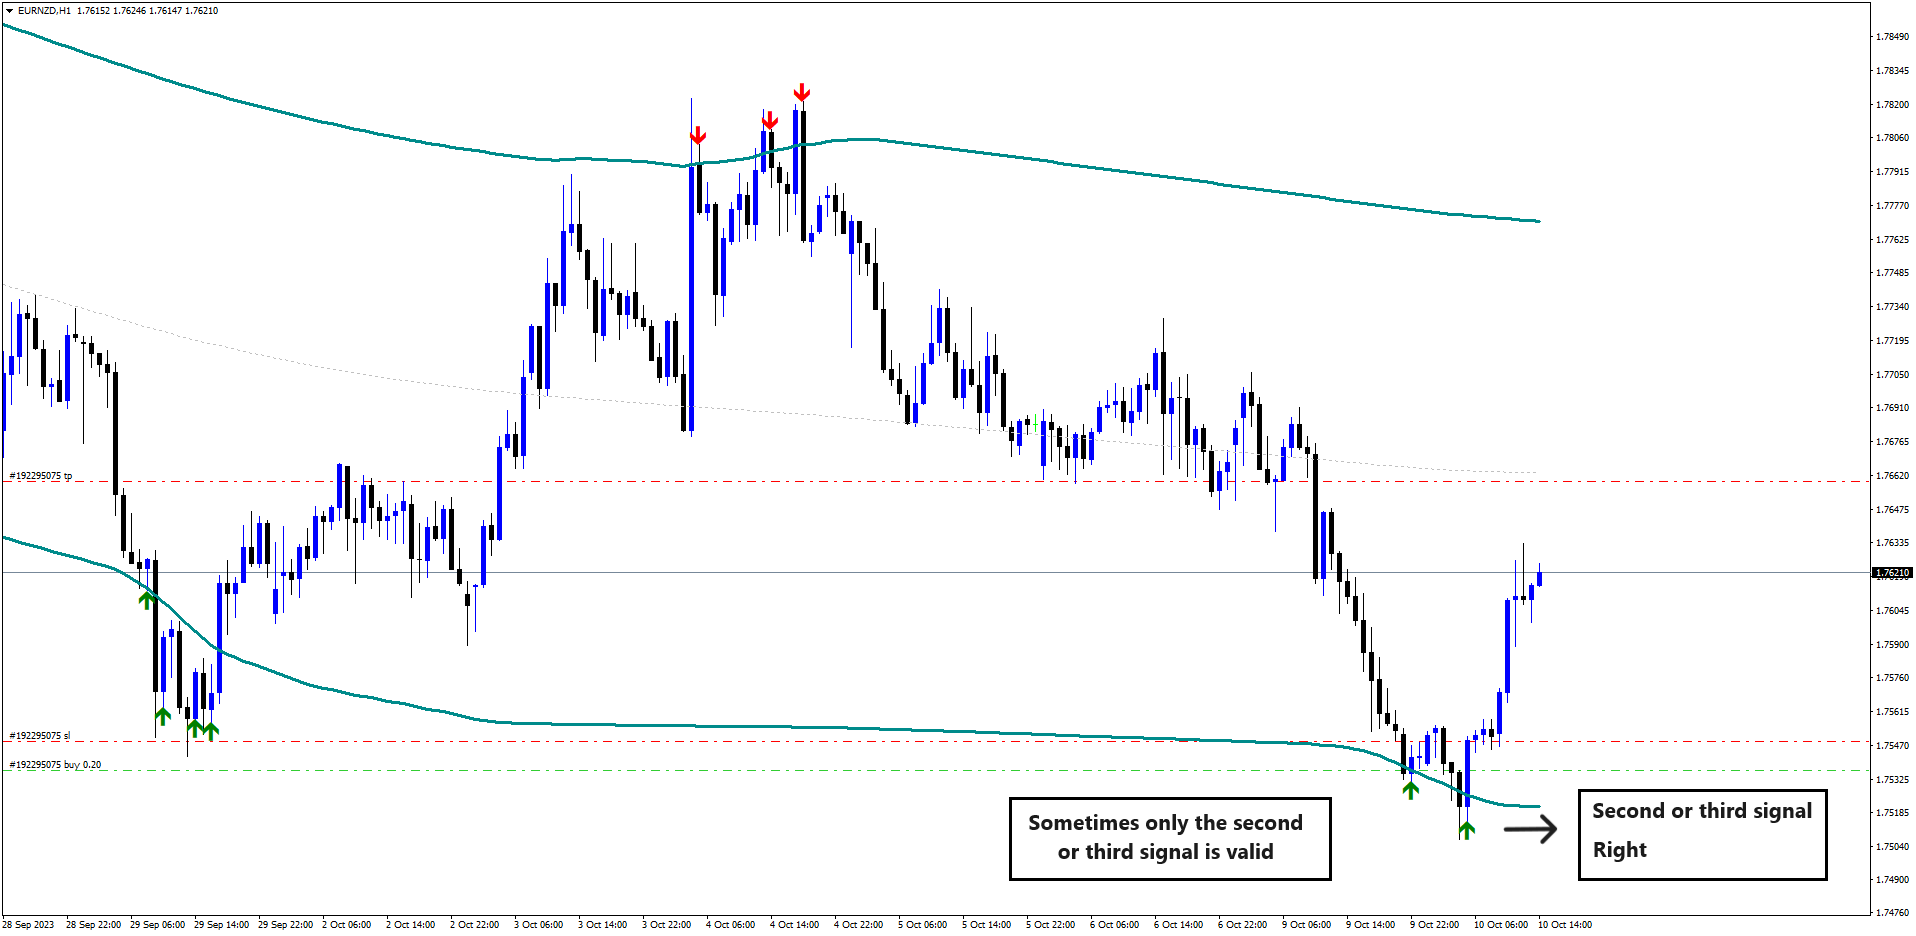
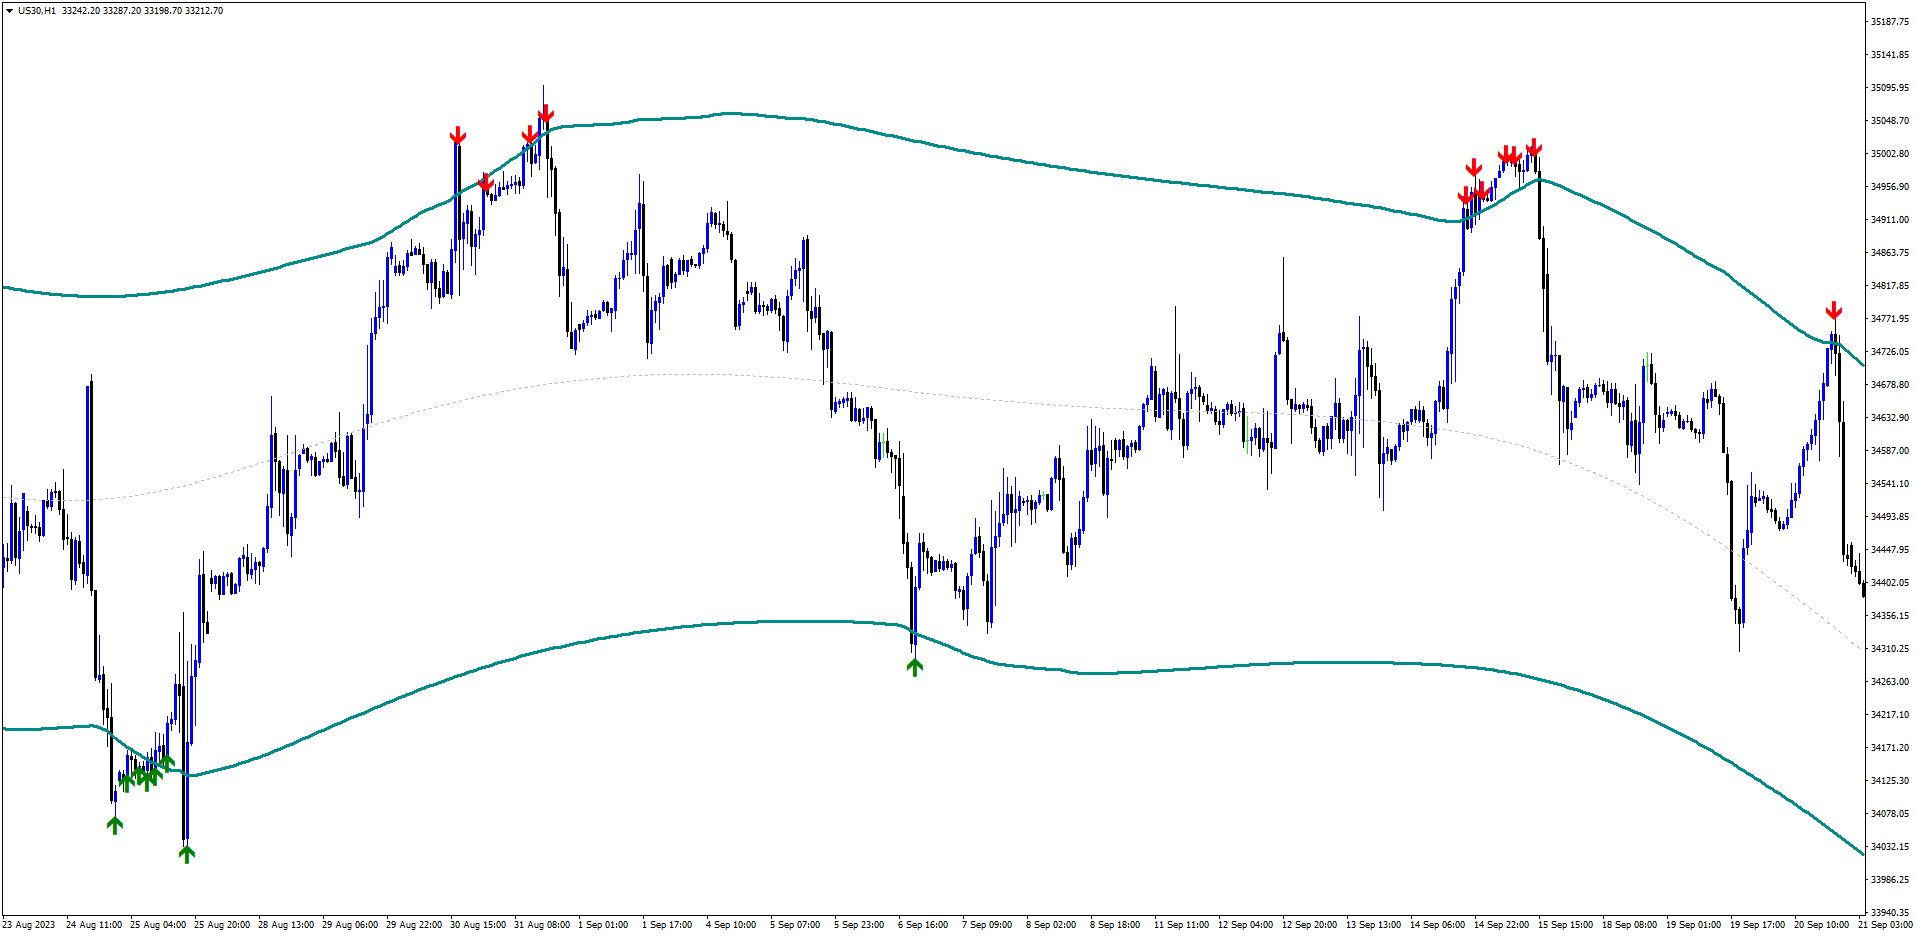
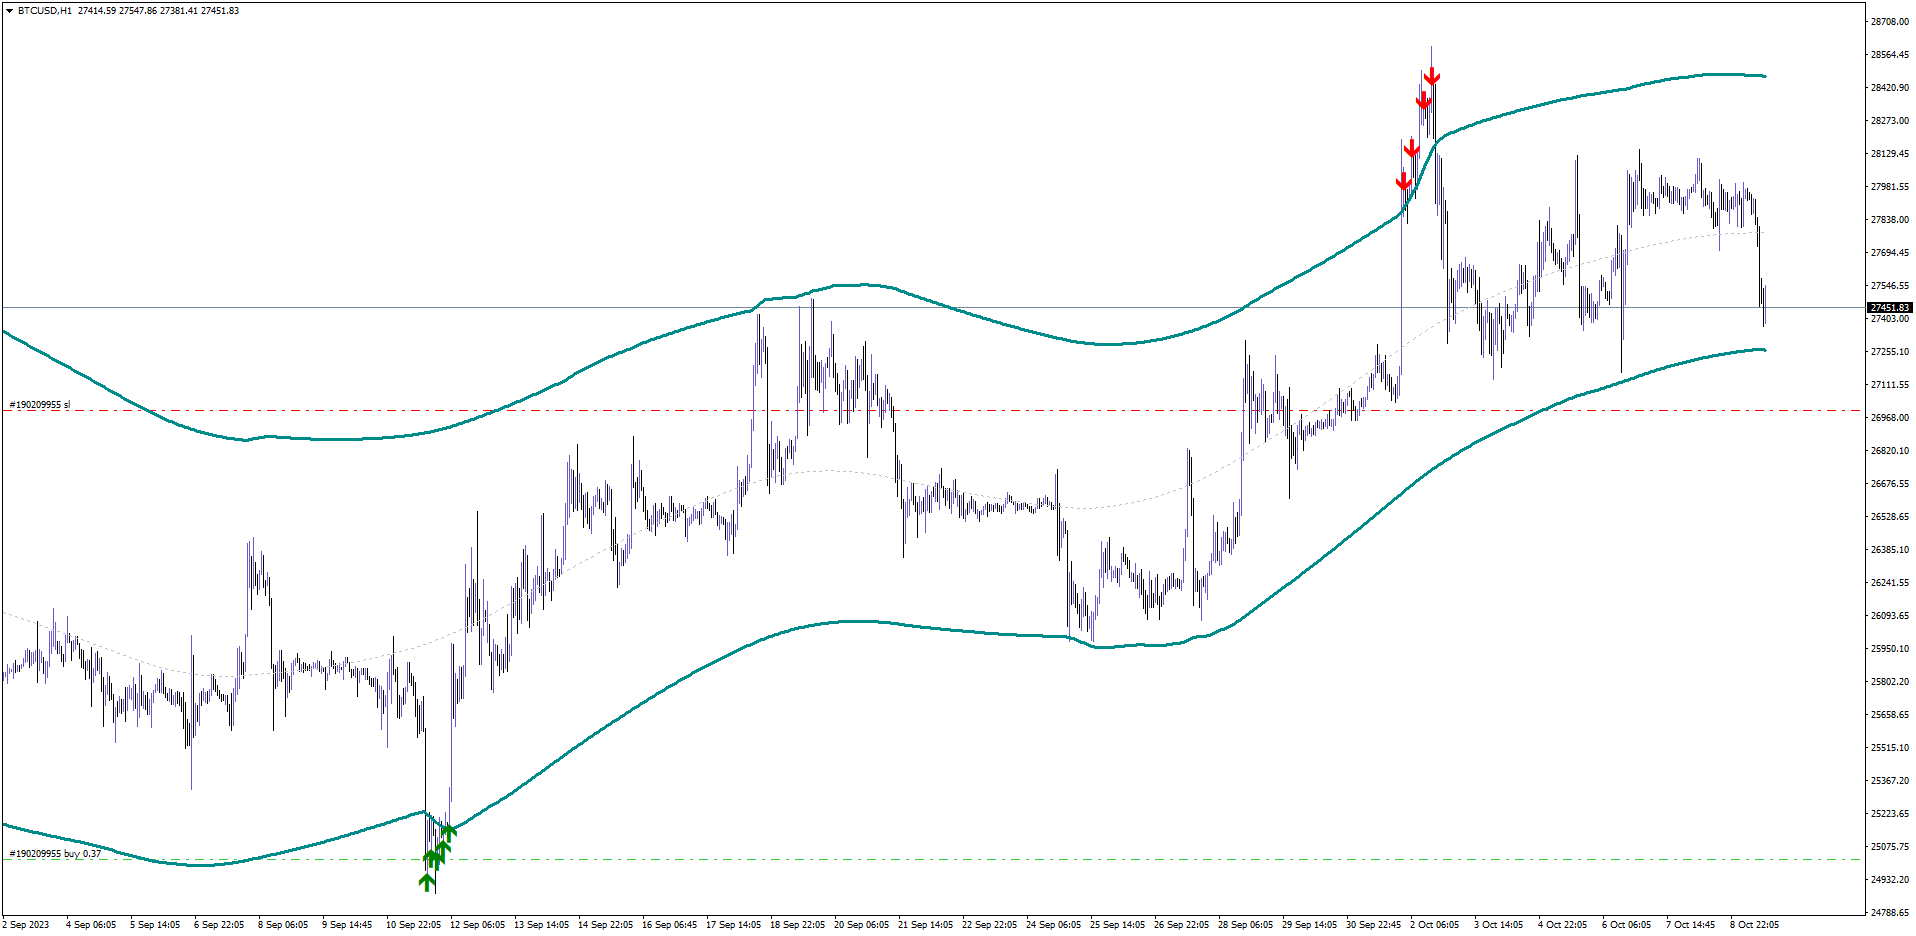
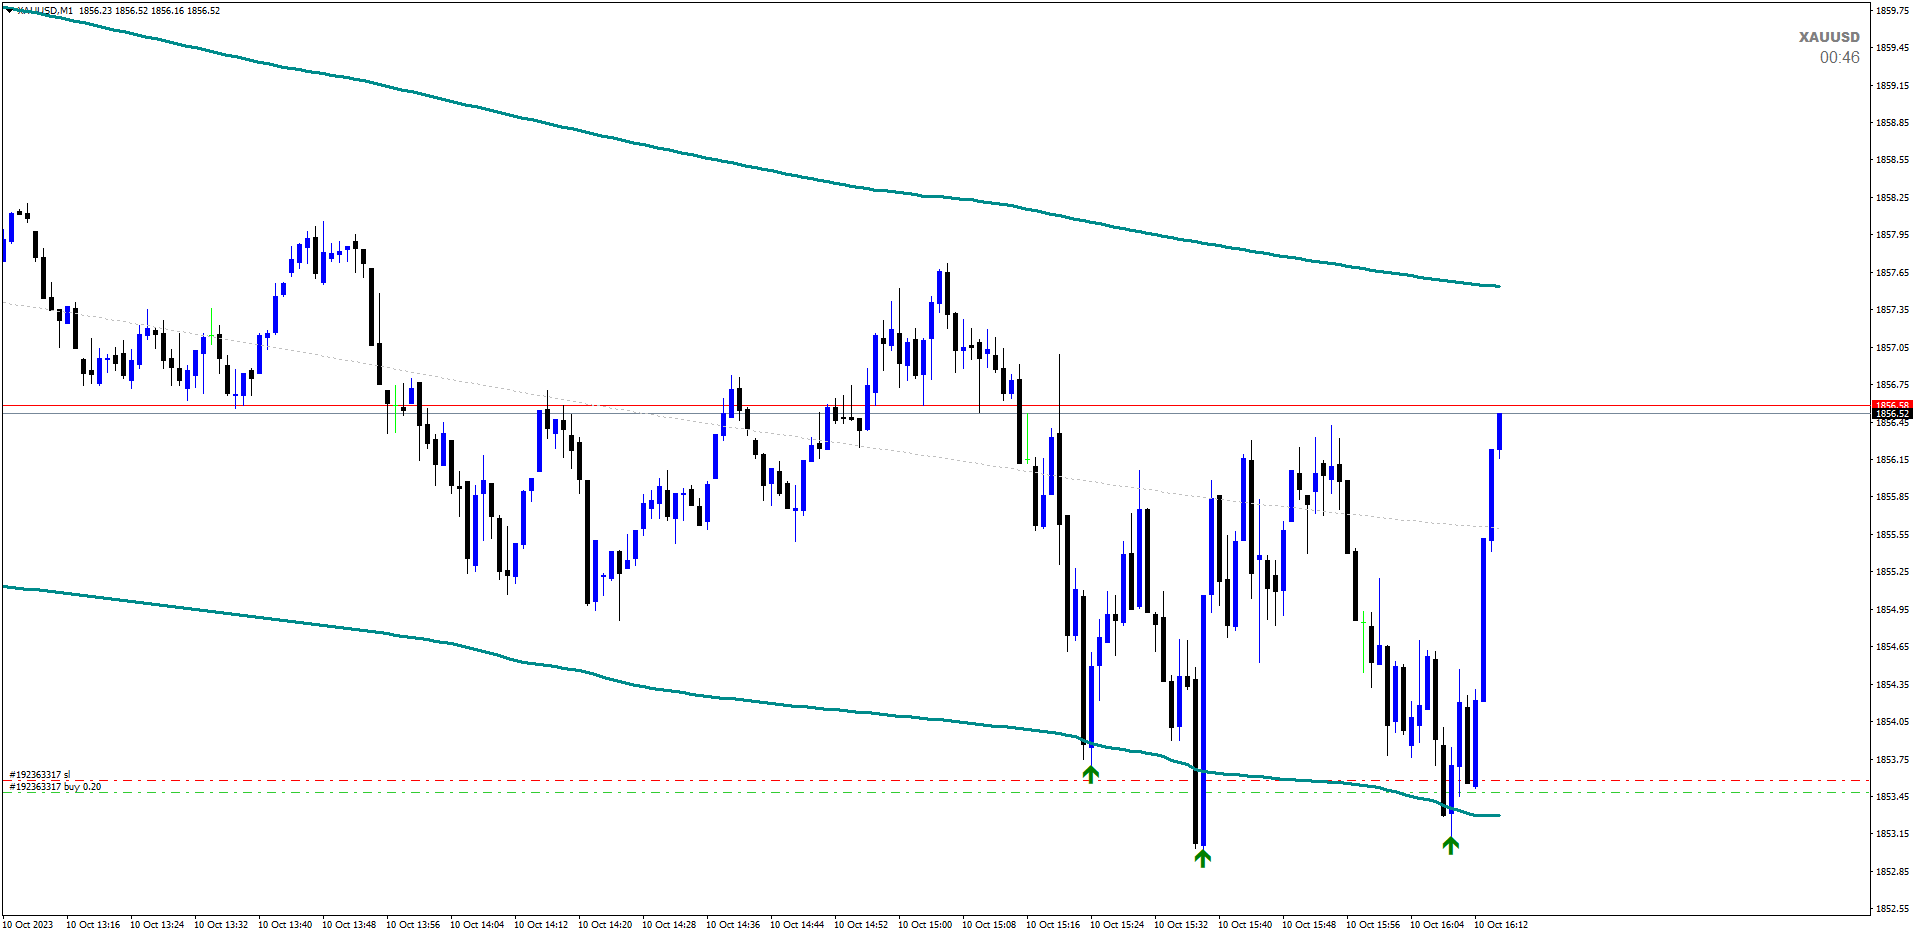
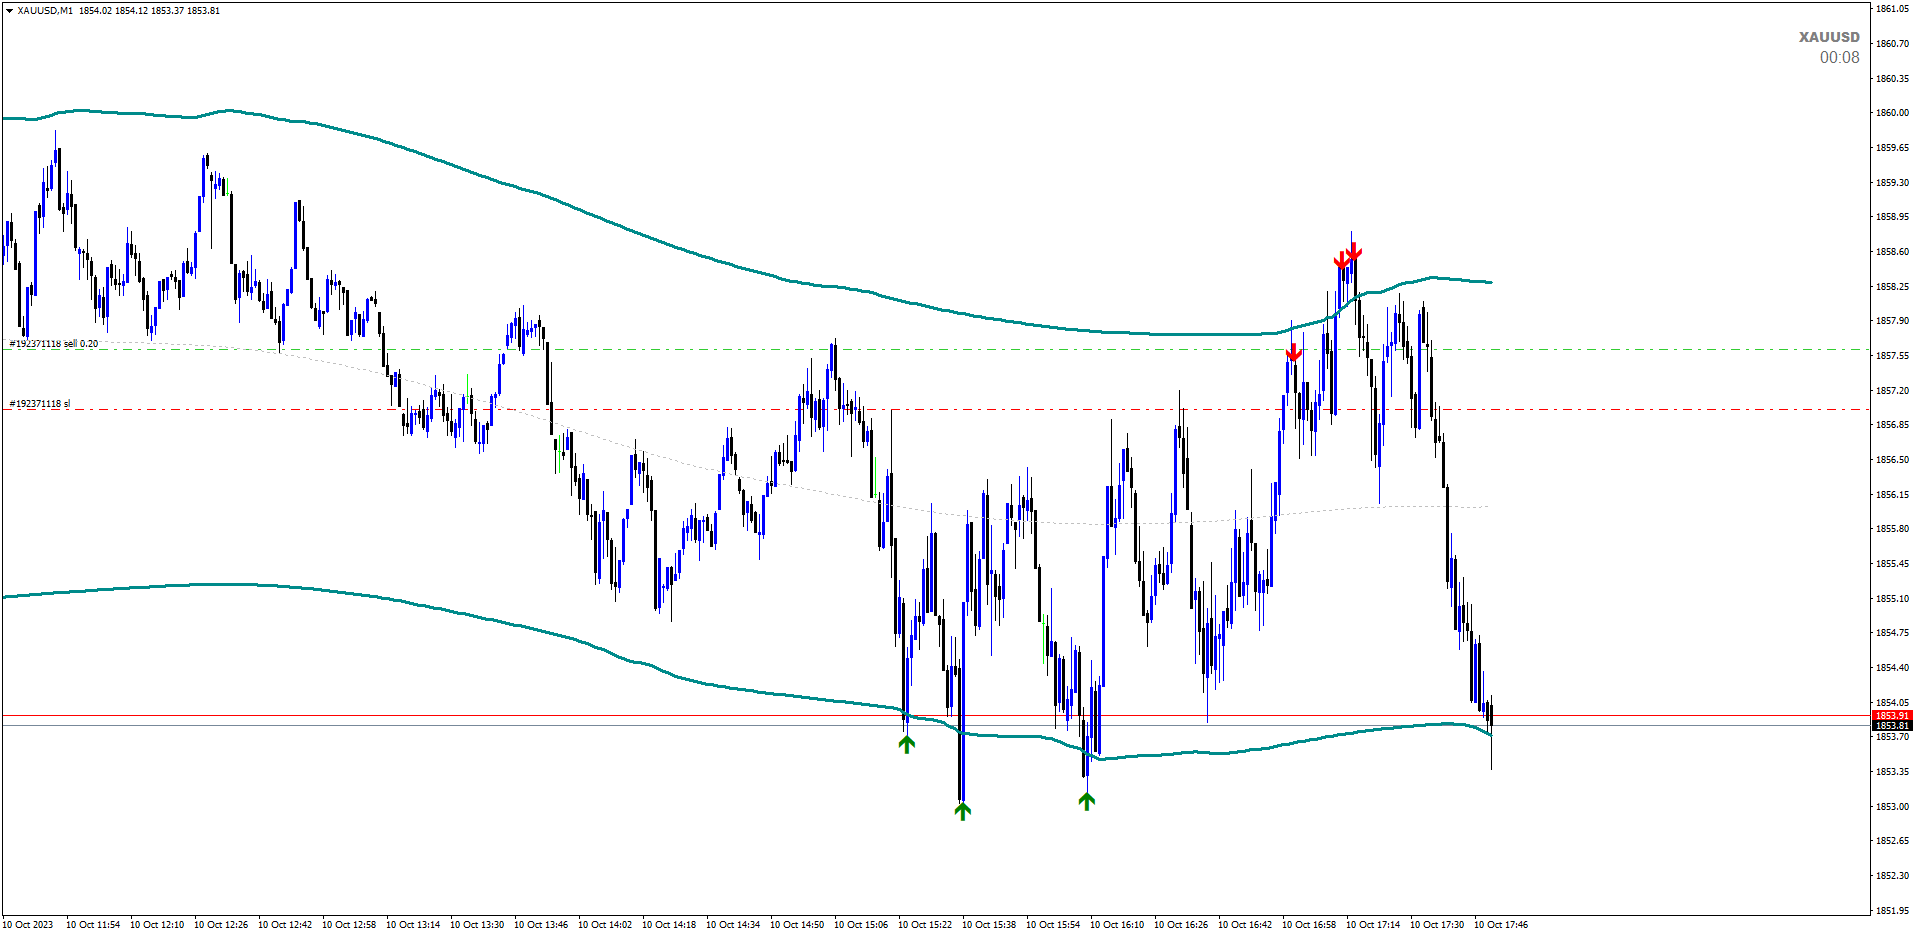
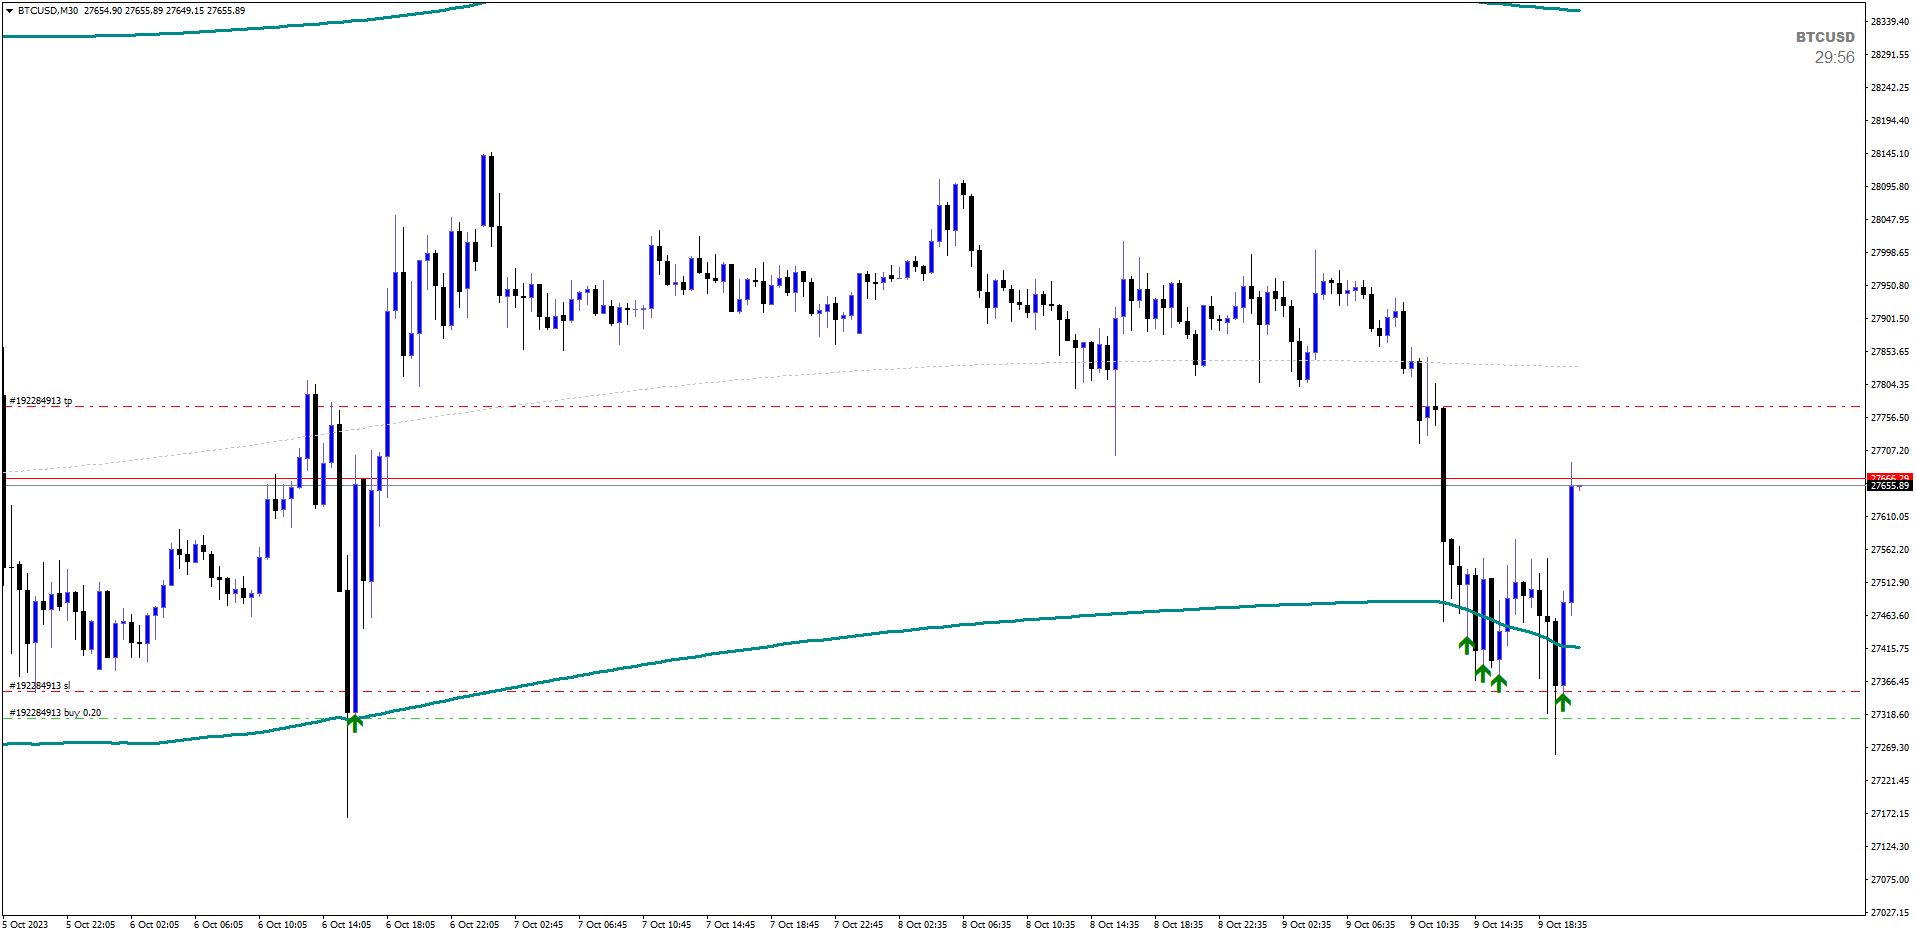
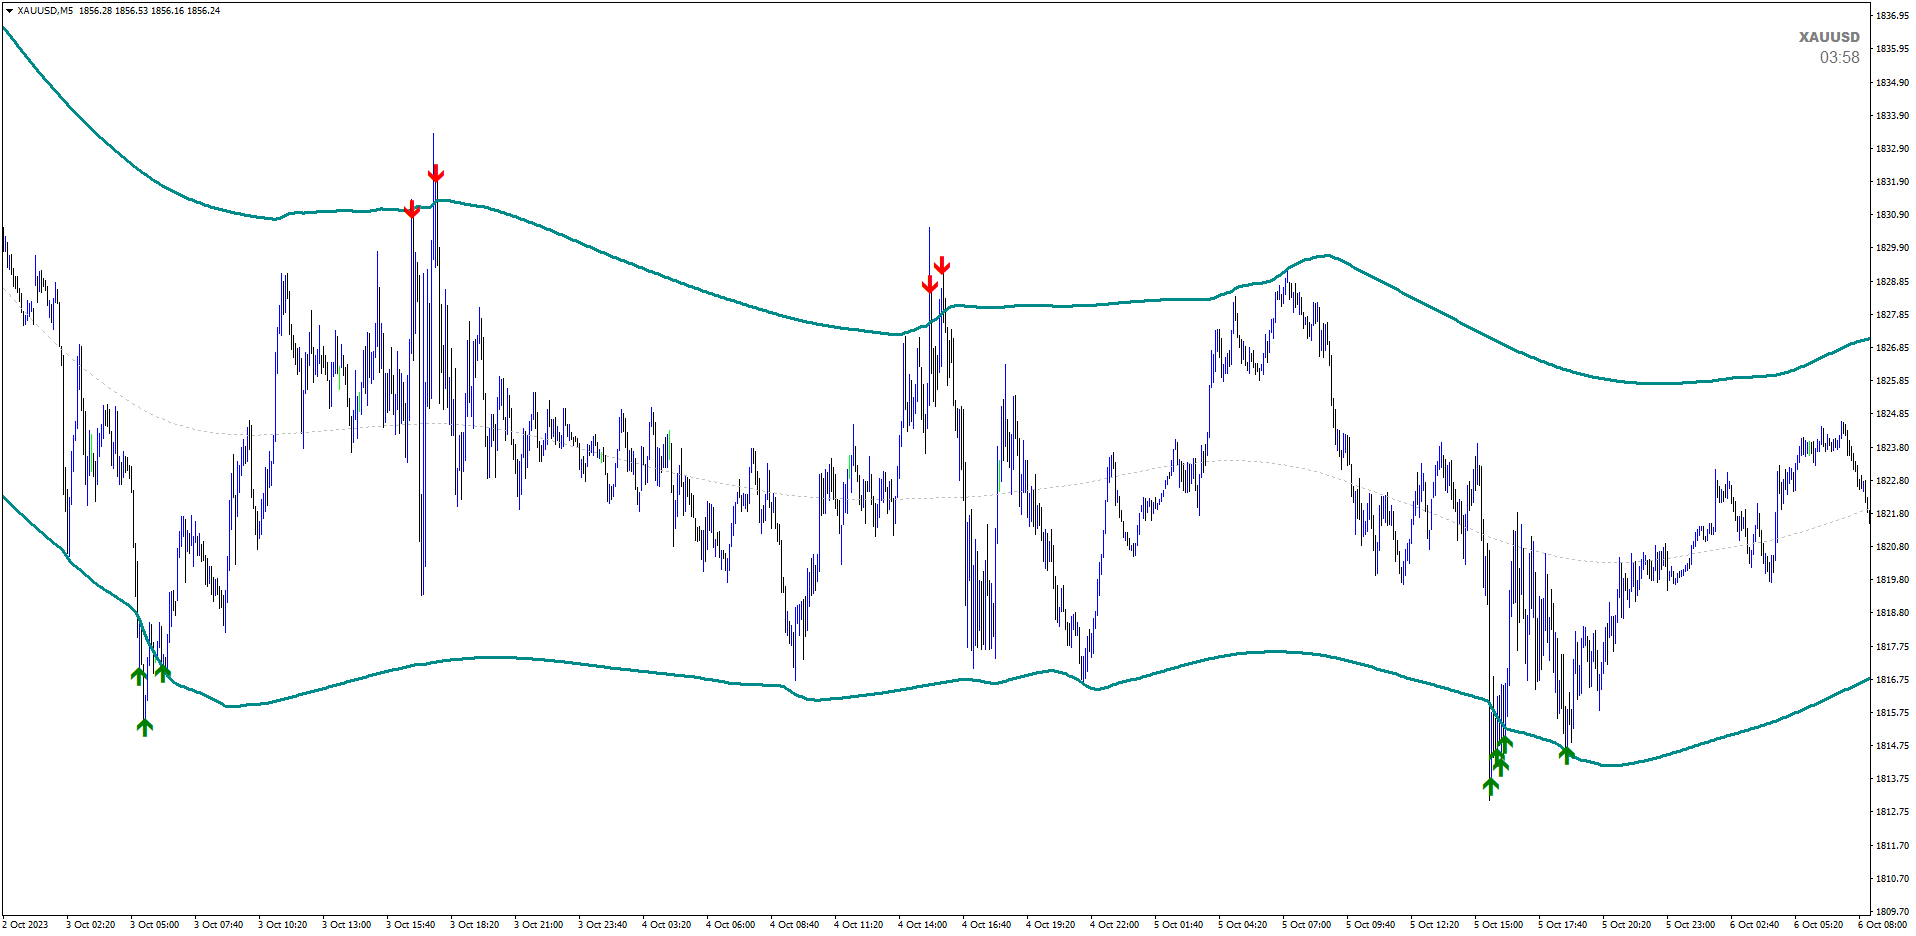
ECM Elite Channel é um indicador baseado na volatilidade, desenvolvido com um algoritmo de tempo especifico, que consiste em encontrar possíveis correções no mercado.
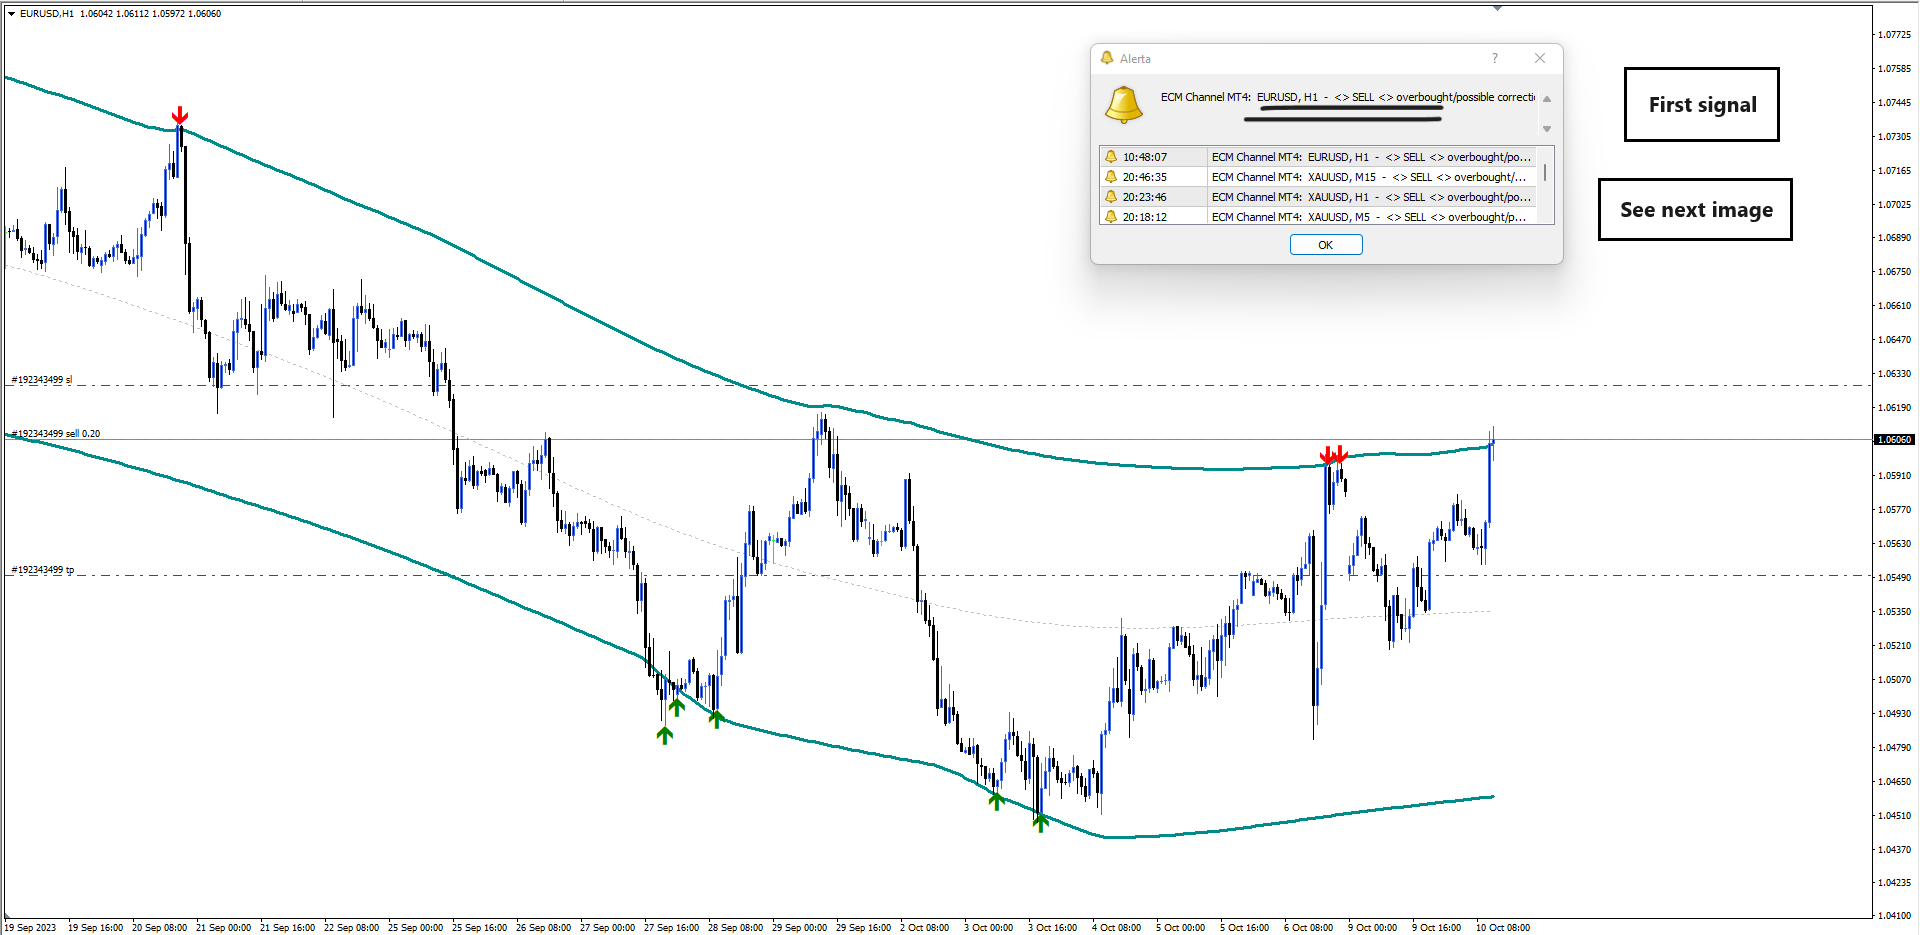
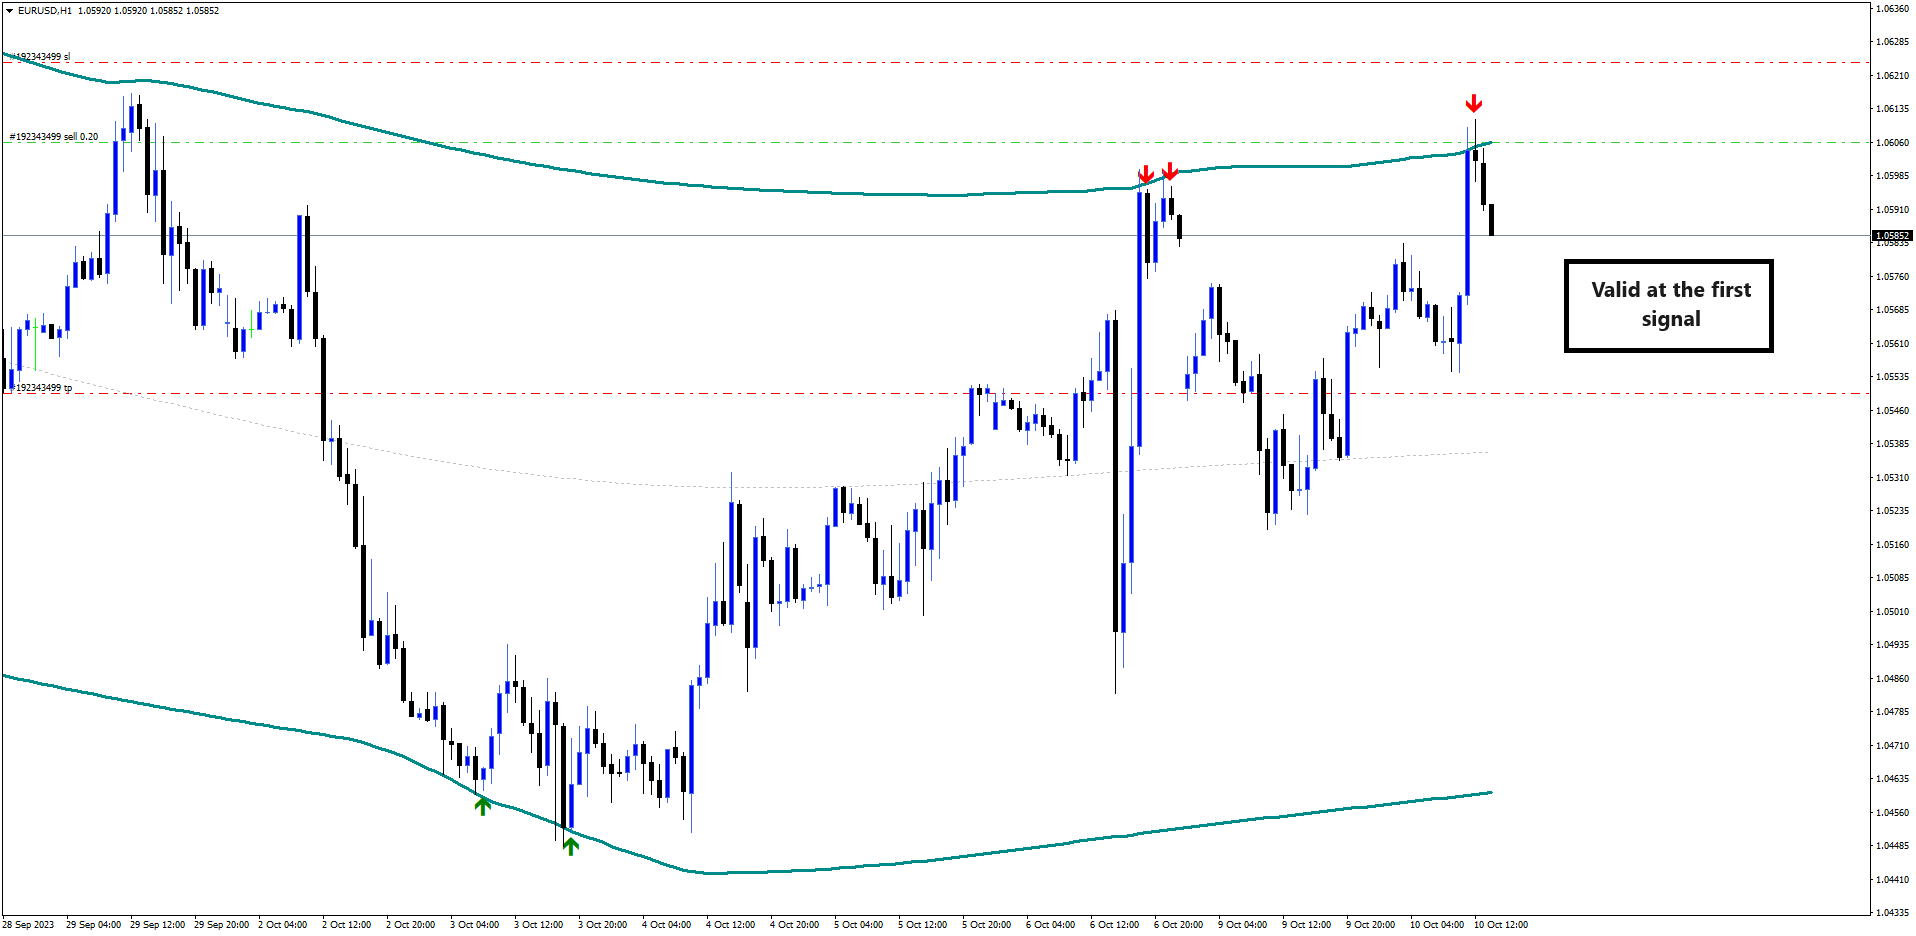
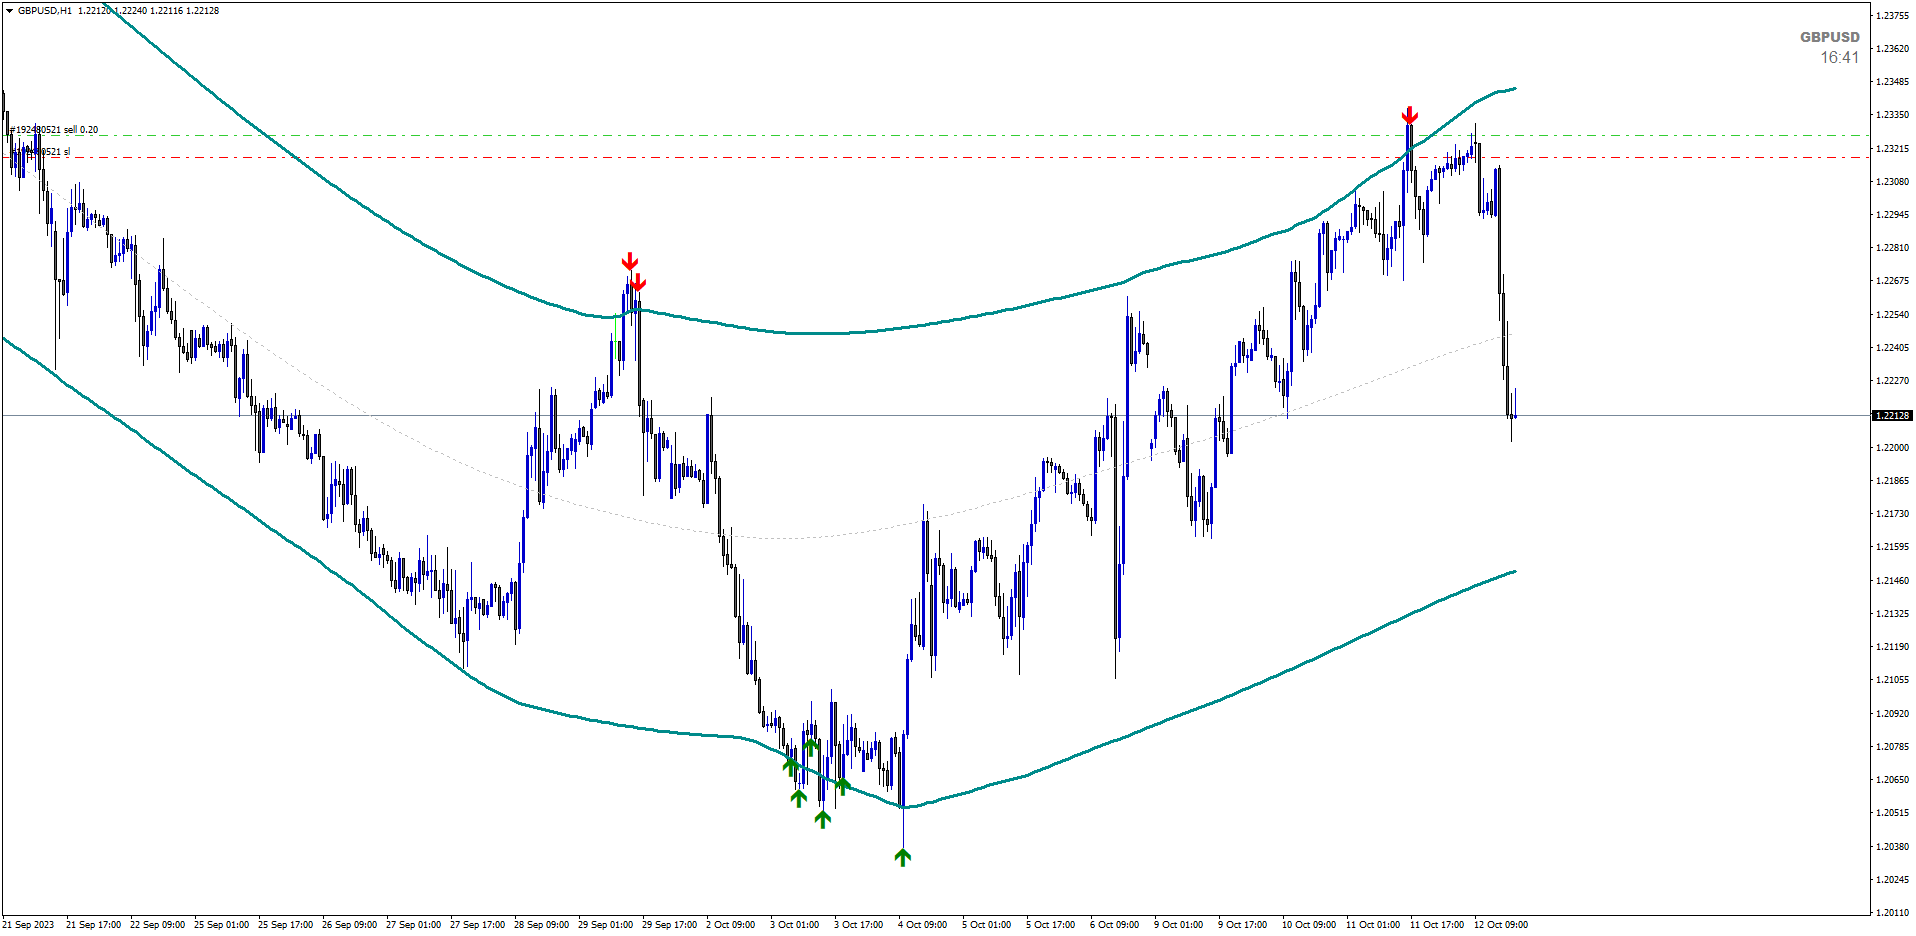
Este indicador mostra duas linhas exteriores, uma interior (linha de retração) e um sinal de seta, onde a teoria do canal consiste em ajudar a identificar condições de sobrecompra e sobrevenda no mercado.
O preço do mercado cairá geralmente entre os limites do canal. Se os preços tocarem ou se moverem para fora do canal é uma oportunidade de negociação.
O indicador dá-lhe um sinal numa possível inversão. Quando o preço esta próximo da linha superior, o mercado é considerado sobrecomprado, quando esta próximo da linha inferior, é considerado sobrevendido.
É um sistema de negociação pronto a usar para negociar em qualquer instrumento.
Esta ferramenta simplifica a análise dos mercados financeiros e revela-se o braço direito do trader.
O ECM Elite Channel é uma ferramenta visual e intuitiva, fácil de compreender e de utilizar.
Informação
Utilização do canal:
M1/M5 ( Scalping/mais oportunidades/mais ruido)
M5 (Scalping/negociação diária)
M15/M30/H1 (melhores janelas M30/H1 mais precisão)
H4/D1 (negociações longas/menos oportunidades)
PS: Deixe o seu comentário e a sua avaliação
Boas negociações!
Autor
Paulo Rocha todos os direitos reservados
O usuário não deixou nenhum comentário para sua avaliação