Th3 BarPlay Signals Mt4

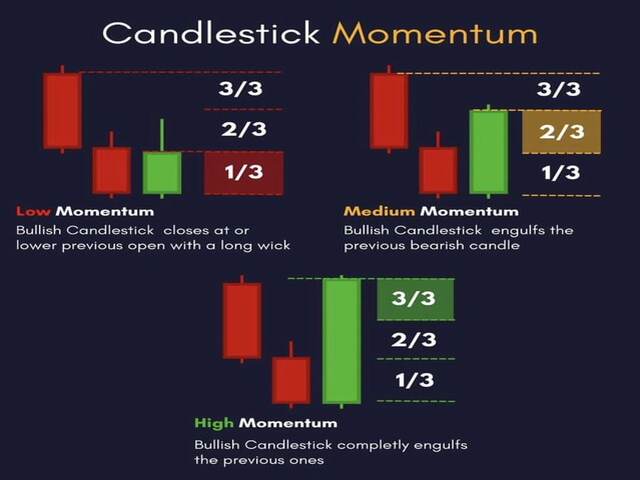
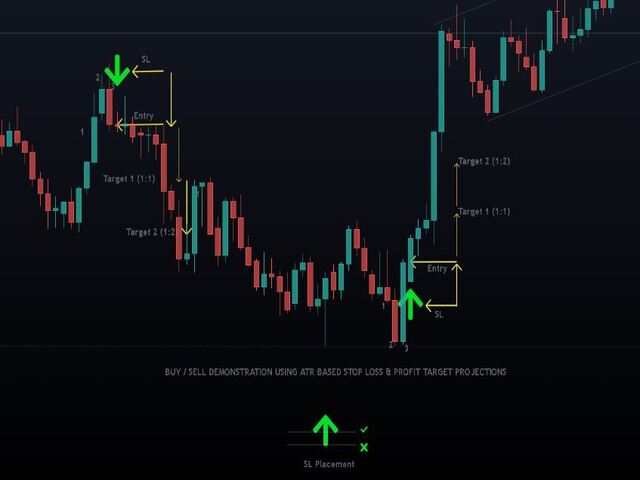
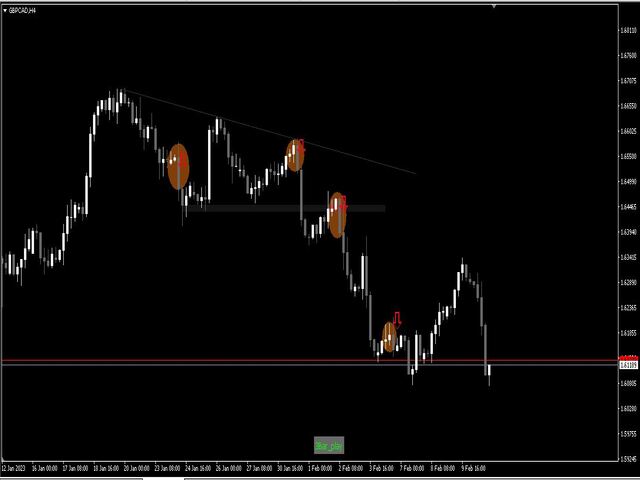
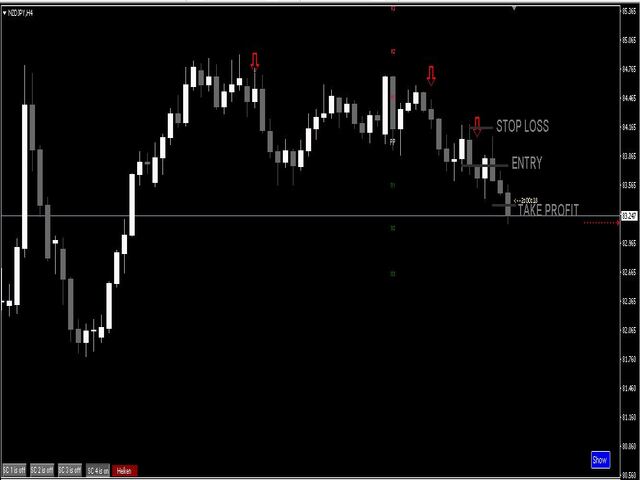
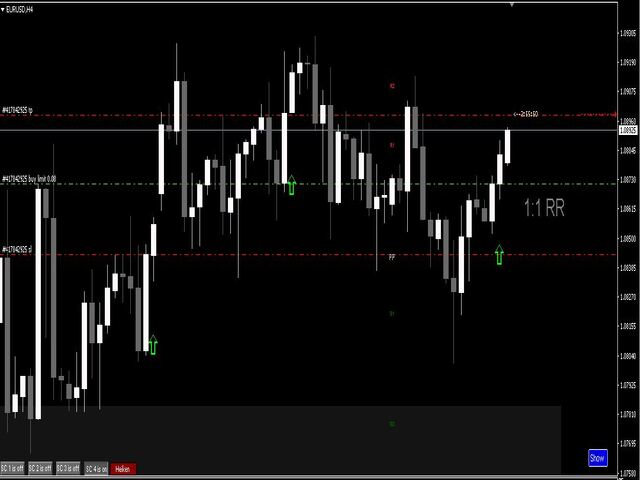
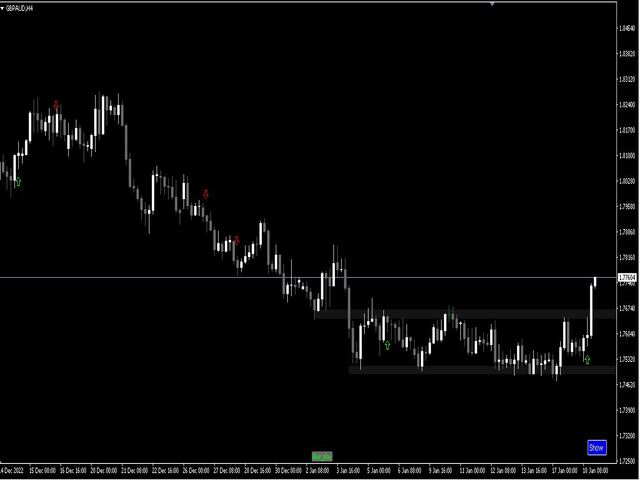
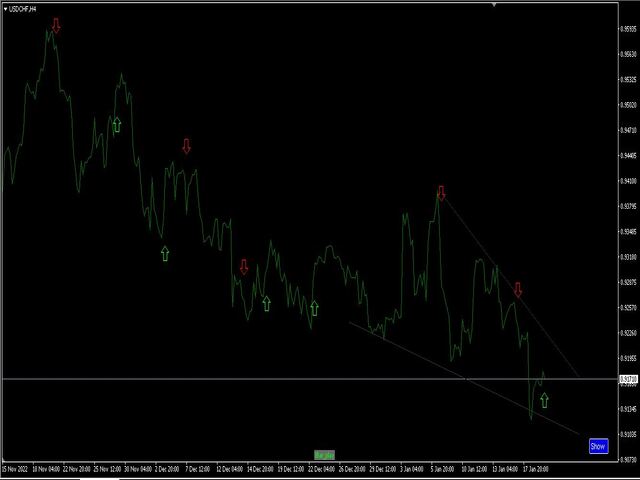
これは 3Bar_Play として知られるプライス アクション ベースの戦略であり、3Bar ローソク足パターンの形成に基づいています。買い/売りシグナルの矢印をポップアップする前に、フィルターと確認のために追加のインジケーターが追加されます。上昇トレンド、下降トレンド、または横ばい市場のいずれかで取引できます。 追加された指標は次のとおりです。 確率的 - モメンタム フィッシャー - トレンド ATR - シグナル矢印のベースでのストップロスの配置も明確に定義するボラティリティ。 報酬に対するリスクは、1:1 から 1:4 のいずれかになります。 買い - 2 つの弱気バーと 1 つの強気バーの後に買いシグナルがポップアップする場合。 売り - 2 つの強気バーと 1 つの弱気バーの後に売りシグナルがポップアップする場合。 追加機能 - チャート上のシグナルをオン/オフするためのトグル ボタン。 非常に使いやすいインジケーターで、すべての市場に対応しています。 注意 インジケーターが表示されない場合は、私に連絡してカスタム インジケーター (Fisher) をインストールする必要がある場合があります。


おすすめのプロダクト
チャートを構成し、周期的な価格変動を識別するテクニカル指標。 どのチャートでも動作します。 いくつかの種類の通知。 グラフ自体に追加の矢印があります。 履歴を再描画せずに、キャンドルのクローズに取り組みます。 M5以上のTFを推奨します。 パラメータの使用と設定が簡単です。 異なるパラメータを持つ 2 つのインジケーターを使用する場合、他のインジケーターなしで使用できます。 入力パラメータは2つあります 周期性と信号持続時間 これら 2 つのパラメータは、チャート構造の処理を扱います。 Cyclicity - 反転サイクルが変化する頻度を調整し、サイクルを滑らかにします。 Signal duration - 最小数では価格変動の衝動を検出し、最大数では長期的なトレンドの動きを検出します。
PTW NON REPAINT TRADING SYSTEM + HISTOGRAM Non-Repainting ,   Non-Redrawing   and   Non-Lagging  Trading System. Does the following: - Gives Accurate Entry and Exit Points - Scalping, Day and Swing Trading  - 95% Accuracy  - Targets, where to take profits. - Shows Trends, Support and resistance levels - Works on All Brokers - Works on All Currencies, CFDs and Stocks - It does not place trades for you, it only shows you what trades to place. - It works on All Timeframes - It is for Trend or ran
一言でいうと このインジケーターは RSI と MACD という2人の専門家を1つにまとめたもの です。2つのチャートを別々に見て判断する代わりに、両方が同意したときだけ「買い」または「売り」の矢印を表示します。 矢印は再描画されません 。一度出現すれば、そのまま固定されます。 「コンボ」の意味 通常、トレーダーは RSI(値動きの勢い)と MACD(トレンドの方向)を別々に見ます。しかし両者が矛盾することも多いです。 このインジケーターでは、 両方が同時に同意したときのみシグナル を出します。これにより、多くの偽シグナルが排除されます。 画面で見えるもの 価格チャートとは別のインジケーターウィンドウ 青と赤の矢印 —— そのまま使えるシグナル 拡大表示された MACD ヒストグラム(見やすく強調されている) RSI と MACD のラインも表示されるが、注目すべきは矢印 こんな人におすすめ 初心者 —— 2つのインジケーターを別々に解釈し、矛盾に対処する必要がない 経験者 —— シグナルの高速フィルタリングと、再描画しないクリアなロジック 迷いたくない人 —— 「買い」「売り」「待て
This indicator gives fewer signals but precise when it does. Its a little scaled down version of ControlEdge Fx indicator , that gives less number of signal with less precise. If you want one the gives more signals and more accurate in catching larger trends you might want to check out ControlEdge Fx in this link  https://www.mql5.com/en/market/product/175731 Enter Buy when the Blue Arrow appears  Exit Buy when the Red X sign appears Enter Sell when the Red Arrow Appears    Exit Sell when the
FREE
The Strong Volume Trend  MT4 indicator is a powerful tool designed to help traders identify and capitalize on significant volume trends in the financial markets. With its advanced algorithm, this indicator accurately detects the strength and direction of volume movements, allowing traders to make informed trading decisions. Features: Volume Strength Analysis: The indicator analyzes the volume data and identifies strong volume trends, helping traders spot potential market reversals, breakouts, or
Developed methods for trading collected in one indicator. In the form of arrows, it defines entries in the direction of the trend. It has 2 types of arrows - trend and signal guides, informing about the potential movement in the direction of the trend. Works without redrawing, ready for use on all symbols/tools. The most suitable time frames to use are M15, M30, H1, H4. How to use The indicator finds the direction of the trend in the form of a signal arrow, a graphic rectangle stretches along
Trend surfer is indicator based on volume calculation in combination with algorithm that recognize trend changes . For aditional filtering, user can choose from 3 different oscillators, or can use their combination. Basic idea of indicator is to give signal when current volume is above value defined as Volume MA period*Volume MA multiplier, and trend change algorithm detects start of new trend wave. When all conditions are met and new trend wave is detected, indicator plot arrow on chart. Arrows
Introducing the Accumulated RSI,  your ultimate tool for precise trend identification and momentum analysis in the world of Forex and financial markets. This cutting-edge MetaTrader 4 (MT4) indicator, designed for traders seeking unparalleled insight and accuracy, empowers you to make well-informed trading decisions like never before. Features Accurate Trend Detection: The Accumulated RSI utilizes the Relative Strength Index (RSI) in an innovative way to pinpoint the prevailing market trends wit
This is an arrow indicator for binary options. It does not redraw, arrows do not disappear. The indicator implements an optional tester for visual monitoring of the number of signal and win rate. Does not require adjustment or fitting. Works on all pairs and gold. The signal appears at the close of a candle. Entry is made on the next bar. Optional alert. For trading with robots, there is a setting for the number of bars in history. If 0, the entire history is used. The EA operation time: 24/5 Wo
Using multiple timeframes for analysis with Multi Timeframe Average Directional Index  can provide several significant benefits for traders: Comprehensive Market View: By applying Mtf ADX Standard across different timeframes, traders gain a broader perspective on market dynamics. This allows them to identify trends, patterns, and potential reversal points that might be more apparent or consistent across various scales. Enhanced Pattern Recognition: Multiple timeframes help in identifying repeati
FREE
Overview Happy Kangaroo is a trend-following tool designed to identify market direction and provide high-probability entry signals based on volatility. By combining price action with the Average True Range (ATR), it visualize a dynamic support and resistance level of the price.     Key Features   The indicator's power lies in its customizable parameters and mathematical precision:  Dynamic Trend Detection: Uses the ATR period and factor to calculate the volatility bands. It identifies an Uptrend
What is the Super Ichi Indicator? Super Ichi is an advanced combination of Ichimoku Kinko Hyo and SuperTrend indicators. This powerful technical analysis tool is designed to identify market trends and generate trading signals. What Does It Do? Dual-Level Trend Analysis : Uses customized versions of Tenkan-sen and Kijun-sen lines Automatic Signal Generation : Displays visual markers (arrows) at crossover points Real-Time Alert System : Provides audio and visual alerts when new signals occur Dynam
FREE
SFO Trend Racer system is a trend indicator created by the CEO and Founder of " Simple Forex Options ", Tevin Marshall . It serves 6 different functions all in one. It shows the trader the entry signals as well as exit signals, whether it is a take profit or a stop loss. It also uses trend filters and signal confirmations so that the trader is able to make the most logically fit decision. Trend Racer uses various filters and specific settings from a plethora of indicators. The beauty in this ind
製品説明 CM Ultimate MA MTF V2は、MetaTrader 4専用に開発された、高度に最適化されたデュアル移動平均テクニカル指標です。1つのチャート上に2つの独立した移動平均線(短期と長期)を表示し、市場の勢いの変化を瞬時に追跡できる適応型3色トレンド表示機能を備えています。 高性能なマルチタイムフレーム(MTF)テクノロジーを採用することで、トレーダーはタイムラグを発生させることなく、ノイズを除去したクリーンなトレンド方向を把握できます。 主な技術的利点 厳密な4バッファアーキテクチャ:データプロット用2バッファとカラーインデックス用2バッファ、合計4つの内部インジケーターバッファで構成されており、MT5のレイアウトアーキテクチャに完全に準拠しています。 デュアル移動平均線のコンフルエンス:2つの主要トレンドラインを使用して市場のノイズを除去することで、チャートを簡素化します。 Ultimate MA 1(短期):プロット幅4(実線) – 短期的な価格変動に高い感度を持ち、正確なエントリータイミングを狙うために設計されています。 アルティメットMA 2
FREE
Adaptive Tick Impulse Momentum Meter PRO Institutional Non-Repainting Momentum Engine for MT4 The Adaptive Tick Impulse Momentum Meter PRO is an advanced institutional-style momentum and speed detection indicator designed for traders who want to identify explosive market moves before they fully develop. Unlike traditional indicators that rely on lagging averages or simple candle analysis, this engine combines: Tick imbalance analysis Adaptive volatility intelligence Momentum acceleration Kalman
Note : The slow loading of the indicator issue has been addressed . This new version loads fast and does not slow the platform. Version 1.3 : We have updated the indicator to include an historical bar scanning option . So instead of scanning all bars in the history (which can make the indicator slow sometimes ) , you can select the maximum number of bars it can scan which can increase the performance and make the indicator faster. This indicator scans the 1-3 Trendline pattern . The indicato
Some informations on the chart with the single attachment. RangeBorder Buy Sell (RBBS) Non Repaint Indicator will provide trend line, buy sell arrows,reversal arrows, range channel, order exit area,high average price line and low average price line.All arrows and lines don't repaint and not lagging. Once candle closed it won't  repaint. Reading Indicator: 1. Small Stars , Indicates oversold and overbought with certain logic and price may reverse when this small star triggers. Useful to identify
This indicator shows in a subwindow the trend in M1, M5, H1, D1 timeframes based on MA, MACD, Stochastic This way you could see in once in different timeframes what happening.  This is my first free indicator. Please follow I will put here some more. Thank you for you attention.  . . . . . lfknglkslksnlgslgnsflgjrpoesv ,msv lkrjpfjésmdg sd.npo4wsmdglknsp4jwpkeégmfs.lkmp Thank you
FREE
Yawabeh SD Pro –  Professional Supply and Demand Indicator Trade Smarter with Volume-Confirmed Supply/Demand Zones Our institutional-grade algorithm identifies high-probability reversal zones before price reacts, giving you the edge in Forex, Crypto, and Stocks. Key Features Multi-Timeframe Confirmation – View trend strength across multiple timeframes simultaneously – Align your trades with higher timeframe momentum Smart Alert System – Real-time notifications for: – Strong demand/supply zone
A complex of indicators of recognizing reversal moments. Detects the peaks and hollows according to the combinations of candles after they deduct from two MA. Applicable for trading systems when using early inputs. You can use a trend for scalping and intraday trade, and for detecting a trend in the early stages. Possibilities The parameters provide flexible settings for any time floms and trading tools. There are several types of warning for signals. Yellow arrow - Sell signal , pink arrow -
The indicator determines a special pattern of Joe Dinapoli. It gives very high probability buy and sell signals. Indicator does not repaint. Indicator Usage Buy Signal ''B'' Entry : Market buy order at signal bar close Stop : Low of signal bar Take Profit : First swing high Sell Signal ''S'' Entry : Market sell order at signal bar close Stop : High of signal bar Take Profit : First swing low Indicator Parameters Fast EMA : External Parameter (should be kept as default) Slow EMA: External Parame
このインジケーターは実践的なトレードに最適な自動波動分析のインジケーターです! 場合... 注:   Tang Lun (Tang Zhong Shuo Zen) の命名規則の影響で、私は波のグレーディングに西洋の名前を使用することに慣れていません。基本的な波を ペン 、二次波のバンドを セグメント と名付けました。同時に、 セグメント にはトレンドの方向が指定されます (この命名方法は将来のノートで使用されます。最初に言っておきます)。ただし、アルゴリズムは曲がりくねった理論とはほとんど関係がないため、付けるべきではありません。これは、私の市場分析 によって要約された、絶えず変化する複雑な運用ルール を反映しています。 バンドは標準化され、人によって異なることがないよう定義されており、市場参入を厳密に分析する上で重要な役割を果たす人為的な干渉の描画方法が排除されています。 このインジケーターを使用することは、取引インターフェイスの美しさを改善することと同等であり、元の K ライン取引を放棄し、取引の新しいレベルに連れて行きます。また、宣伝の観点から顧客の認識も向上します。 イ
Implement
Vitalii Zakharuk
5 (1)
Implement analyzes market dynamics for pivot points. If you want to learn how to spot the correct reversals for consistently likely profitable trading, buy this indicator. Shows favorable moments of entering the market in stripes. Ready-made trading system. The principle of operation of the indicator is to automatically determine the current state of the market when placed on a chart, analyze historical data based on historical data and display instructions for further actions on the trader's
The indicator is like a mother-in-law, who talks often, talks a lot and often inappropriately. The indicator, in addition to giving us an entry signal on parameters which I will then list, monitors the trend of the hourly timeframe, OSMA to understand the entry direction, RSI to sense any overbought or oversold conditions from which to abstain, ATR for the volatility and ADX for the trend. Indicator not recommended for newbies. Only the human judgment of these parameters, combined with the entr
Altopium Trend is an indicator that identifies short-term trends. The signals it generates can be used to open long or short positions or can be integrated with other indicators/strategies. This is a trend indicator, be careful during narrow sideways phases. I recommend using it as a short-term trend indicator, complemented by other indicators that show the best times to enter the market. Wait for the bar to close to confirm the signal.
FREE
スキャルピング矢印は再描画されません -チャート上に価格反転ポイントを示し、そのシグナルを再描画しないインジケーター。また、インジケーターは電子メールとプッシュを介してトレーダーにシグナルを送信します。このインジケーターの信号の精度は、M5タイムフレームで約92〜94%、H1タイムフレームで95%以上です。したがって、この指標により、トレーダーは正確に取引を開始し、さらなる価格変動を予測することができます。チャート上の価格反転ポイントは、すべてのトレーダーに対してシンプルでわかりやすい矢印を使用して示されています。絶え間なく動的な市場の変化を考えると、この指標は過去の相場データを収集し、数学モデルを使用して学習することができます。 インジケーターはシグナルを再描画しません。 インジケーターは、M1からD1までの時間枠で機能します 重要! このインジケーターを購入すると、リンク https://www.mql5.com/ru/market/product/69755で最高の自動ボットの1つをギフトとして受け取ることができます 。 。 スキャルピング矢印がインジケーターを再描画しないこと
Impulse fractals indicator - is counter-trend oriented complex market fractal pattern.  Market creates bull/bear impulse, trend starts, fractals on impulsed wave are an agressive pullback signals. Buy arrow is plotted when market is bearish and it's impulse showed up-side fractal, and sell arrow is plotted when market is bullish and it's impulse showed dn-side fractal. Main indicator's adjustable inputs : impulsePeriod - main period of impulse histogram  filterPeriod  - smoothes impulse accordi
This is an indicator that helps you to scan the whole timeframe then informs you about the last candle position Engulfing Candlestick pattern was formed. The indicator also send alert to your mobile when a new engulfing candle is formed.  For the visual; 1. Green up arrow indicates a bullish engulfing candlestick pattern  2. Red down arrow indicates a bearish engulfing candlestick pattern
FREE
Alpha TP Zone
Effendi Hadi Rais S T
5 (1)
ALPHA TP ZONE – SMART TAKE PROFIT & LIQUIDITY TOOL Alpha TP Zone is a professional trading indicator designed to help traders identify liquidity zones, take profit targets, and high-probability reaction areas with precision. KEY FEATURES Automatic Liquidity Detection (Buy & Sell Zones) Smart Take Profit Levels (Institutional Target) Clean Zone Visualization (No Lag) Real-Time Market Reaction Mapping Built-in Alert System Multi-Timeframe Compatible HOW IT WORKS The indicator
FREE
KmeanSuperTrend – AI搭載の高度なSuperTrend指標 KmeanSuperTrendでアダプティブトレーディングの力を解き放とう! AI K-meansクラスタリング技術を搭載した世界初のSuperTrend指標でトレーディングを変革しましょう。KmeanSuperTrendは、実証済みのSuperTrend方法論と最先端の機械学習を組み合わせ、トレンド検出と市場分析において前例のない精度を提供します。 革命的な機能   AI K-means ATRクラスタリング: 先進的な5クラスターアルゴリズムが100以上の過去足を分析し、現在の市場ボラティリティ条件にATR計算を知的に適応させます。   動的SuperTrend可視化: 市場条件に自動的に調整される適応的カラーコーディング(上昇トレンド、下降トレンド)による明瞭なトレンドシグナル。 ️   完全にカスタマイズ可能なパラメータ: ATR期間(デフォルト:10) ATR乗数(デフォルト:3.0) ルックバック期間(デフォルト:100) カスタムカラーとライン スタイル 高度
このプロダクトを購入した人は以下も購入しています
Enigmera
Ivan Stefanov
5 (8)
ENIGMERA: 市場の中心 重要:MQL5.comのデモはStrategy Testerで実行されており、Enigmeraの機能を完全には反映していない場合があります。詳細については、説明、スクリーンショット、ビデオをご確認ください。質問があれば、遠慮なくメッセージを送ってください! インジケーターのコードは完全に書き直されました。バージョン3.0は新機能を追加し、インジケーターの開始以来蓄積されたバグを修正しました。 紹介 このインジケーターとトレーディングシステムは、金融市場への注目すべきアプローチです。ENIGMERAはフラクタルサイクルを使用して、サポートとレジスタンスのレベルを正確に計算します。真の蓄積フェーズを示し、方向と目標を提供します。トレンドでも修正でも機能するシステムです。 動作方法 インジケーターのほとんどの機能は、チャートの左側にあるボタンで制御され、市場の状況に迅速に対応できるようになっています。 ボタン ON/OFF – インジケーター全体を表示または非表示にします。 Channel – サポートチャネルを有効にし、許容範囲の偏差を示します。 Dev
多くの矢印インジケーターは、シグナルだけを表示して、その後の判断はすべてトレーダー任せです。KT Alpha Hunter Arrows は、最初から完成されたトレードプランを提供します。 各シグナル矢印が表示されると、エントリーライン、ストップロス、4つのテイクプロフィット水準、そして現在の銘柄と時間足を今トレードする価値があるかを示すリアルタイムのエッジ判定が、チャート上にまとめて描画されます。付属の Trade Manager EA は、手動でエントリーした後の管理をサポートし、相場が荒れて感情が揺れやすい場面でも、トレードの規律を保ちやすくします。リペイントなし。確定足のみでシグナルを表示。Forex、ゴールド、指数、その他あなたが取引するあらゆる銘柄向けに設計されています。 主な機能 リペイントしない買い・売り矢印。シグナルは足が確定した後にのみ表示されます。 各シグナルにエントリーライン、構造的なストップロス、4つのテイクプロフィット水準を表示。 Edge Dashboard が、現在のチャート上で買いと売りのセットアップを個別に評価。 判定システム:No Edge、Ma
「 Dynamic Scalper System 」インジケーターは、トレンド波の中でスキャルピング取引を行う手法のために設計されています。 主要通貨ペアと金でテスト済みで、他の取引商品との互換性があります。 トレンドに沿った短期的なポジションオープンのシグナルを提供し、追加の価格変動サポートも提供します。 インジケーターの原理 大きな矢印はトレンドの方向を決定します。 トレンド波の中では、小さな矢印の形でスキャルピングシグナルを生成するアルゴリズムが機能します。 赤い矢印は強気方向、青い矢印は弱気方向です。 トレンドの方向には敏感な価格変動ラインが描かれ、小さな矢印のシグナルと連動します。 シグナルは次のように機能します。適切なタイミングでラインが現れるとエントリーシグナルが形成され、ラインが開いている間はポジションが保持され、完了すると取引が終了します。 推奨される動作時間枠はM1~H4です。 矢印は現在のローソク足に形成され、次のローソク足が開いている場合は、前のローソク足の矢印は再描画されません。 入力パラメータ Trend Wave Period - トレンド方向
The Propfolio Master Suite is the ultimate all-in-one analytical workstation for professional traders. Combining the power of the Beat The Market Maker (BTMM) methodology, Smart Money Concepts (SND/Liquidity), and Advanced Volume Profile, this suite replaces multiple different indicators with one optimized engine. Monitor up to 14 pairs simultaneously from a single chart, instantly identify market cycles, and seamlessly map institutional footprints with the click of a button. The Command Center
Trend Breakout Arrows Indicator The Trend Breakout Arrows Indicator is a momentum-based signal tool designed to identify potential bullish and bearish breakout opportunities. It displays clear arrow signals directly on the price chart, helping traders quickly recognize possible trend changes and continuation setups. Up Arrow (Buy Signal) A magenta up arrow appears below a candle when bullish momentum begins to strengthen. This signal indicates that buying pressure may be overtaking selling press
RelicusRoad Pro: 定量的市場オペレーティングシステム 【期間限定】無制限アクセス 70% OFF - 2,000人超のトレーダーと共に なぜ多くのトレーダーは「完璧な」インジケーターを使っても失敗するのでしょうか? それは、文脈を無視して 単一の概念 だけでトレードしているからです。文脈のないシグナルは単なるギャンブルです。勝ち続けるには、 根拠の重なり(コンフルエンス) が必要です。 RelicusRoad Proは単なる矢印インジケーターではありません。完全な 定量的市場エコシステム です。独自のボラティリティモデリングを用いて、価格が推移する「適正価値の道(Fair Value Road)」をマッピングし、ノイズと真の構造的ブレイクを判別します。 推測はやめましょう。機関投資家レベルの「ロード・ロジック」でトレードを。 コアエンジン:「Road」アルゴリズム システムの中心となる Road Algo は、市場環境にリアルタイムで適応するダイナミックなボラティリティチャネルです。 安全ライン(平衡点) と、価格が数学的に反転しやすい 拡張レベル を投影します。 Si
ゴールドラッシュ・トレンド・アロー・シグナル ゴールドラッシュ・トレンド・アロー・シグナル 指標は、XAU/USDにおける高速・短期スキャルパー向けに最適化された、正確でリアルタイムのトレンド分析を提供します。 1分足専用に設計されたこのツールは、明確なエントリーポイントを示す方向矢印を表示し、スキャルパーが変動の激しい市場状況でも自信を持って取引できるよう支援します。 この指標は、PRIMARY(主要)とSECONDARY(補助)のアラート矢印で構成されています。PRIMARYシグナルは、トレンドの方向転換を示す白と黒の方向矢印であり、SECONDARYシグナルは、PRIMARY矢印が示す方向を確認し、潜在的なエントリーポイントを示す青と赤の矢印です。 注意:トレンド方向の変化後にPRIMARYアラート矢印が1つだけ表示される場合、複数のSECONDARY青/赤矢印が表示される点に注意が必要です。SECONDARYシグナルは、シグナル基準を満たす任意のローソク足後に表示されます。したがって、長期的なトレンド移動の場合、画面に多くのSECONDARY矢印が表示されます(添付の
Precautions for subscribing to indicator This indicator only supports the computer version of MT4 Does not support MT5, mobile phones, tablets The indicator only shows the day's entry arrow The previous history arrow will not be displayed (Live broadcast is for demonstration) The indicator is a trading aid Is not a EA automatic trading No copy trading function The indicator only indicates the entry position No exit (target profit)  The entry stop loss point is set at 30-50 PIPS Or the front hi
Smart4x Institutional Order Blocks v6.0 Advanced Smart Money Concepts (SMC) Indicator with Quality Scoring, Fibonacci Confluence & Multi-Timeframe Analysis The Ultimate Smart Money Trading Tool for Forex, Crypto, Indices, and Commodities Brand:   Smart4x Version:   6.0 Type:   MT4 Indicator Overview Smart4x Institutional Order Blocks v6.0   is a next-generation Smart Money Concepts indicator designed to scout, score, and filter institutional-grade order blocks with unparalleled precision. Bui
Quant Direction
Georgios Kalomoiropoulos
Quant Direction は、3次元の市場分析ツールです。完全に客観的なアルゴリズムベースの市場分析を提供し、様々なパラメータにわたる正確なパーセンテージ偏差を同時に算出します。高度なAI搭載モデリングツールで開発され、厳密なテストを経て開発されたこのアルゴリズムは、かつてない精度で市場を分析するように設計されています。プラットフォーム上では、あらゆる通貨ペアや金融商品を分析できます。 短期取引、デイトレード、スイングトレードなど、どのような取引スタイルに も、Quant Directionは最適な選択肢です。 オペレーターの本当の利点 Quant Directionの真の利点は、感情、眼精疲労、過剰分析を完全に排除できる点にあります。方向性を探るために何十ものチャートを手作業で精査したり、自分の好みを常に疑ったりする必要がなくなります。このシステムは、8つの時間間隔(5ヶ月から月単位まで)をミリ秒単位で処理します。あらゆる瞬間に市場を支配している主体を正確に明らかにし、常に成功確率が最も高い方向で取引できるようにします。 市場分析の3つの側面 このアルゴリズムは市場を3つの
Super Signal – Skyblade Edition プロ仕様のノンリペイント / ノーラグ・トレンドシグナルシステム。卓越した勝率を実現 | MT4 / MT5 対応 1分足、5分足、15分足などの低い時間足で最も効果を発揮します。 主な特徴: Super Signal – Skyblade Edition は、トレンド取引に特化したスマートなシグナルシステムです。マルチレイヤーのフィルターロジックを用いて、明確な方向性と実際のモメンタムに支えられた強力なトレンドのみを検出します。 このシステムは 天井や底を予測するものではありません 。次の3つの条件がすべて満たされた場合にのみシグナルを発生させます: 明確なトレンド方向 モメンタムの増加 健全なボラティリティ構造 市場セッションに基づく流動性分析と組み合わせることで、シグナルの精度とタイミングがさらに向上します。 シグナルの特性: すべての矢印シグナルは 100% 非リペイント / 遅延なし 一度出現したシグナルは固定され、点滅・消失しません チャート上の矢印、情報パネル、ポップアップ通知、音声アラート、プッシュ通知
El indicador "MR BEAST ALERTAS DE LIQUIDEZ" es una herramienta avanzada diseñada para proporcionar señales y alertas sobre la liquidez del mercado basándose en una serie de indicadores técnicos y análisis de tendencias. Ideal para traders que buscan oportunidades de trading en función de la dinámica de precios y los niveles de volatilidad, este indicador ofrece una visualización clara y detallada en la ventana del gráfico de MetaTrader. Características Principales: Canal ATR Adaptativo: Calcula
Gold Channel is a volatility-based indicator, developed with a specific timing algorithm for the XAUUSD pair, which consists of finding possible corrections in the market. This indicator shows two outer lines, an inner line (retracement line) and an arrow sign, where the theory of the channel is to help identify overbought and oversold conditions in the market. The market price will generally fall between the boundaries of the channel. If prices touch or move outside the channel it is a tradi
Buy Sell Signal Pro Looking for a precise and efficient swing detection tool that clearly identifies market structure turning points? Need consistent and easy-to-read buy and sell signals across different timeframes and instruments? Buy Sell Signal Pro  is designed to deliver accurate swing identification with a clean and practical approach, helping traders interpret price structure with confidence. Overview This indicator detects key market structure points, including: Higher Highs (HH) Higher
ECM Elite Channel is a volatility-based indicator, developed with a specific time algorithm, which consists of finding possible corrections in the market. This indicator shows two outer lines, an inner line (retracement line) and an arrow sign, where the channel theory is to help identify overbought and oversold conditions in the market. The market price will generally fall between the boundaries of the channel. If prices touch or move outside the channel, it's a trading opportunity. The ind
一款信号统计指标(MT4)——实现基于当前图表周期下的单线MA转向和双线MA金叉/死叉统计 . 转向定义:前一K向下或走平,当前K向上,视为转向向上;反之,转向向下。 金死叉定义:前一K快线在慢线下方,当前K快线在慢线上方,为金叉;反之,死叉。 参数及使用说明: 1、可指定统计K线数。 2、可指定4个不同的日内时间段,格式如"03:00-07:59",4个时间段可交叉任意输入。 3、可配置ABC三个浮盈区间段点值。如:分界区间统计小点值设为500,即当某转向信 号出现后到下一反向信号止浮盈<=此点值,计入A区间; 若大于此点值<大分界点值时,计入B区间;若大于“大分界点值”计入C区间。 4、最大/最小浮盈统计。显示所有统计区间内的最大浮盈点值和最小浮盈点值(亏损点值)。 5、输出完整信号,按信号出现顺序排列,如“ACCBCA”之类。 6、综合预测。使用概率、周期、趋势、马尔可夫链等综合概算输出预测该信号出现的归类概率值。 7、加载指定MA线。在当前图表自动载入相应设置的MA线。 8、自适应列宽。以完整显示统计信号数。 9、用法:点击相应统计按钮即输出相应的统计表格.
Linear Trend Predictor ー - エントリ ポイントと方向サポート ラインを組み合わせたトレンド インジケーター。高値/安値チャネルを突破するという原理に基づいて機能します。 インジケーターのアルゴリズムは市場のノイズをフィルタリングし、ボラティリティと市場の動向を考慮します。 インジケーターの機能  平滑化手法を使用して、市場のトレンドと、買い注文または売り注文を開くためのエントリー ポイントを表示します。  任意の時間枠のチャートを分析して、短期および長期の市場の動きを判断するのに適しています。  あらゆる市場や時間枠に適応可能な入力パラメータにより、トレーダーはインジケーターを独自にカスタマイズできます。  設定されたインジケーター信号は消えず、再描画もされません。ローソク足の終値で決定されます。  いくつかの種類の通知が矢印と組み合わされています。  このインジケーターは、独立した取引システムとして使用することも、他の取引システムへの追加として使用することもできます。  あらゆるレベルの経験を持つトレーダーが使用できます。 主なパラメータ Vol
GEM Signal Pro GEM Signal Pro は、MetaTrader 4 向けのトレンドフォロー型インジケーターです。より明確なシグナル、より整理されたトレードセットアップ、そして実用的なリスク管理をチャート上で確認したいトレーダーのために設計されています。 単純な矢印だけを表示するのではなく、GEM Signal Pro はトレード全体の考え方を、より見やすく分かりやすい形で表示します。条件が確認されると、インジケーターはエントリー価格、ストップロス、利確目標をチャート上に表示し、トレードセットアップをより効率的に確認できるようにします。 動作の仕組み このインジケーターは、まず内部ロジックに基づいて有効なシードシグナルを検出します。 確認条件が満たされると、GEM Signal Pro はチャート上に完全なセットアップを表示します。これにより、トレーダーはトレード構造をより明確に把握し、手作業による分析を減らすことができます。 チャート上のトレードレベル 確認済みシグナルに対して、GEM Signal Pro は以下を表示できます。 エントリー価格 ストップロス テ
The indicator is built on a non-standard Zig Zag, it draws accumulations after which if the price leaves this zone and a test of this zone occurs, then a sound signal is given and an arrow appears - after the test candle closes.The indicator does not redraw its signals, it is very easy to use, there are only three settings 1- this is the zig zag parameter 2- this is the minimum price exit from the zone 3- this is the maximum price exit from the zone. The lower the parameter for Zig Zag, the more
PairMaster Buy Sell Arrow Indicator for MT4 Trade Reversals Like a Pro — Catch Every Swing Point with Precision The PairMaster Buy Sell Arrow Indicator is a powerful MetaTrader 4 tool built to identify high-probability swing trading opportunities . Designed for traders who value accuracy, clarity, and simplicity, PairMaster detects key market turning points and plots intuitive buy and sell arrows directly on your chart. Key Features Accurate Swing Point Detection – Automatically identifies ma
NAM Divergences
NAM TECH GROUP, CORP.
5 (1)
MT4マルチタイムフレームの発散と売られ過ぎ/売られ過ぎの検出インジケーター。 特徴 -チャートコントロールパネルで完全にカスタマイズ可能で、完全な相互作用を提供します。 -必要な場所でコントロールパネルを表示および非表示にします。 -資本化されていない発散に関するリアルタイムの情報。 -売られ過ぎ/売られ過ぎの状況に関するリアルタイム情報。 -定期的な発散に関するリアルタイムの情報。 -隠れた発散に関するリアルタイム情報。 -発散検出に使用できる発振器:AO、RSI、CCI、MACD、STOCH、RMI、TDI、RSIOMA。 -通知サービス(画面アラート|プッシュ通知)。 概要 発散取引を使用すると、弱体化傾向や勢いの逆転を見つけるのに役立ちます。トレンドが続くためのシグナルとして使用できる場合もあります。私たちのツールは、チャートを可能な限りクリーンに保つために、表示と非表示の可能性を備えた驚くほど快適で直感的なコントロールパネルで、すべての時間枠で同時に発散検出を提供します。 選択した履歴期間に、買われ過ぎと売られ過ぎの状況、通常の相違、隠れた相違
The Nihilist 5.0 Indicator includes Forexalien and Nihilist Easy Trend trading strategies and systems. It is composed of an MTF Dashboard where you can analyze the different input possibilities of each strategy at a glance. It has an alert system with different types of configurable filters. You can also configure which TF you want to be notified on your Metatrader 4 platform and Mobile application The indicator has the option to view how could be a TP and SL by using ATR or fixed points, even w
Enigma Scalper  Overview Enigma Scalper Pro is a multi-filter breakout indicator designed for traders who want clean entry signals with confirmation from several technical conditions instead of relying on a single trigger. The indicator combines: 3-Bar Breakout pattern detection Higher Timeframe confluence Bollinger Band extreme filtering RSI momentum analysis Optional EMA trend filtering ATR-based SL/TP projection Signals are generated only after candle close to ensure stable non-repainting beh
Meravith
Ivan Stefanov
5 (3)
マーケットメーカーのためのツール。 Meravith は次の機能を提供します: すべての時間足を分析し、現在有効なトレンドを表示します。 強気と弱気の出来高が等しくなる流動性ゾーン(出来高均衡)を強調表示します。 異なる時間足のすべての流動性レベルをチャート上に直接表示します。 テキスト形式の市場分析を生成し、参考情報として表示します。 現在のトレンドに基づいて目標値、サポートレベル、ストップロスを計算します。 取引のリスクリワード比を算出します。 口座残高に基づいてポジションサイズを計算し、潜在的な利益を推定します。 また、市場に大きな変化があった場合には警告を表示します。 インジケーターの主要ライン: 強気/弱気の出来高エグゾーストライン ― 目標値として機能します。 市場のトレンドを示すライン。市場が強気か弱気かによって色が変わり、トレンドのサポートとして機能します。主にその色が市場センチメントを示します。 出来高均衡ライン(Eq)。Eq(Volume Equilibrium)ラインはシステムの中核です。これは買い手と売り手の出来高のバランスポイントを表します。市場の流動性を示し
Weis Wave with Alert
Trade The Volume Waves Single Member P.C.
4.82 (22)
Rental/Lifetime Package Options and Privileges' Rent Monthly Six Months   Yearly/Lifetime Weis Wave with Speed with Alert+Speed Index x x x Manual  x x x Quick Set up Video x x x Blog x x x Lifetime Updates x x x Setup and Training Material x x Rectangle Break Alert Tool      x Discord Access Channel "The SI traders" x   How to trade info visit:    http://www.tradethevolumewaves.com   ** If you purchase please contact me to setup your  : training Room and  complete manual access.  This is
Binary Booster
Yaroslav Varankin
5 (1)
Binary Options Trading Indicator: A Reliable Tool for Your Trades This indicator is specifically designed for binary options trading and has proven its high quality, reliability, and adequate accuracy, depending on the dynamics of the chart. Key Points: Signal Interpretation: When a blue cross signal appears, it indicates a potential entry into a trade, though it is considered a weak signal on its own. However, if the blue cross is accompanied by an arrow, it is considered a more reliable buy s
Добрый День уважаемые трейдеры!  Вашему вниманию индикатор созданный и работающий на базе трендовика ADX,  для торговли на смене направления движения который учитывает коррекцию и даёт возможность на ней заработать.  Применяю этот индикатор для скальпинга. Рекомендую таймфреймы от 15 ти минутного(М15) до часового (Н1) периодов.  Красный кружок сигнал на продажу- Sell) Зелёный кружок  сигнал на покупку Buy) Чем меньше ваш таймфрейм тем меньше пунктов вы зарабатываете.   Важно выставлять стопы! !В
Rtc ML Ai | Predictor CORE MACHINE LEARNING ENGINE Adaptive ML Market Predictor – Multi-Bar Trend & Candle Forecast What This Indicator Does This indicator is a  real-time market prediction engine  designed to analyze price behavior and estimate  future market tendencies . Unlike conventional indicators, this system  does not rely on static parameters or historical curve-fitting , but adapts its internal state dynamically during live market operation. Instead of using static rules, the indic
Product Name:   Quantum Regime Indicator Short Description:   A multi-engine structural regime and volatility filter. Description: Quantum Regime Indicator (QRI) is a sophisticated technical analysis algorithm designed to identify market structure shifts and volatility regimes. Unlike standard indicators that rely on immediate price action, QRI utilizes a hierarchical logic architecture to filter market noise and identify statistical extremes. The indicator is built on the philosophy of "Market
SYSTEM INTRODUCTION:   The Binary Options Channels System Is Specifically Designed For Binary Options Trading. Unlike Other Systems And Indicators That Were Adopted From Other Trading Environments For Binary Options. Little Wonder Why Many Of Such Systems Fail To Make Money . Many End Up Loosing Money For Their Users.  A Very Important Fact That Must Be Noted Is The Fact That Application Of Martingale Is not Required. Thus Making It Safer For Traders Usage And Profitability. A Trader Can Use Fi
作者のその他のプロダクト
Fisher Yur4ik Indicator is a momentum indicator originated by Yuri Prokiev (Russian). I combined the Fisher Test indicator with other indicators to sieve/filter signals. It is not used as a standalone indicator but in combination to filter out Price Action signals.  I have uploaded this indicator (Fisher test) for download alongside the 3Bar_Play signal indicator for signals to appear. It is free.
FREE
The GT_SqueezeBreakOut signal indicator is a momentum based strategy using the bollinger bands and standard deviation indicators (which indicate periods of low volatility and eventual breakout) as well as the Fisher momentum/trend indicator to filter quality trade signals.  It shows the squeeze (price consolidation) periods on chart and also signals on breakout of squeeze/price consolidation. You get instant alert/ push notification both on chart and on any other device used to receive alert sig
This MT4 Trading Journal Indicator is a   powerful, professional-grade tool   that transforms the standard MetaTrader 4 platform into a comprehensive trading management system. Its unique multi-instance capability, customizable interface, and automatic tracking features make it an exceptional value proposition for traders seeking organization and discipline in their trading activities. 1. VISUAL BRANDING & CUSTOMIZATION Dynamic Color Coordination : The title bar automatically matches the toggle
GOLD vs USD
Nnamdi Kennedy Ifeorah
Enhanced GOLD–USD RSI Correlation System 4.0 The Gold Standard in Gold Trading: Multi-Confirmation RSI System+Raw Geometric index with Real-Time Alerts INTRODUCTION GOLD vs USD RSI/Geometric Cross Indicator   is a professional-grade trading system that revolutionizes Gold/USD analysis by providing multi-dimensional confirmation signals. Built for serious traders who demand precision, this indicator combines traditional RSI momentum with advanced relative strength analysis to identify high-proba
Currency Strength Table HYBRID v1.33   - Professional Multi-Timeframe Currency Strength Analyzer (PRO) BREAKTHROUGH CURRENCY ANALYSIS SOLUTION FOR SERIOUS FOREX TRADERS!  *Note: Most suitable for Professionals, Advanced & Intermediate traders!   * ADDITIONAL BONUS:   Rent for 3months and get a free ex.4 dual switch momentum (RSI+Prcie/Bid Ratio) Currency Bar Meter . See attached screenshot 6 .  Limited offer (first 50 purchases). The Ultimate All-In-One Currency Strength Dashboard EXPLAINED. St
GT Tools CPM – Currency Power Meter Dual Engine Strength Dashboard (Price Momentum + RSI Momentum) See the Real Power Behind the Market GT Tools CPM (Currency Power Meter) is a professional-grade multi-currency strength dashboard designed to reveal the true underlying power of individual currencies — not just pairs. Instead of guessing which pair to trade, CPM shows you: Which currency is strongest Which currency is weakest How momentum is shifting Whether price structure or RSI momentum
CustomTF Master — 16 Custom Timeframes + Live Switcher Panel One Indicator. No DLL. No Scripts. No Extra Files. Upgrade your MT4 Terminal! THE PROBLEM THIS SOLVES MetaTrader 4 ships with only 9 timeframes: M1, M5, M15, M30, H1, H4, D1, W1, MN. Serious traders know that some of the most powerful price action setups form on timeframes MT4 simply does not offer — M2, M8, M10, M20, M40, M45, H2, H3, H5, H6, H8, H12, H16, H32, and more totalling 25 timeframes at your disposal compared to current MT4'
フィルタ:
レビューなし
レビューに返信