Trade Analyzer Panel
- Utilitários
- Versão: 1.20
- Atualizado: 20 março 2026
- Ativações: 10

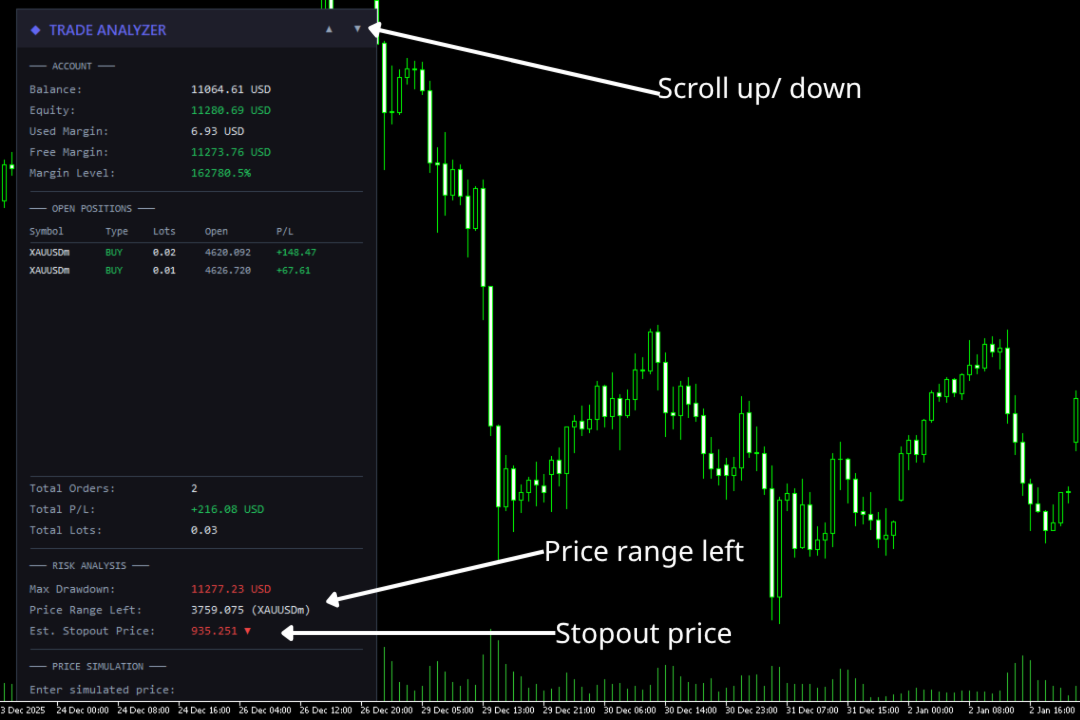
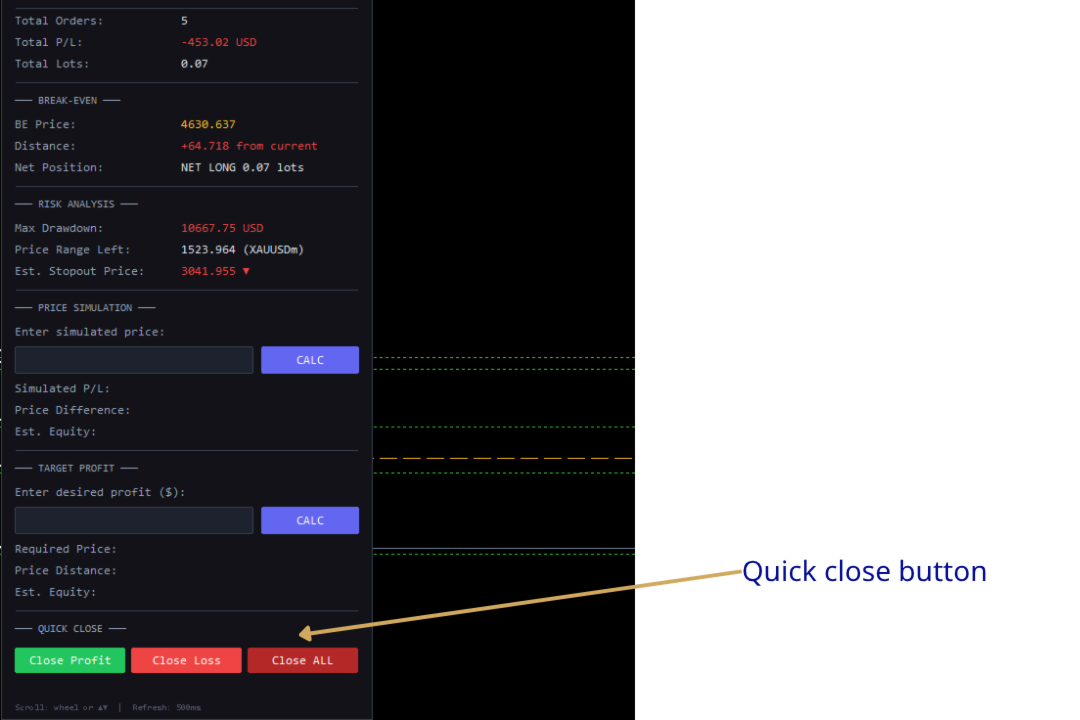
Trade Analyzer Panel is a real-time dashboard utility for MetaTrader 5. It brings position monitoring, risk analysis, profit/loss simulation, target planning, break-even visualization and quick-close controls into a single scrollable on-chart panel.
Features
- Position scanner: lists every open position with symbol, direction, lot size, open price and live profit/loss.
- Account summary: balance, equity, used and free margin, and margin level updated in real time.
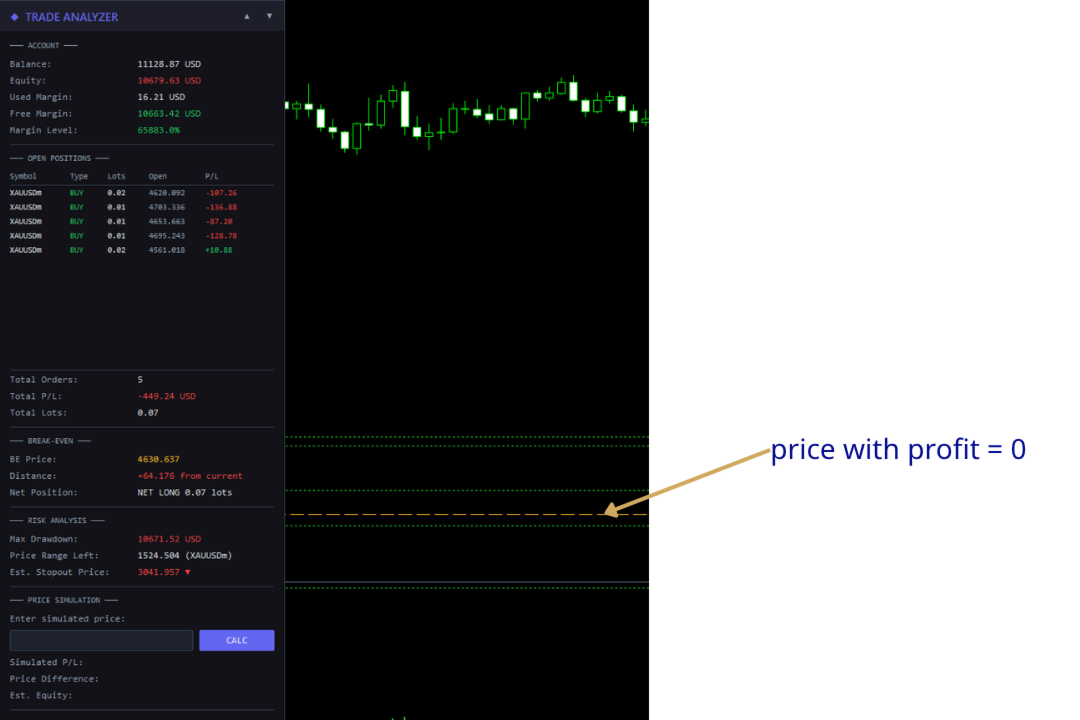
- Break-even visualization: draws a line at the exact break-even price for the current symbol so you see your no-loss level instantly.
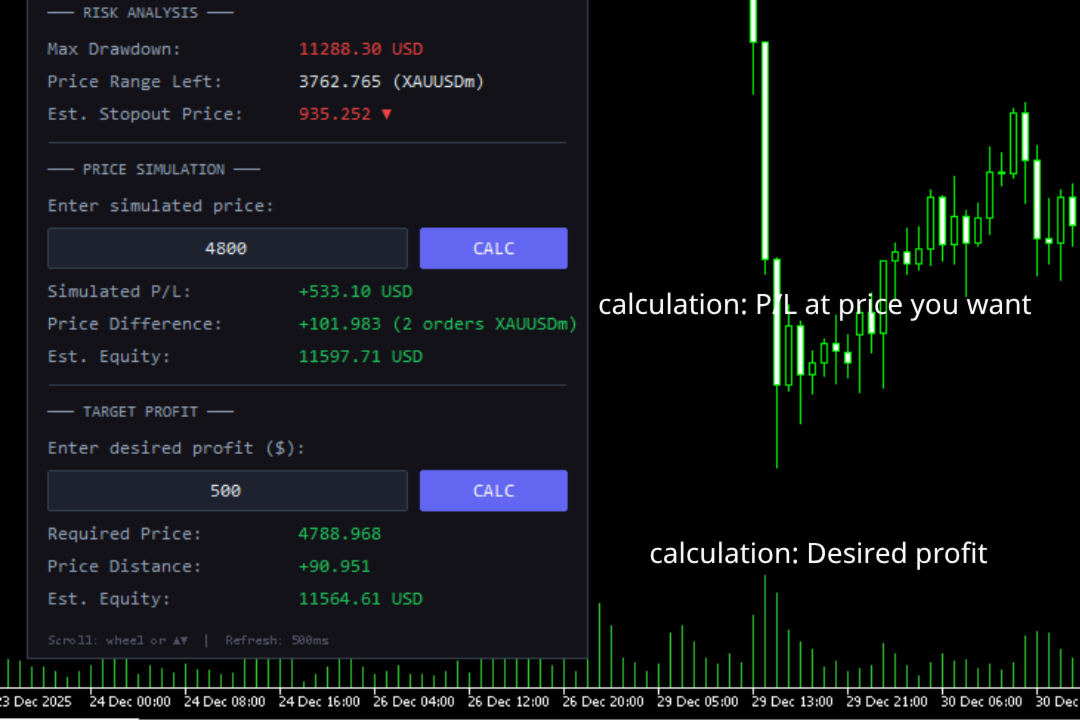
- Risk analysis: shows maximum drawdown, the price range remaining before stop-out, and the estimated stop-out price.
- Price simulator: preview the resulting profit/loss at any target price before you act.
- Quick close controls: close positions individually or in batch from the panel.
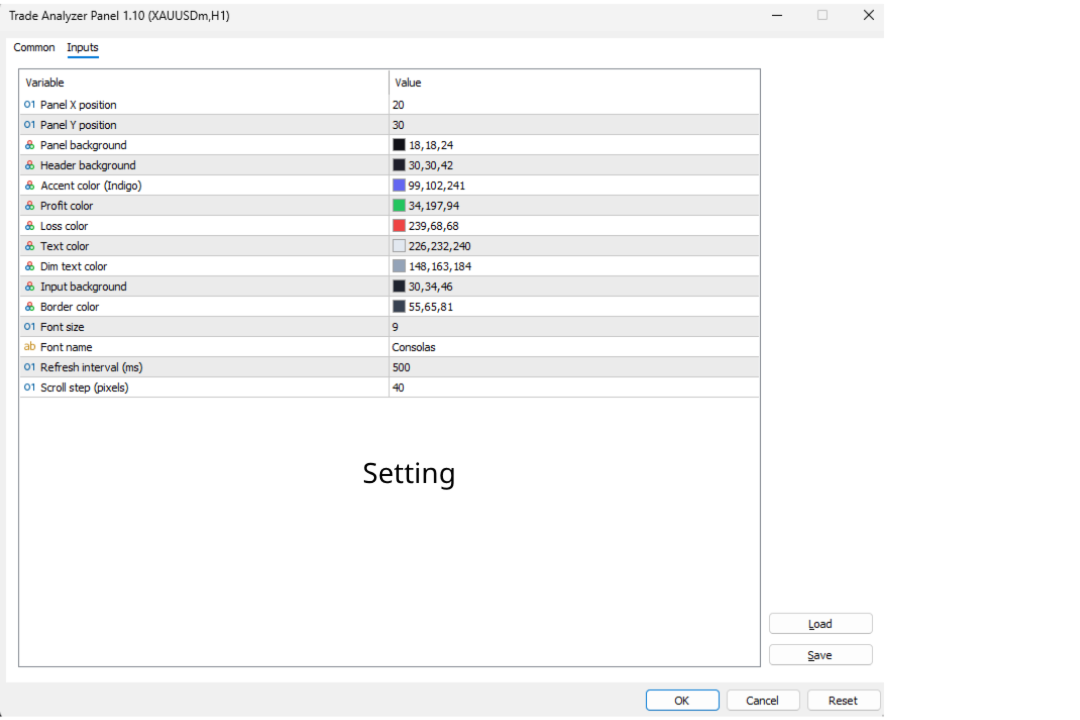
Inputs
- Panel position and size on the chart.
- Color and font options.
- Symbol scope: current symbol only or all symbols.
- Optional magic-number filter to focus on one strategy.
Outputs
- Scrollable on-chart panel with the position list, account summary and risk figures.
- Break-even line drawn on the price chart.
Alerts
This is a monitoring and management panel; it does not generate trade signals. Margin-level or drawdown warnings can be shown on the panel.
Limitations
The panel reports and manages existing positions; it does not open trades automatically or predict the market. Figures such as stop-out depend on your broker's margin settings.
Full guide: see the Comments section.
Group support: https://www.mql5.com/en/channels/vuongphamtrading