

A Forgotten Classic in Volume Analysis: The Finite Volume Elements Indicator for Today's Markets
 445
445
 4
4

Contents
- Introduction
- Finite Volume Elements
- Implementing FVE for MetaTrader 5
- The FinVolEleLinRegSl Indicator Based on FVE
- Interpreting Indicators
- Testing in the Expert Advisor
- Conclusion
Introduction
In the world of technical analysis, volume indicators play a key role in understanding market dynamics and confirming price movements. One such tool is the Finite Volume Elements (FVE) indicator, first described in detail in the April 2003 issue of Technical Analysis of STOCKS & COMMODITIES. FVE was developed as an improved method for assessing the balance between buyers and sellers, taking into account not only the direction of price movement but also the intensity of trading volume.
Unlike traditional volume indicators, such as On Balance Volume (OBV) or Accumulation/Distribution, FVE goes beyond simple price-direction measures by filtering out minor fluctuations and reducing market noise. This allows for a more accurate identification of accumulation and distribution periods, as well as the detection of true market trends.
In today’s financial markets, characterized by high volatility and frequent false signals, Finite Volume Elements becomes a particularly relevant tool. Its ability to filter out minor movements and focus on significant changes in volume makes FVE useful for both short-term traders and long-term investors seeking to improve the accuracy of their trading decisions.
It is worth noting that although FVE was developed more than twenty years ago, it has not lost its relevance and can serve as an excellent tool in today’s market conditions. As is often the case in financial markets, what seems new is often just a rediscovery of the old, and returning to tried-and-true tools can give a trader the very edge that is so often lacking in a rapidly changing market environment.
Finite Volume Elements
FVE is based on the idea of analyzing not only the direction of price movement but also the strength of that movement, as expressed through trading volume. The indicator takes into account not only the bar's closing price, but also its position relative to the range, as well as the dynamics of the typical price. As a result, FVE allows for more accurate identification of accumulation and distribution periods, as well as moments when buyers or sellers dominate the market.
To calculate the indicator, follow these steps:
- Determine the typical prices for the current and previous bars:
CurrTP = (CurrHigh + CurrLow + CurrClose) / 3
PrevTP = (PrevHigh + PrevLow + PrevClose) / 3
- Calculate the price movement metric (MF), which takes into account not only the closing price but also the price's position within the bar, as well as the change in the typical price:
MF = (Close - (High + Low) / 2) + (CurrTP - PrevTP) where CurrTP - typical current bar price PrevTP - typical previous bar price - Determine the direction of movement (Direction):
if MF exceeds a certain threshold (Cutoff), the movement (Direction) is considered upward (+1), if it is below a negative threshold - downward (-1), otherwise - neutral (0)
- Adjust the volume:
AdjVolume = Volume * Direction
where
Volume - current bar volume
Direction - movement direction defined in the previous step
- Sum the adjusted volumes for a given period (Samples) and divide by the total volume for that same period:
SumAdjVolume = AdjVolume_1 + AdjVolume_2 + ... + AdjVolume_N
SumVolume = Volume_1 + Volume_2 + ... + Volume_N
where
N - number of bars in the selected period (Samples)
- Calculate the final FVE value, expressed as a percentage:
FVE = (SumAdjVolume / SumVolume) * 100%
The formulas discussed here make it possible to calculate the FVE value step by step for any selected period. Let's implement this indicator for the MetaTrader 5 platform.
Implementing FVE for MetaTrader 5
Let's create an indicator that works in a chart subwindow. The indicator will use both real and tick volume, which is important for the Forex market.
The indicator's input parameters will be as follows:
- Samples — calculation period (default: 22 bars),
- Threshold (CutOff) — a sensitivity threshold that filters out minor fluctuations (default: 0.3),
- Used Volume — the type of volume used (real or tick volume).
In the terminal directory \MQL5\Indicators\STOCKS_COMMODITIES\FiniteVolumeElement\, let's create a new indicator named FVE.mq5:
//+------------------------------------------------------------------+
//|                                                          FVE.mq5 |
//|                                  Copyright 2026, MetaQuotes Ltd. |
//|                                             https://www.mql5.com |
//+------------------------------------------------------------------+
#property copyright "Copyright 2026, MetaQuotes Ltd."
#property link      "https://www.mql5.com"
#property version   "1.00"
#property description       "Finite Volume Elements"
#property indicator_separate_window
#property indicator_buffers 3
#property indicator_plots   1
//--- plot FVE
#property indicator_label1  "FVE"
#property indicator_type1   DRAW_LINE
#property indicator_color1  clrRed
#property indicator_style1  STYLE_SOLID
#property indicator_width1  1

enum ENUM_USED_VOLUME   // Enumeration of volume types used
  {
   USED_VOLUME_REAL,    // Real volume
   USED_VOLUME_TICK,    // Tick volume
  };

//--- input parameters
input(name="Samples")      int               InpSamples     =  22;               // Calculation period
input(name="Threshold")    double            InpCutOff      =  0.3;              // Sensitivity threshold
input(name="Used Volume")  ENUM_USED_VOLUME  InpUsedVolume  =  USED_VOLUME_TICK; // Volume used

//--- indicator buffers
double         BufferFVE[];
double         BufferVolumePlusMinus[];
double         BufferVolumes[];

//--- global variables
int            samples;
double         cutoff;
//+------------------------------------------------------------------+
//| Custom indicator initialization function                         |
//+------------------------------------------------------------------+
int OnInit()
  {
//--- indicator buffer mapping
   SetIndexBuffer(0,BufferFVE,INDICATOR_DATA);
   SetIndexBuffer(1,BufferVolumePlusMinus,INDICATOR_CALCULATIONS);
   SetIndexBuffer(2,BufferVolumes,INDICATOR_CALCULATIONS);

   PlotIndexSetDouble(0,PLOT_EMPTY_VALUE,EMPTY_VALUE);

//--- Check and set the period and threshold
   samples=(InpSamples<1? 22 : InpSamples);
   cutoff=InpCutOff/100.0;
//--- Set the indicator name and level 0
   IndicatorSetString(INDICATOR_SHORTNAME,StringFormat("FVE(%d,%.3f)",samples,InpCutOff));
   IndicatorSetInteger(INDICATOR_LEVELS,1);
   IndicatorSetDouble(INDICATOR_LEVELVALUE,0,0.0);

   ArraySetAsSeries(BufferFVE,true);
   ArraySetAsSeries(BufferVolumePlusMinus,true);
   ArraySetAsSeries(BufferVolumes,true);

//--- Successful
   return(INIT_SUCCEEDED);
  }
//+------------------------------------------------------------------+
//| Custom indicator iteration function                              |
//+------------------------------------------------------------------+
int OnCalculate(const int32_t rates_total,
                const int32_t prev_calculated,
                const datetime &time[],
                const double &open[],
                const double &high[],
                const double &low[],
                const double &close[],
                const long &tick_volume[],
                const long &volume[],
                const int32_t &spread[])
  {
//--- Check the number of available bars
   if(rates_total<samples+1)
      return(0);

//--- Arrays for calculation—as time series
   ArraySetAsSeries(high,true);
   ArraySetAsSeries(low,true);
   ArraySetAsSeries(close,true);
   ArraySetAsSeries(volume,true);
   ArraySetAsSeries(tick_volume,true);

//--- Check and calculate the number of bars to calculate
   int limit=rates_total-prev_calculated;

//--- If this is just the next new tick, do nothing
   if(limit==0)
      return(rates_total);

//--- If this is the first run or historical data has changed
   if(limit>1)
     {
      //--- start calculation from the beginning of historical data,
      //--- initialize the indicator buffers with zero values
      limit=rates_total-samples-1;
      ArrayInitialize(BufferFVE,0);
      ArrayInitialize(BufferVolumePlusMinus,0);
      ArrayInitialize(BufferVolumes,0);
     }
//--- Calculate the indicator (either the entire history or each subsequent new bar)
   for(int i=limit; i>=0; i--)
     {
      //--- Typical prices for the current and previous bars
      double TP_curr=(high[i]+low[i]+close[i])/3.0;
      double TP_prev=(high[i+1]+low[i+1]+close[i+1])/3.0;

      //--- Calculate the current metric and the direction of movement of the price
      double MF=(close[i]-(high[i]+low[i])/2.0)+TP_curr-TP_prev;
      int FveFactor=(MF>cutoff*close[i]) ? 1 : (MF< -cutoff*close[i]) ? -1 : 0;

      //--- Write the current adjusted and total volumes to the buffers
      long vol=Volume(i,volume,tick_volume);
      BufferVolumePlusMinus[i]=double(vol*FveFactor);
      BufferVolumes[i]=(double)vol;

      //--- Sum the adjusted and total volumes over samples bars
      double FVEsum=0, VolSum=0;
      for(int j=0;j<samples;j++)
        {
         int idx=i+j;
         FVEsum+=BufferVolumePlusMinus[idx]; // Sum of adjusted volume over samples bars
         VolSum+=BufferVolumes[idx];         // Sum of total volume over samples bars
        }
      //--- Calculate FVE
      BufferFVE[i]=(VolSum!=0 ? (FVEsum/VolSum)*100.0 : 0.0);
     }
//--- return value of prev_calculated for next call
   return(rates_total);
  }
//+------------------------------------------------------------------+
//| Return the volume depending on the setting selected              |
//+------------------------------------------------------------------+
long Volume(const int index,const long &volume_real[],const long &volume_tick[])
  {
   return(InpUsedVolume==USED_VOLUME_REAL ? volume_real[index] : volume_tick[index]);
  }
//+------------------------------------------------------------------+
Let's compile the indicator and run it on the chart with Threshold (InpCutOff) set to 0.2:
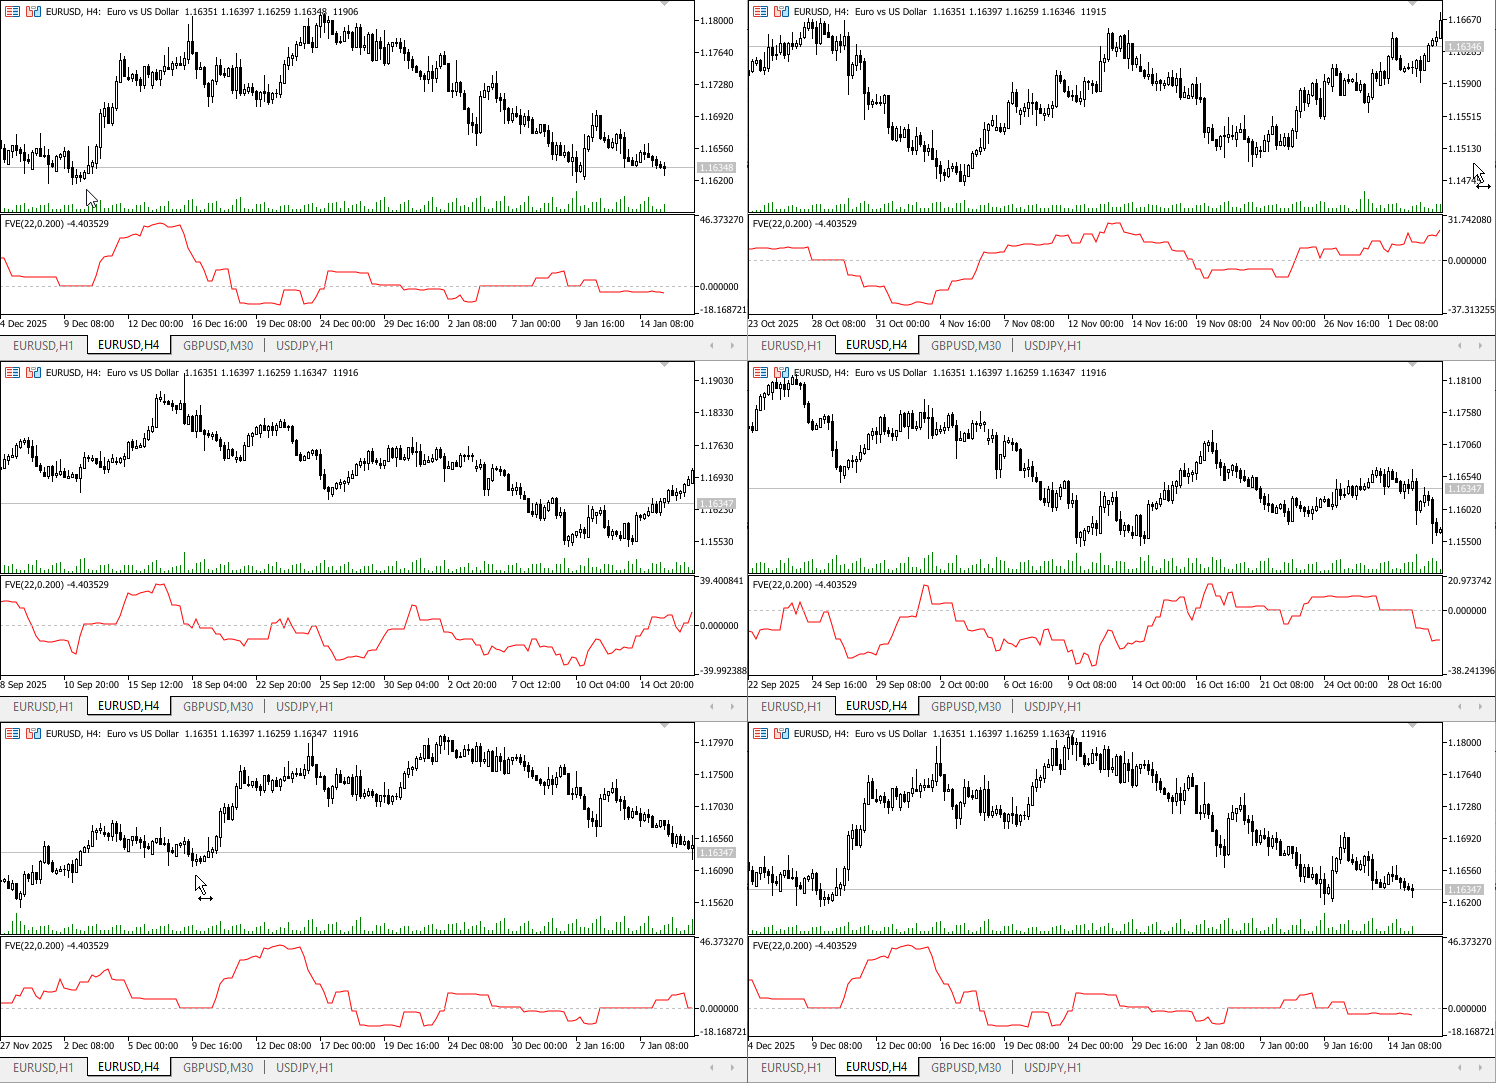
For each instrument and chart period, the Threshold value should be selected based on historical data (the default is 0.3). The higher the sensitivity threshold that filters out minor price fluctuations, the larger the movements that are treated as insignificant.
The FinVolEleLinRegSl Indicator Based on FVE
To identify market moves and breakout conditions more effectively, Marcos Katsanos proposed the FinVolEleLinRegSl indicator, which is an extension of the Finite Volume Element indicator. While FVE makes it possible to determine whether buyers or sellers dominate the market, FinVolEleLinRegSl supplements this analysis by evaluating the dynamics of change — that is, the rate and direction of change in both FVE itself and price.
To do this, FinVolEleLinRegSl calculates the linear regression slopes for FVE and price over a specified period. This makes it possible to identify moments when volume and price begin to move in sync or, conversely, diverge, which may indicate a possible trend change soon or confirm the current movement.
In the same folder, \MQL5\Indicators\STOCKS_COMMODITIES\FiniteVolumeElement (FVE)\, let's create a new indicator, also running in a chart subwindow, named FinVolEleLinRegSl.mq5:
//+------------------------------------------------------------------+
//|                                            FinVolEleLinRegSl.mq5 |
//|                                  Copyright 2026, MetaQuotes Ltd. |
//|                                             https://www.mql5.com |
//+------------------------------------------------------------------+
#property copyright "Copyright 2026, MetaQuotes Ltd."
#property link      "https://www.mql5.com"
#property version   "1.00"
#property indicator_separate_window
#property description "Finite Volume Elements + Linear Regression Slope"
#property indicator_buffers 5
#property indicator_plots   2
//--- plot FVESlope
#property indicator_label1  "FVESlope"
#property indicator_type1   DRAW_LINE
#property indicator_color1  clrRed
#property indicator_style1  STYLE_SOLID
#property indicator_width1  1
//--- plot PriceSlope
#property indicator_label2  "PriceSlope"
#property indicator_type2   DRAW_LINE
#property indicator_color2  clrBlue
#property indicator_style2  STYLE_SOLID
#property indicator_width2  1

enum ENUM_USED_VOLUME   // Enumeration of volume types used
  {
   USED_VOLUME_REAL,    // Real volume
   USED_VOLUME_TICK,    // Tick volume
  };

//--- input parameters
input(name="Samples")         int            InpSamples           =  22;               // Calculation period
input(name="Threshold")       double         InpCutOff            =  0.3;              // Sensitivity threshold
input(name="SlopePeriod")     int            InpSlopePeriod       =  35;               // Linear regression period
input(name="PriceSlopeFactor")double         InpPriceSlopeFactor  = 2500;              // Price scale (instrument-specific)
input(name="Used Volume")  ENUM_USED_VOLUME  InpUsedVolume        =  USED_VOLUME_TICK; // Volume used

//--- indicator buffers
double         BufferFVESlope[];
double         BufferPriceSlope[];
double         BufferFVE[];
double         BufferVolumePlusMinus[];
double         BufferVolumes[];

//--- global variables
int            samples;
double         cutoff;
int            slope_period;
//+------------------------------------------------------------------+
//| Custom indicator initialization function                         |
//+------------------------------------------------------------------+
int OnInit()
  {
   //--- displayed buffers
   SetIndexBuffer(0,BufferFVESlope,INDICATOR_DATA);
   SetIndexBuffer(1,BufferPriceSlope,INDICATOR_DATA);
   //--- calculation buffers
   SetIndexBuffer(2,BufferFVE,INDICATOR_CALCULATIONS);
   SetIndexBuffer(3,BufferVolumePlusMinus,INDICATOR_CALCULATIONS);
   SetIndexBuffer(4,BufferVolumes,INDICATOR_CALCULATIONS);

   PlotIndexSetDouble(0,PLOT_EMPTY_VALUE,EMPTY_VALUE);
   PlotIndexSetDouble(1,PLOT_EMPTY_VALUE,EMPTY_VALUE);

   samples=(InpSamples<1? 22 : InpSamples);
   cutoff=InpCutOff/100.0;
   slope_period=(InpSlopePeriod<2? 35 : InpSlopePeriod);

//--- indicator short name
   IndicatorSetString(INDICATOR_SHORTNAME,
   StringFormat("FVELinReg(%d,%.3f,%d,%.1f)",samples,InpCutOff,slope_period,InpPriceSlopeFactor));

//--- indicator level 0
   IndicatorSetInteger(INDICATOR_LEVELS,1);
   IndicatorSetDouble(INDICATOR_LEVELVALUE,0,0.0);

   ArraySetAsSeries(BufferFVE,true);
   ArraySetAsSeries(BufferVolumePlusMinus,true);
   ArraySetAsSeries(BufferVolumes,true);
   ArraySetAsSeries(BufferFVESlope,true);
   ArraySetAsSeries(BufferPriceSlope,true);

   return(INIT_SUCCEEDED);
  }
//+------------------------------------------------------------------+
//| Custom indicator iteration function                              |
//+------------------------------------------------------------------+
int OnCalculate(const int32_t rates_total,
                const int32_t prev_calculated,
                const datetime &time[],
                const double &open[],
                const double &high[],
                const double &low[],
                const double &close[],
                const long &tick_volume[],
                const long &volume[],
                const int32_t &spread[])
  {
//--- Checking the number of available bars
   if(rates_total<samples+slope_period+1)
      return(0);

//--- Arrays for calculation - as time series
   ArraySetAsSeries(high,true);
   ArraySetAsSeries(low,true);
   ArraySetAsSeries(close,true);
   ArraySetAsSeries(volume,true);
   ArraySetAsSeries(tick_volume,true);

//--- Check and calculat the number of bars to be processed
   int limit=rates_total-prev_calculated;

//--- If this is the first run or historical data has changed
   if(limit>1)
     {
      limit=rates_total-samples-slope_period-1;
      ArrayInitialize(BufferFVE,0);
      ArrayInitialize(BufferVolumePlusMinus,0);
      ArrayInitialize(BufferVolumes,0);
      ArrayInitialize(BufferFVESlope,0);
      ArrayInitialize(BufferPriceSlope,0);
     }
//--- Indicator calculation
   for(int i=limit; i>=0; i--)
     {
      //--- Typical prices for the current and previous bars (FVE)
      double TP_curr=(high[i]+low[i]+close[i])/3.0;
      double TP_prev=(high[i+1]+low[i+1]+close[i+1])/3.0;

      //--- Calculate the current metric and the price's direction of movement (FVE)
      double MF=(close[i]-(high[i]+low[i])/2.0)+TP_curr-TP_prev;
      int FveFactor=(MF>cutoff*close[i]) ? 1 : (MF< -cutoff*close[i]) ? -1 : 0;

      //--- Write the current adjusted volume and total volume to the buffers (FVE)
      long vol=Volume(i,volume,tick_volume);
      BufferVolumePlusMinus[i]=double(vol*FveFactor);
      BufferVolumes[i]=(double)vol;

      //--- Sum the adjusted volume and total volume over samples bars (FVE)
      double FVEsum=0, VolSum=0;
      for(int j=0;j<samples;j++)
        {
         int idx=i+j;
         FVEsum+=BufferVolumePlusMinus[idx]; // Sum of adjusted volume over samples bars
         VolSum+=BufferVolumes[idx];         // Sum of total volume over samples bars
        }
      //--- Calculate FVE
      BufferFVE[i]=(VolSum!=0 ? (FVEsum/VolSum)*100.0 : 0.0);

      // --- Linear regression for FVE and price
      if(i<=rates_total-samples-slope_period-1)
        {
         BufferFVESlope[i]=LinearRegSlope(BufferFVE,i,slope_period);
         BufferPriceSlope[i]=LinearRegSlope(close,i,slope_period)*InpPriceSlopeFactor;
        }
      else
        {
         BufferFVESlope[i]=EMPTY_VALUE;
         BufferPriceSlope[i]=EMPTY_VALUE;
        }
     }
   return(rates_total);
  }
//+------------------------------------------------------------------+
//| Return the volume depending on what is selected in the settings  |
//+------------------------------------------------------------------+
long Volume(const int index,const long &volume_real[],const long &volume_tick[])
  {
   return(InpUsedVolume==USED_VOLUME_REAL ? volume_real[index] : volume_tick[index]);
  }
//+------------------------------------------------------------------+
//| Calculate the linear regression slope for the buffer array       |
//+------------------------------------------------------------------+
double LinearRegSlope(const double &buffer[],int start,int period)
  {
   bool as_series=ArrayGetAsSeries(buffer);
   double sumX=0,sumY=0,sumXY=0,sumXX=0;
   for(int i=0;i<period;i++)
     {
      double x=i;
      double y=(as_series ? buffer[start+period-1-i] : buffer[start+i]);
      sumX+=x;
      sumY+=y;
      sumXY+=x*y;
      sumXX+=x*x;
     }
   double denom=period*sumXX-sumX*sumX;
   if(denom==0) return(0.0);
   double slope=(period*sumXY-sumX*sumY)/denom;
   return(slope);
  }
The FinVolEleLinRegSl indicator is particularly useful for traders looking for early signals of a trend change or confirmation of the strength of the current movement. It can be used to filter out false signals from the classic FVE, as well as to identify divergences between volume and price. This approach was proposed as a way to improve the reliability of signals from indicators that use volume and to provide traders with additional information about market dynamics.
The indicator analyzes how the relationship between volume and price changes in the market. First, the FVE indicator is calculated; it provides data on the strength of buyers or sellers. Next, it determines whether volume momentum is accelerating or decelerating, as well as how quickly the price itself is changing. To do this, two lines are plotted: one reflects the rate of change of FVE, and the other reflects the rate of change of price:

Interpreting Indicators
Finite Volume Elements can be used as a standalone tool for identifying accumulation and distribution phases, as well as for filtering out false signals from other indicators. Its main signals are:- FVE > 0 — buying pressure prevails, and the market is dominated by bulls,
- FVE < 0 — selling pressure prevails, and bears dominate the market,
- Crossing the zero line is a potential signal of a trend reversal.
FVE works well with trend indicators and can be used to confirm signals for entering or exiting a position.
The indicator helps not only to see who is currently dominating the market, but also to understand whether this movement is gaining momentum or, conversely, beginning to fade.
In FVE variants that incorporate slope analysis (such as FinVolEleLinRegSl), Markos Katsanos proposed using slope to filter out false signals and to detect changes in volume and price dynamics at an earlier stage. For example, if the FVE slope becomes negative, this may signal an impending weakening of the trend, even if the FVE itself is still positive. The FinVolEleLinRegSl indicator displays not only the slope of the FVE line but also the slope of the Close price line. This makes it possible to analyze the relative positions of the linear regression slope lines for FVE and price, and to identify convergences and divergences between price and volume. For example, if the price slope line is rising while the volume slope line is falling, this may indicate that the price movement is not supported by volume, and a trend reversal or a halt in the directed movement may occur soon.
Interpretations of the FinVolEleLinRegSl indicator proposed by Marcos Katsanos:
- The main signal of the indicator is when the FVESlope and PriceSlope lines cross the zero level
- when both lines cross zero from below to above, this is interpreted as an early signal of the start of an uptrend, especially if the move is confirmed by volume,
- when both lines cross zero from above to below, it signals a possible downward reversal,
- Synchronized movement of the lines (both lines are rising and are above zero, or both are falling and are below zero) confirms the strength of the current trend,
- A divergence between the lines (for example, PriceSlope continues to rise while FVESlope begins to fall) may indicate a weakening trend and a possible reversal.
The author noted that such divergences often precede corrections or a change in the direction of movement, - Using slope makes it possible to filter out false signals from the classic FVE and receive earlier warnings of changes in market dynamics.
To be honest, and just as a side note: a zero crossing — especially one involving two indicator lines at once — is a very delayed signal, and I would not take it into account. Therefore, in addition to the interpretations of the indicator proposed by the author, it is worth paying attention to the relative positions and shapes of its lines, which will be discussed below during testing.
It is noted that the indicator works well for identifying divergences between volume and price, which allows traders to spot potential reversals in advance.
Like many other indicators, FinVolEleLinRegSl should preferably be used in conjunction with other indicators (such as moving averages or support/resistance levels) to improve signal reliability. The indicator helps not only to confirm the current trend, but also to detect its slowdown or reversal in a timely manner, which is particularly valuable for active traders.
Overall, it is recommended to use FinVolEleLinRegSl signals for early trend detection and confirmation. It is also noted for its effectiveness in filtering out false moves and identifying divergences between volume and price.
Let's test some aspects of the interpretation of these two indicators in the Expert Advisor.
Testing in the Expert Advisor
For testing, we will use only one indicator — FinVolEleLinRegSl — since it is derived from FVE and displays two lines: the linear regression slope of FVE and the linear regression slope of price.
To specify the signals of the FinVolEleLinRegSl indicator, let's examine two tables: the states of one (and each) indicator line, and a summary table showing the relative positions of the two lines.
Table of indicator line states:
| State | Description | Interpretation |
|---|---|---|
| GROWING | A straight upward line | Steady directional growth. The bulls remain strong. |
| FALLING | A straight downward line | Steady directional decline. Bearish pressure persists. |
| TURN_TO_GROW | V shape (minimum) | Turning point: the slope changed from falling to rising. |
| TURN_TO_FALL | Λ shape (maximum) | Turning point: the slope changed from rising to falling. |
Each of the two indicator lines can have the following states. To determine the indicator’s overall signal, it is necessary to analyze the relative positions of its two lines.
Table of relative line positions for the indicator:
| No. | FVE State | Price State | Final Indicator State | Signal Type and Interpretation |
|---|---|---|---|---|
| 1 | GROWING | GROWING | FVE_GROWING_PRICE_GROWING | [Bullish] Uptrend: volume confirms price growth. |
| 2 | GROWING | FALLING | FVE_GROWING_PRICE_FALLING | [Bullish] Convergence: buying on a price decline. |
| 3 | GROWING | TURN_TO_GROW | FVE_GROWING_PRICE_TURN_GROW | [Bullish] Confirmation: the price began to rise following the increase in volume. |
| 4 | GROWING | TURN_TO_FALL | FVE_GROWING_PRICE_TURN_FALL | [Bearish] Hidden divergence: the price is falling while volume is rising. |
| 5 | FALLING | FALLING | FVE_FALLING_PRICE_FALLING | [Bearish] Downtrend: volume confirms the price decline. |
| 6 | FALLING | GROWING | FVE_FALLING_PRICE_GROWING | [Bearish] Divergence: selling the asset as its price rises. |
| 7 | FALLING | TURN_TO_FALL | FVE_FALLING_PRICE_TURN_FALL | [Bearish] Confirmation: the price began to fall following the decrease in volume. |
| 8 | FALLING | TURN_TO_GROW | FVE_FALLING_PRICE_TURN_GROW | [Bullish] Hidden convergence: The price is rising while volume is falling. |
| 9 | TURN_TO_GROW | TURN_TO_GROW | FVE_TURN_GROW_PRICE_TURN_GROW | [Bullish] Synchronous low (“V”): a strong buying impulse. |
| 10 | TURN_TO_GROW | GROWING | FVE_TURN_GROW_PRICE_GROWING | [Bullish] Volume momentum: FVE has turned upward to catch up with the price. |
| 11 | TURN_TO_GROW | FALLING | FVE_TURN_GROW_PRICE_FALLING | [Bullish] Convergence begins: volume started moving upward (FVE “V”). |
| 12 | TURN_TO_GROW | TURN_TO_FALL | FVE_TURN_GROW_PRICE_TURN_FALL | [Bullish] Mirror convergence: a reversal toward each other. |
| 13 | TURN_TO_FALL | TURN_TO_FALL | FVE_TURN_FALL_PRICE_TURN_FALL | [Bearish] Synchronous high (“Λ”): strong selling momentum. |
| 14 | TURN_TO_FALL | FALLING | FVE_TURN_FALL_PRICE_FALLING | [Bearish] Volume momentum: FVE turned downward, catching up with the price. |
| 15 | TURN_TO_FALL | GROWING | FVE_TURN_FALL_PRICE_GROWING | [Bearish] Start of divergence: volume has started to move down (FVE “Λ”). |
| 16 | TURN_TO_FALL | TURN_TO_GROW | FVE_TURN_FALL_PRICE_TURN_GROW | [Bearish] Mirror divergence: reversal in opposite directions. |
Based on these two tables, we will create enumerations that reflect the shape of the indicator lines and their relative positions. We will use the data from the second table as a filter for the Expert Advisor's signals.
If the Expert Advisor gives a buy signal but the filter indicates a sell state, we will simply ignore that signal. In other words, we will do the simplest thing: if the signals from the Expert Advisor and the filter do not agree on the direction, then the trading system will ignore that signal.
We will use the Expert Advisor from CodeBase: https://www.mql5.com/ru/code/63916. This is a simple Expert Advisor that trades based on signals from the standard Williams' Percent Range (WPR) and Bollinger Bands (BB) indicators.
Let's save the Expert Advisor in the \MQL5\Experts\STOCKS_COMMODITIES\FiniteVolumeElement (FVE)\ folder under the name ExpFVEWPRBB.mq5.
We will add optional signal filtering based on the FinVolEleLinRegSl indicator. To specify the indicator's volume types and return the State of its lines, let's define the following enumerations:
//+------------------------------------------------------------------+
//|                                                  ExpFVEWPRBB.mq5 |
//|                                  Copyright 2026, MetaQuotes Ltd. |
//|                                             https://www.mql5.com |
//+------------------------------------------------------------------+
#property copyright "Copyright 2026, MetaQuotes Ltd."
#property link      "https://www.mql5.com"
#property version   "1.00"

//+------------------------------------------------------------------+
//| Included files                                                   |
//+------------------------------------------------------------------+
#include <Trade\Trade.mqh>
#include <Arrays\ArrayLong.mqh>

//+------------------------------------------------------------------+
//| Enumerations                                                     |
//+------------------------------------------------------------------+
//--- Signal types
enum ENUM_SIGNAL_TYPE
  {
   SIGNAL_TYPE_NONE,                                                 // No signal
   SIGNAL_TYPE_LONG,                                                 // Buy signal
   SIGNAL_TYPE_SHORT,                                                // Buy signal
  };

//--- Enumeration of volume types used
enum ENUM_USED_VOLUME
  {
   USED_VOLUME_REAL,                                                 // Real volume
   USED_VOLUME_TICK,                                                 // Tick volume
  };

//--- States of the FVESlope and PriceSlope lines
enum ENUM_LINE_SLOPE_STATE
  {
   LINE_SLOPE_STATE_UNKNOWN,                                         // State is undefined
   LINE_SLOPE_STATE_FLAT,                                            // Low activity
   LINE_SLOPE_STATE_GROWING,                                         // Volume is increasing
   LINE_SLOPE_STATE_FALLING,                                         // Volumes are decreasing
   LINE_SLOPE_STATE_TURN_TO_GROW,                                    // Shift to rising volumes
   LINE_SLOPE_STATE_TURN_TO_FALL                                     // Shift to declining volumes
  };

//--- Mutual states of the FVESlope and PriceSlope lines
enum ENUM_FVE_STATE
  {
   FVE_STATE_UNKNOWN,                                                // State is undefined

   //--- FVE GROWING Property Group (Growth)
   FVE_STATE_FVE_GROWING_PRICE_GROWING,                              // FVE is rising; price is rising
   FVE_STATE_FVE_GROWING_PRICE_FALLING,                              // FVE is rising; price is falling
   FVE_STATE_FVE_GROWING_PRICE_TURN_GROW,                            // FVE is rising; price has turned upward
   FVE_STATE_FVE_GROWING_PRICE_TURN_FALL,                            // FVE is rising; price has turned downward

   //--- FVE FALLING Property Group (Falling)
   FVE_STATE_FVE_FALLING_PRICE_FALLING,                              // FVE is falling; price is falling
   FVE_STATE_FVE_FALLING_PRICE_GROWING,                              // FVE is falling; price is rising
   FVE_STATE_FVE_FALLING_PRICE_TURN_FALL,                            // FVE is falling; price has turned downward
   FVE_STATE_FVE_FALLING_PRICE_TURN_GROW,                            // FVE is falling; price has turned upward

   //--- FVE TURN_GROW Property Group (Turn Up)
   FVE_STATE_FVE_TURN_GROW_PRICE_GROWING,                            // FVE has turned upward; price is rising
   FVE_STATE_FVE_TURN_GROW_PRICE_FALLING,                            // FVE has turned upward; price is falling
   FVE_STATE_FVE_TURN_GROW_PRICE_TURN_GROW,                          // FVE has turned upward; price has turned upward
   FVE_STATE_FVE_TURN_GROW_PRICE_TURN_FALL,                          // FVE has turned upward; price has turned downward

   //--- FVE TURN_FALL Property Group (Turn Downward)
   FVE_STATE_FVE_TURN_FALL_PRICE_FALLING,                            // FVE has turned downward; the price is falling
   FVE_STATE_FVE_TURN_FALL_PRICE_GROWING,                            // FVE has turned downward; the price is rising
   FVE_STATE_FVE_TURN_FALL_PRICE_TURN_FALL,                          // FVE has turned downward; the price has turned downward
   FVE_STATE_FVE_TURN_FALL_PRICE_TURN_GROW                           // FVE has turned downward; the price has turned upward
  };

//+------------------------------------------------------------------+
//| Structures                                                       |
//+------------------------------------------------------------------+
In the input parameters, we will add the indicator parameters, and in the global variables, we will add variables for storing the adjusted input parameter values:
//+------------------------------------------------------------------+
//| Structures                                                       |
//+------------------------------------------------------------------+
//--- Position structure
struct SData
  {
   CArrayLong  list_tickets;                                         // List of open position tickets
   double      total_volume;                                         // Total volume of open positions
  };

//--- Position data structure by type
struct SDataPositions
  {
   SData       Buy;                                                  // Buy position data
   SData       Sell;                                                 // Sell position data
  }Data;

//+------------------------------------------------------------------+
//| Macros                                                           |
//+------------------------------------------------------------------+
#define  DATA_COUNT        3                                         // Number of data accepted from indicators (3 and more)
#define  ENV_ATTEMPTS      3                                         // Number of attempts to wait for environment data
#define  ENV_WAIT_ATTEMPT  1000                                      // Wait time in milliseconds for environment updates
#define  SPREAD_MLTP       3                                         // Spread multiplier for stop order distance

//+------------------------------------------------------------------+
//| Input parameters                                                 |
//+------------------------------------------------------------------+
//--- WPR
input int                  InpPeriodWPR      =  32;                  /* WPR calculation period */
input double               InpOverboughtWPR  = -20;                  /* WPR Overbought Level */
input double               InpOversoldWPR    = -80;                  /* WPR Oversold Level */
//--- BB
input int                  InpPeriodBB       =  58;                  /* BB calculation period */
input double               InpDeviationBB    =  2.0;                 /* BB deviations */
input int                  InpShiftBB        =  0;                   /* BB shift */
input ENUM_APPLIED_PRICE   InpPriceBB        =  PRICE_CLOSE;         /* BB applied price */
//--- ATR
input int                  InpPeriodATR      =  64;                  /* ATR calculation period */

//--- FinVolEleLinRegSl
input int                  InpSamples        =  22;                  /* FVERegSl Samples */
input double               InpCutOff         =  0.3;                 /* FVERegSl Threshold */
input int                  InpSlopePeriod    =  35;                  /* FVERegSl SlopePeriod */
input double               InpPriceSlopeFactor= 2500;                /* FVERegSl PriceSlopeFactor */
input ENUM_USED_VOLUME     InpUsedVolume     =  USED_VOLUME_TICK;    /* FVERegSl Used Volume */
input bool                 InpUseFilterByFVE =  true;                /* Use signal filtering with FVERegSl */

//--- Trading
input double               InpVolume         =  0.1;                 /* Position volume */
sinput ulong               InpDeviation      =  10;                  /* Slippage (in points) */
sinput ulong               InpMagic          =  123456;              /* Magic number */
input int                  InpStopLoss       =  -1;                  /* Stop loss (in points), 0 - none, -1 - half of BB */
input int                  InpTakeProfit     =  -1;                  /* Take profit (in points), 0 - none, -1 - ATR value */
input double               InpSLMltp         =  2.6;                 /* Stop loss size multiplier, if SL == -1 */
input double               InpTPMltp         =  1.3;                 /* Take profit size multiplier, if TP == -1 */

//+------------------------------------------------------------------+
//| Global variables                                                 |
//+------------------------------------------------------------------+
CTrade   trade;                                                      // Trading class object
int      handle_wpr;                                                 // WPR indicator handle
int      handle_bb;                                                  // BB indicator handle
int      handle_atr;                                                 // ATR indicator handle
int      handle_fve;                                                 // FVERegSl indicator handle
double   wpr[DATA_COUNT]={};                                         // Array of WPR values
double   bb0[DATA_COUNT]={};                                         // Array of BB values, buffer 0 (Upper)
double   bb1[DATA_COUNT]={};                                         // Array of BB values, buffer 1 (Lower)
double   bb2[DATA_COUNT]={};                                         // Array of BB values, buffer 2 (Middle)
double   atr[DATA_COUNT]={};                                         // Array of ATR values
double   fv0[DATA_COUNT]={};                                         // Array of FVESlope values
double   fv1[DATA_COUNT]={};                                         // Array of FVEPriceSlope values
MqlRates prc[DATA_COUNT]={};                                         // Array of prices and time

int      period_wpr;                                                 // WPR calculation period
double   overbought_wpr;                                             // WPR overbought level
double   oversold_wpr;                                               // WPR oversold level

int      period_bb;                                                  // BB calculation period
double   deviation_bb;                                               // BB Deviations
int      shift_bb;                                                   // BB Shift

int      period_atr;                                                 // ATR Calculation Period

int      samples;                                                    // FVERegSl Calculation Period
double   cutoff;                                                     // FVERegSl Sensitivity Threshold
int      slope_period;                                               // FVERegSl Linear Regression Period

double   lot;                                                        // Position volume
string   program_name;                                               // Program name
int      prev_total;                                                 // Number of positions on the previous check
bool     netto;                                                      // Netting account flag

//+------------------------------------------------------------------+
//| Expert initialization function                                   |
//+------------------------------------------------------------------+
In the Expert Advisor's OnInit() handler, we will adjust the indicator's input parameters and create its indicator handle:
//+------------------------------------------------------------------+
//| Expert initialization function                                   |
//+------------------------------------------------------------------+
int OnInit()
  {
//--- If the account is not of the hedging type, set a flag and report that the Expert Advisor will not operate correctly
   netto=false;
   if(AccountInfoInteger(ACCOUNT_MARGIN_MODE)!=ACCOUNT_MARGIN_MODE_RETAIL_HEDGING)
     {
      Print("The EA is designed for use on a hedging account. Correct operation on a netting account is not guaranteed.");
      netto=true;
     }

//--- Set and adjust the input variables of the indicators
//--- WPR
   period_wpr=(InpPeriodWPR<1 ? 14 : InpPeriodWPR);
   overbought_wpr=(InpOverboughtWPR<-99  ? -99  : InpOverboughtWPR> 0   ?  0  : InpOverboughtWPR);
   oversold_wpr  =(InpOversoldWPR  <-100 ? -100 : InpOversoldWPR  >-1   ? -1  : InpOversoldWPR);
   if(overbought_wpr<=oversold_wpr)
      overbought_wpr+=1;
//--- BB
   period_bb=(InpPeriodBB<2 ? 20 : InpPeriodBB);
   deviation_bb=InpDeviationBB;
   shift_bb=InpShiftBB;
//--- ATR
   period_atr=(InpPeriodATR<1 ? 14 : InpPeriodATR);
//--- FVERegSl
   samples=(InpSamples<1? 22 : InpSamples);
   cutoff=InpCutOff/100.0;
   slope_period=(InpSlopePeriod<2? 35 : InpSlopePeriod);

//--- Initialize the arrays of indicator values
   ArrayInitialize(wpr,EMPTY_VALUE);
   ArrayInitialize(bb0,EMPTY_VALUE);
   ArrayInitialize(bb1,EMPTY_VALUE);
   ArrayInitialize(bb2,EMPTY_VALUE);
   ArrayInitialize(atr,EMPTY_VALUE);
   ArrayInitialize(fv0,EMPTY_VALUE);
   ArrayInitialize(fv1,EMPTY_VALUE);
   ZeroMemory(prc);

//--- Create indicator handles
//--- WPR
   handle_wpr=iWPR(Symbol(),PERIOD_CURRENT,period_wpr);
   if(handle_wpr==INVALID_HANDLE)
     {
      PrintFormat("%s: Failed to create iWPR(%d) handle",__FUNCTION__,period_wpr);
      return INIT_FAILED;
     }
//--- BB
   handle_bb=iBands(Symbol(),PERIOD_CURRENT,period_bb,shift_bb,deviation_bb,InpPriceBB);
   if(handle_bb==INVALID_HANDLE)
     {
      PrintFormat("%s: Failed to create iBands(%d,%d,%.3f,%s) handle",__FUNCTION__,period_bb,shift_bb,deviation_bb,EnumToString(InpPriceBB));
      return INIT_FAILED;
     }
//--- ATR
   handle_atr=iATR(Symbol(),PERIOD_CURRENT,period_atr);
   if(handle_atr==INVALID_HANDLE)
     {
      PrintFormat("%s: Failed to create iATR(%d) handle",__FUNCTION__,period_atr);
      return INIT_FAILED;
     }
//--- FVERegSl
   handle_fve=iCustom(Symbol(),PERIOD_CURRENT,"FinVolEleLinRegSl",samples,cutoff,slope_period,InpPriceSlopeFactor,InpUsedVolume);
   if(handle_fve==INVALID_HANDLE)
     {
      PrintFormat("%s: Failed to create FinVolEleLinRegSl(%d,%.3f,%d,%.1f) handle",__FUNCTION__,samples,cutoff,slope_period,InpPriceSlopeFactor);
      return INIT_FAILED;
     }

//--- Program name and number of positions on the previous check
   program_name=MQLInfoString(MQL_PROGRAM_NAME);
   prev_total=0;

//--- Automatic setting of the filling type
   trade.SetTypeFilling(GetTypeFilling());
//--- Set the magic number
   trade.SetExpertMagicNumber(InpMagic);
//--- Set slippage
   trade.SetDeviationInPoints(InpDeviation);
//--- Set the lot size with adjustment of the entered value
   lot=CorrectLots(InpVolume);

//--- Everything completed successfully
   PrintFormat("%s::%s: Initialization was successful",program_name,__FUNCTION__);
   return(INIT_SUCCEEDED);
  }
Of course, an array for storing the indicator data is declared and initialized in the Expert Advisor — just like all the other arrays for storing data from all the indicators used in the Expert Advisor.
Similarly — just as with the functions for writing, storing, and retrieving indicator data — functions have been created for working with data from the FinVolEleLinRegSl indicator.
In the Expert Advisor's OnTick() handler, the signal received from the WPR and Bollinger Bands indicators is adjusted according to the State of the FinVolEleLinRegSl indicator:
//+------------------------------------------------------------------+
//| Expert tick function                                             |
//+------------------------------------------------------------------+
void OnTick()
  {
//--- Get data for three bars of indicators and prices into arrays
   if(!CopyIndicatorsData(1) || !CopyPricesData(1))
      return;

//--- Fill position ticket lists
   int positions_total=PositionsTotal();
   if(prev_total!=positions_total)
     {
      if(!FillingListTickets(Symbol(),InpMagic))
         return;
      prev_total=positions_total;
     }

//--- Get signals from indicators
   ENUM_SIGNAL_TYPE signal_wpr=SignalWPR();
   ENUM_SIGNAL_TYPE signal_bb=SignalBB();
//--- Overall signal
   ENUM_SIGNAL_TYPE signal=(signal_wpr==signal_bb ? signal_wpr : SIGNAL_TYPE_NONE);

//--- If Expert Advisor signal filtering is used,
   if(InpUseFilterByFVE)
     {
      //--- Adjust the signal based on the State of the FinVolEleLinRegSl indicator
      signal=SignalByFVELinRegSl(signal,0);
     }

//--- Trade based on signals
   TradeProcess(signal);
  }
Expert Advisor signal filtering function based on the State of the FinVolEleLinRegSl indicator lines:
//+------------------------------------------------------------------+
//| FinVolEleLinRegSl signal on the bar with the specified index     |
//+------------------------------------------------------------------+
ENUM_SIGNAL_TYPE SignalByFVELinRegSl(const ENUM_SIGNAL_TYPE signal,const int index)
  {
//--- Retrieve the State of the FVELinRegSl indicator at the specified index
   ENUM_FVE_STATE fve_state=StateFVELinRegSl(index);

//--- By uncommenting these lines, the indicator State will be output in the comment on the chart
   /*
   static string text="";
   string txt=StringFormat("\nStateFVE: %s (%s)",StringSubstr(EnumToString(fve_state),10),FVEStateDescription(fve_state));
   if(text!=txt)
     {
      text=txt;
      Comment(text);
     }
   */
//--- Depending on the signal direction, we simply suppress opposite signals using the filter
   switch(signal)
     {
      //--- when there is a buy signal
      case SIGNAL_TYPE_LONG   :
        //--- if the filter State indicates the opposite signal, set the main signal to absent
        switch(fve_state)
          {
           case FVE_STATE_FVE_FALLING_PRICE_FALLING      :  //[Bearish] Confirmed Decline (Trend)
           case FVE_STATE_FVE_FALLING_PRICE_GROWING      :  //[Bearish] Sustained Divergence (Distribution)
           case FVE_STATE_FVE_FALLING_PRICE_TURN_FALL    :  //[Bearish] Price Confirmed the Decline in Volume
           case FVE_STATE_FVE_GROWING_PRICE_TURN_FALL    :  //[Bearish] Hidden Divergence (Price Reversal)
           case FVE_STATE_FVE_TURN_FALL_PRICE_FALLING    :  //[Bearish] Volume Momentum Following Price
           case FVE_STATE_FVE_TURN_FALL_PRICE_GROWING    :  //[Bearish] Start of Divergence (FVE Top)
           case FVE_STATE_FVE_TURN_FALL_PRICE_TURN_FALL  :  //[Bearish] Synchronous Turn Downward (Strong Signal)
           case FVE_STATE_FVE_TURN_FALL_PRICE_TURN_GROW  :  //[Bearish] Mirror Divergence (Volume Reversal)
             return SIGNAL_TYPE_NONE;
           break;
           //--- otherwise, if the main signal matches the direction of the filter signal, return the signal unchanged
           default: return signal;
          }
        break;
      //--- when there is a sell signal
      case SIGNAL_TYPE_SHORT  :
        //--- if the filter State indicates the opposite signal, set the main signal to absent
        switch(fve_state)
          {
           case FVE_STATE_FVE_GROWING_PRICE_GROWING      :  //[Bullish] Confirmed Uptrend (Trend)
           case FVE_STATE_FVE_GROWING_PRICE_FALLING      :  //[Bullish] Sustained Convergence (Accumulation)
           case FVE_STATE_FVE_GROWING_PRICE_TURN_GROW    :  //[Bullish] Price Confirmed Volume Growth
           case FVE_STATE_FVE_FALLING_PRICE_TURN_GROW    :  //[Bullish] Hidden Convergence (Price Reversal)
           case FVE_STATE_FVE_TURN_GROW_PRICE_GROWING    :  //[Bullish] Volume Momentum Catching Up with Price
           case FVE_STATE_FVE_TURN_GROW_PRICE_FALLING    :  //[Bullish] Start of Convergence (FVE Bottom)
           case FVE_STATE_FVE_TURN_GROW_PRICE_TURN_GROW  :  //[Bullish] Synchronous Turn Upward (Strong Signal)
           case FVE_STATE_FVE_TURN_GROW_PRICE_TURN_FALL  :  //[Bullish] Mirrored Convergence (Volume Reversal)
             return SIGNAL_TYPE_NONE;
           break;
           //--- otherwise, if the main signal matches the direction of the filter signal, return the signal unchanged
           default: return signal;
          }
        break;
      //--- return the signal unchanged
      default: return signal;
     }
  }
The function takes the current Expert Advisor signal and the bar index at which the State of the FinVolEleLinRegSl indicator must be obtained. If the Expert Advisor signal is to buy while the indicator State is to sell, the no-signal State is returned. The same applies to a sell signal. This is the simplest thing you can do for a quick test. In general, however, the indicator has many different States, and each one must be handled appropriately.
Certain States can act as a strict filter: the Expert Advisor signal and the filter signal must match for a decision to be made. Other States merely indicate the likely occurrence of an event in the future. Such situations should not be used as a filter; instead, you should wait for the indicator to confirm the event, and only then make a trading decision, which does not necessarily have to result in opening a new position.
At the very beginning of the function, there is a commented-out block of code that displays the indicator State as a comment on the chart. In other words, by uncommenting this block of code, you can clearly view the indicator States in the visual tester and understand how to handle them correctly in the Expert Advisor.
The full code for the Expert Advisor can be found in the files attached to this article.
For the Expert Advisor to work properly, the indicator file must be located in the Expert Advisor's folder: \MQL5\Experts\STOCKS_COMMODITIES\FiniteVolumeElement (FVE)\. The indicator file can also be found in the files attached to the article.
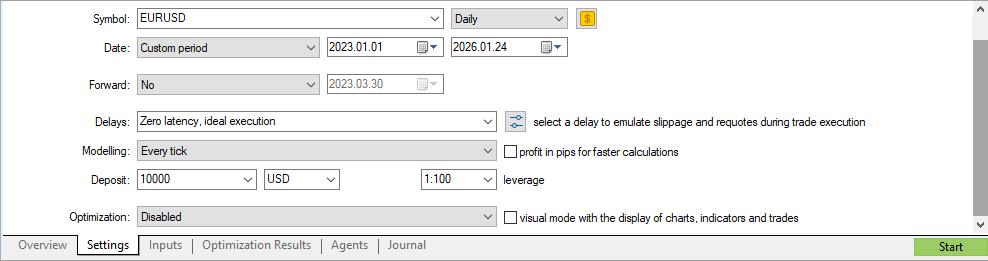
Let's compile the Expert Advisor and set the testing parameters in the Strategy Tester for the EURUSD daily chart from January 1, 2023, to the current date:
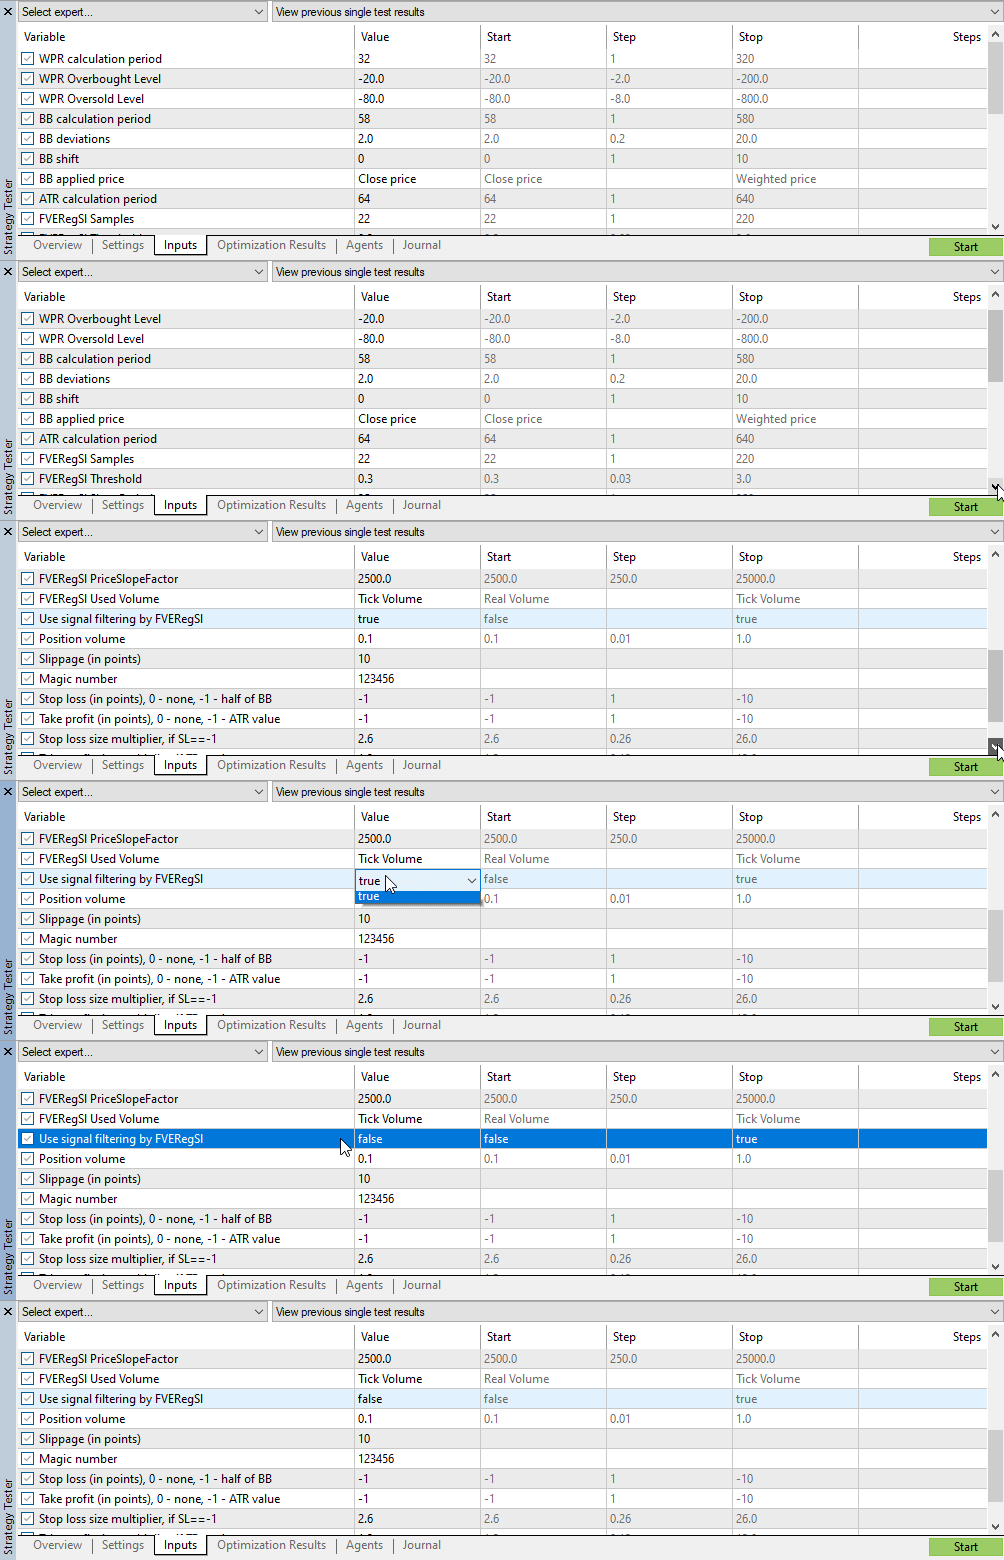
In the Expert Advisor's settings tab, disable signal filtering, leaving the other settings at their default values:
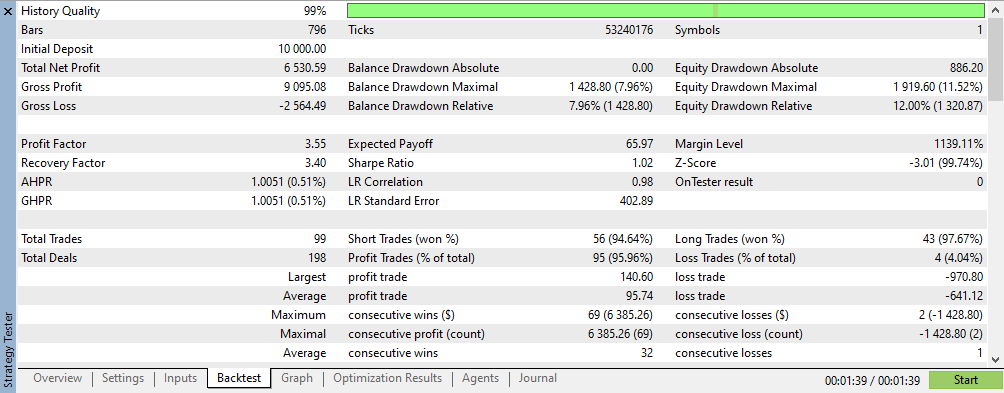
After running the test for the specified period of time, we see the following results:

Now let's enable signal filtering for the Expert Advisor using the FinVolEleLinRegSl indicator:

and run the same test again.
Now we see the following result:
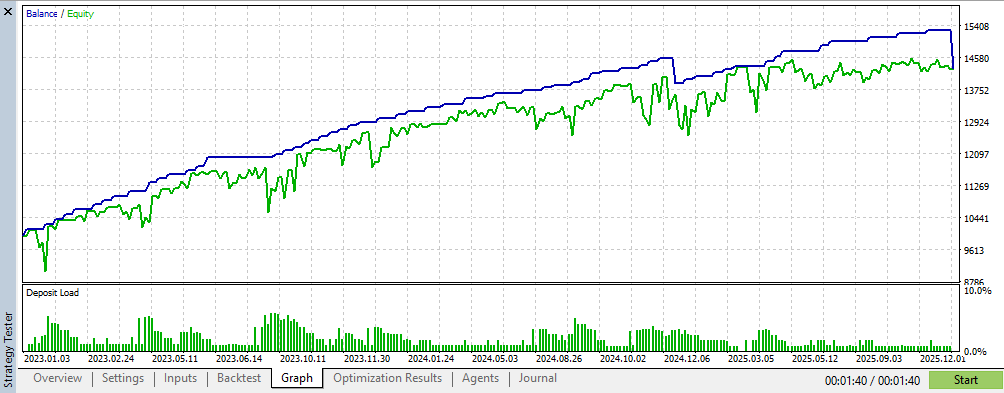

A comparison of the charts shows that, with filtering disabled, there were two significant balance drawdowns in late 2024 and early 2025, whereas with filtering enabled, there was only one such drawdown in late 2024.
Here, we were able to eliminate one unprofitable period. At the same time, the number of trades decreased, which is to be expected, since some trades were not opened due to the filter. Consequently, the total profit decreased while the drawdown remained virtually the same (though it is slightly smaller with the filter). The number of losing trades also decreased slightly.
Whether that is a good result is up to you to decide. But let me repeat: the filter is extremely coarse. It simply disables the Expert Advisor's signals if the signal direction does not match the direction of the filter State.
To fine-tune the filter, you need to review the chart state, the trade direction, and the filter State in the tester's visual mode. In some cases, rather than prohibiting the opening of a position, it may be necessary to move the stop to break-even or enable a trailing stop; in other cases, it may be advisable to either open an opposite position at market price or place a limit pending order in the desired direction.
The topic of fine-tuning the filter is beyond the scope of this article. However, if anyone is interested in this option, they can certainly try extending the enumeration of the Expert Advisor's signal types on their own and have the filtering function return the signals required in each situation. I think that would be quite interesting.
Conclusion
Today, we examined the Finite Volume Elements indicator and its advanced version, Finite Volume Elements + Linear Regression Slope. As a result of some simple testing, we observed a slight improvement in the Expert Advisor's performance, with a reduction in drawdown but a decrease in profitability. Still, it seems that this indicator is well worth considering. Although the idea behind the indicator appeared many years ago, modern trading platforms such as MetaTrader 5 allow us to use time-tested tools in new conditions, visually testing and adapting trading systems to our own objectives and strategies.
All files — the indicators and the Expert Advisor — are attached to this article for independent study, modification, and testing. Do not be afraid to return to the classics of technical analysis — perhaps that is where you will find the key to success in the market!
Programs used in this article:
| # | Name | Type | Description |
|---|---|---|---|
| 1 | FVE.mqh | Indicator | Finite Volume Elements indicator |
| 2 | FinVolEleLinRegSl.mqh | Indicator | Finite Volume Elements + Linear Regression Slope indicator |
| 3 | ExpFVEWPRBB.mqh | Expert Advisor | Expert Advisor for testing indicators |
Translated from Russian by MetaQuotes Ltd.
Original article: https://www.mql5.com/ru/articles/20940
Warning: All rights to these materials are reserved by MetaQuotes Ltd. Copying or reprinting of these materials in whole or in part is prohibited.
This article was written by a user of the site and reflects their personal views. MetaQuotes Ltd is not responsible for the accuracy of the information presented, nor for any consequences resulting from the use of the solutions, strategies or recommendations described.

 Cricket Algorithm (CA)
 Neural Networks in Trading: Decomposition Instead of Scaling — Building Modules
 Neural Networks in Trading: Decomposition Instead of Scaling (Conclusion)
 Adaptive Position Sizing in MQL5: A Prototype Risk Engine with Generalized Kelly and Bootstrap Calibration

- Free trading apps
- Over 8,000 signals for copying
- Economic news for exploring financial markets
You agree to website policy and terms of use
MT5 is a bit odd at times; is this a bug?
MT5 is a bit odd sometimes; is this a bug?
MT5 is a bit of a joke sometimes; is this a bug?
The vertical line indicates the moment the indicators were launched. Their settings can be seen on the chart in the indicator windows.