Discussing the article: "A Forgotten Classic in Volume Analysis: The Finite Volume Elements Indicator for Today's Markets"


You are missing trading opportunities:
- Free trading apps
- Over 8,000 signals for copying
- Economic news for exploring financial markets
Registration
Log in
You agree to website policy and terms of use
If you do not have an account, please register
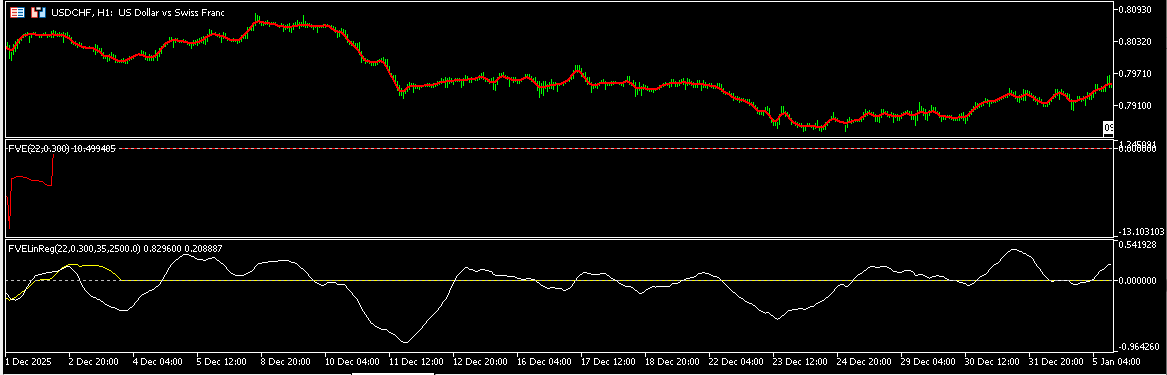
Check out the new article: A Forgotten Classic in Volume Analysis: The Finite Volume Elements Indicator for Today's Markets.
Unlike traditional volume indicators, such as On Balance Volume (OBV) or Accumulation/Distribution, FVE goes beyond simple price-direction measures by filtering out minor fluctuations and reducing market noise. This allows for a more accurate identification of accumulation and distribution periods, as well as the detection of true market trends.
In today’s financial markets, characterized by high volatility and frequent false signals, Finite Volume Elements becomes a particularly relevant tool. Its ability to filter out minor movements and focus on significant changes in volume makes FVE useful for both short-term traders and long-term investors seeking to improve the accuracy of their trading decisions.
Author: Artyom Trishkin