CCI Dashboard for MT5
- 지표
- 버전: 3.90
- 업데이트됨: 3 1월 2026
- 활성화: 10

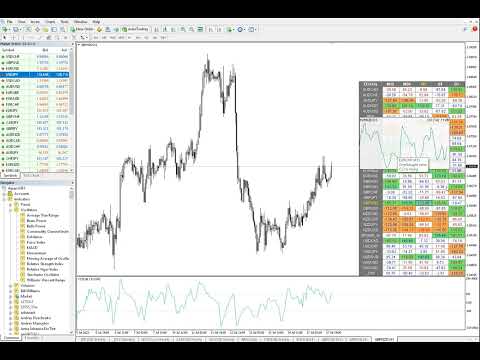
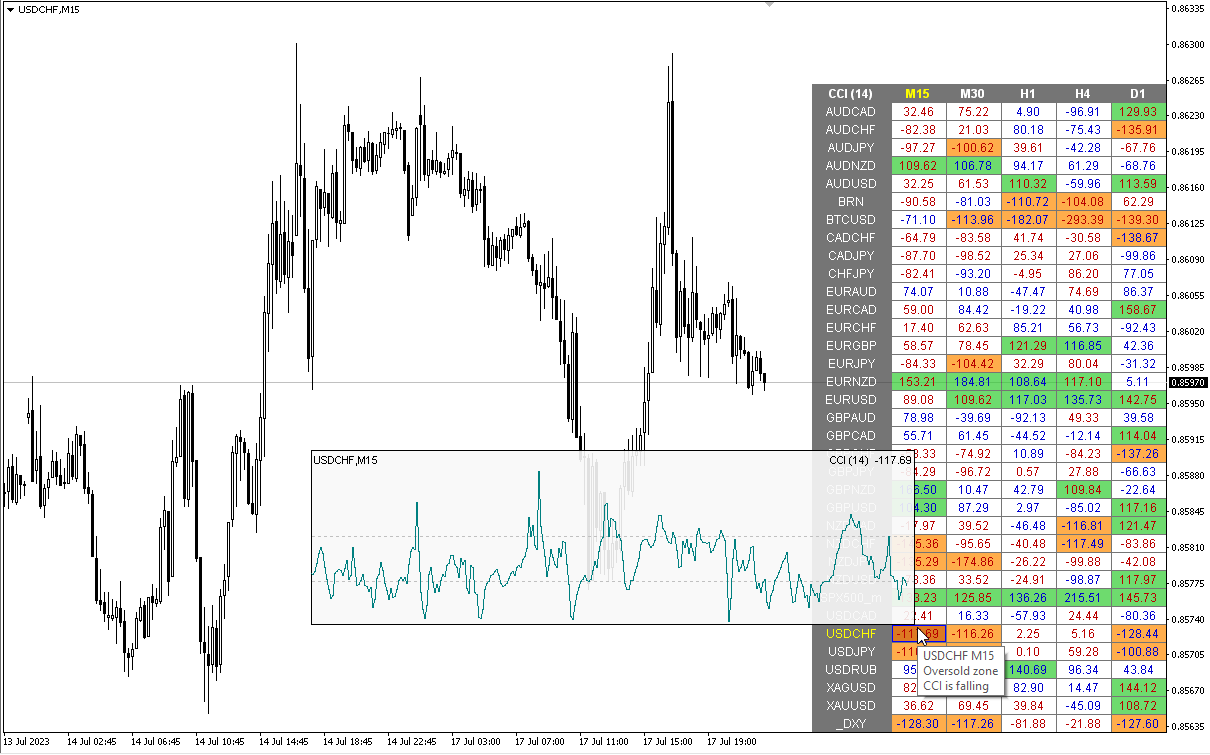
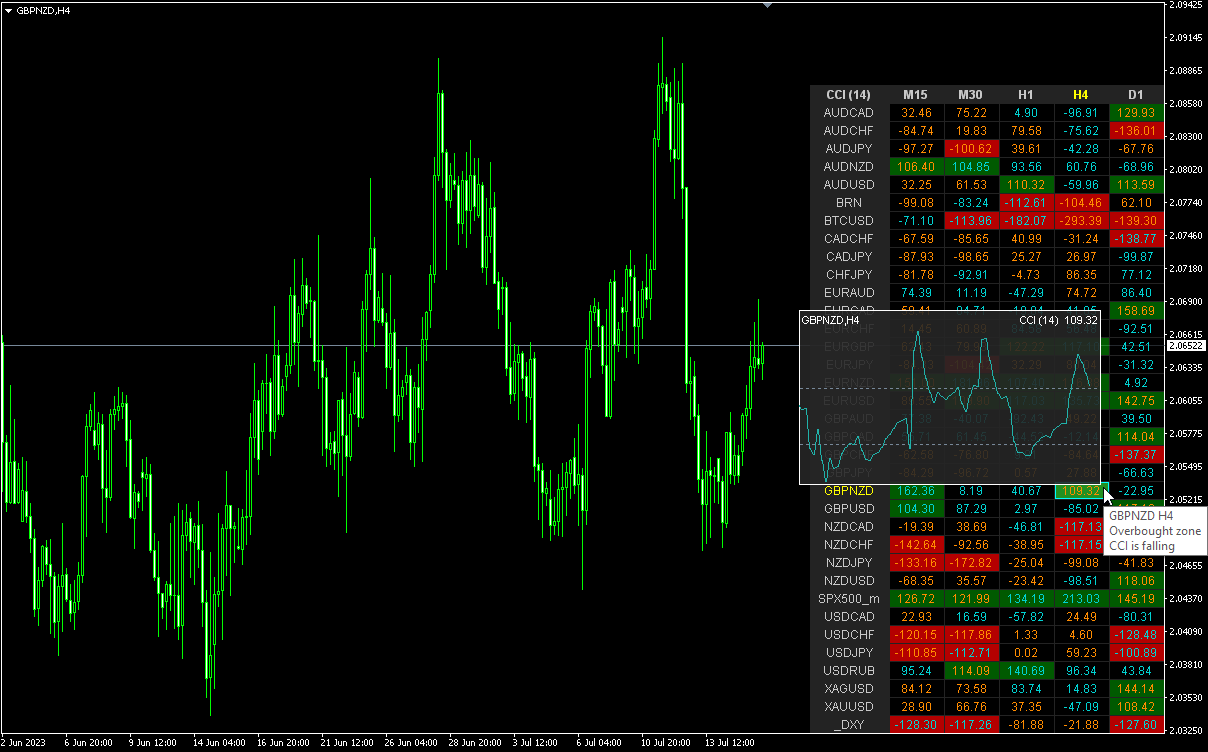
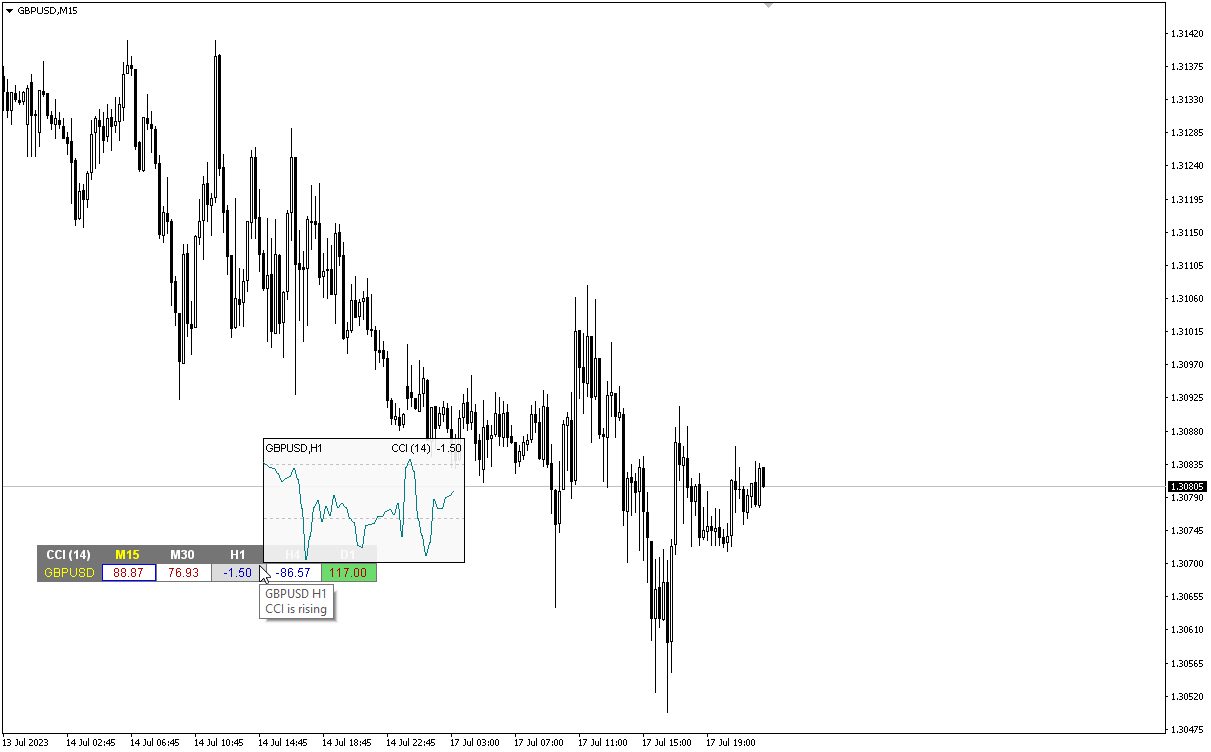
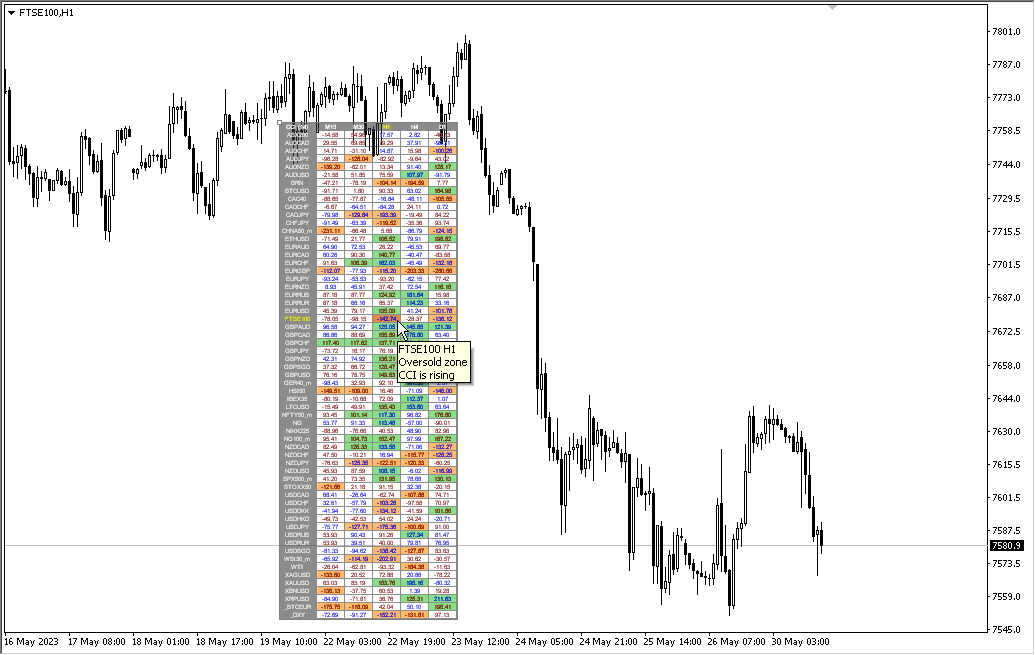
Multicurrency and multitimeframe modification of the Commodity Channel Index (CCI) indicator. You can specify any desired currencies and timeframes in the parameters. Also, the panel can send notifications when crossing overbought and oversold levels. By clicking on a cell with a period, this symbol and period will be opened. This is MTF Scanner.
The key to hide the dashboard from the chart is "D" by default.
Parameters
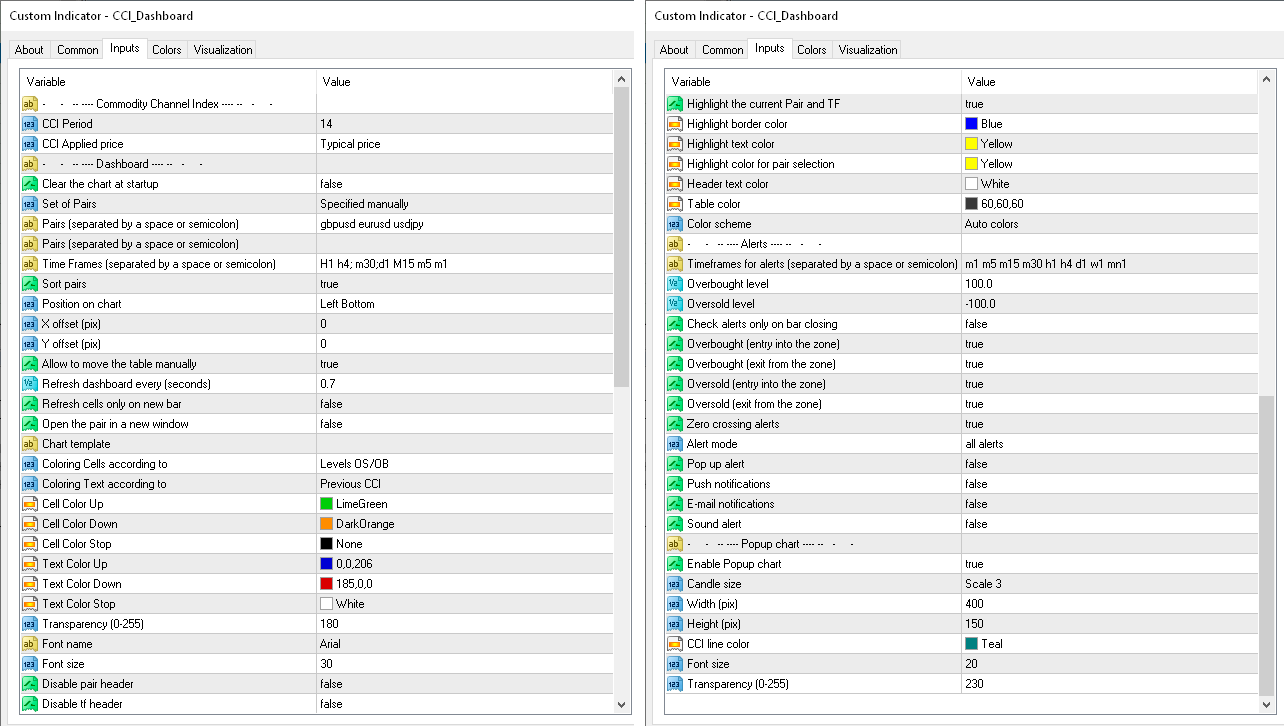
CCI Period — averaging period.CCI Applied price — price type.
Clear the chart at startup — clear the chart at startup.
Set of Pairs — set of symbols
— Market Watch — pairs from the "Market Watch" of the MT;
— Specified manually — pairs specified manually, in the parameters "Pairs".
— Current pair.
Time Frames (separated by a space or semicolon) — list of timeframes separated by spaces or semicolons (multi timeframe).
Sort pairs — sorting the list of pairs.
Position on chart — corner to display the panel on the chart.
X offset (pix) — shift the panel along the X axis.
Y offset (pix) — shift the panel along the Y axis.
Allow to move the table manually.
Refresh dashboard every (seconds) — update period for all pairs and timeframes.
Open the pair in a new window — open a symbol in a new chart window by clicking.
Chart template — the name of the template for the chart, if the chart opens in a new window.
Coloring the cells according to the — paint the cells of the table according to the levels of overbought/oversold or according to the direction of the previous candle.
Color Up — cell color if the indicator increases.
Color Down — cell color if the indicator decreases.
Color Stop — cell color if the indicator does not change.
Transparency (0-255) — transparency of the panel.
Font name — font name.
Font size — font size.
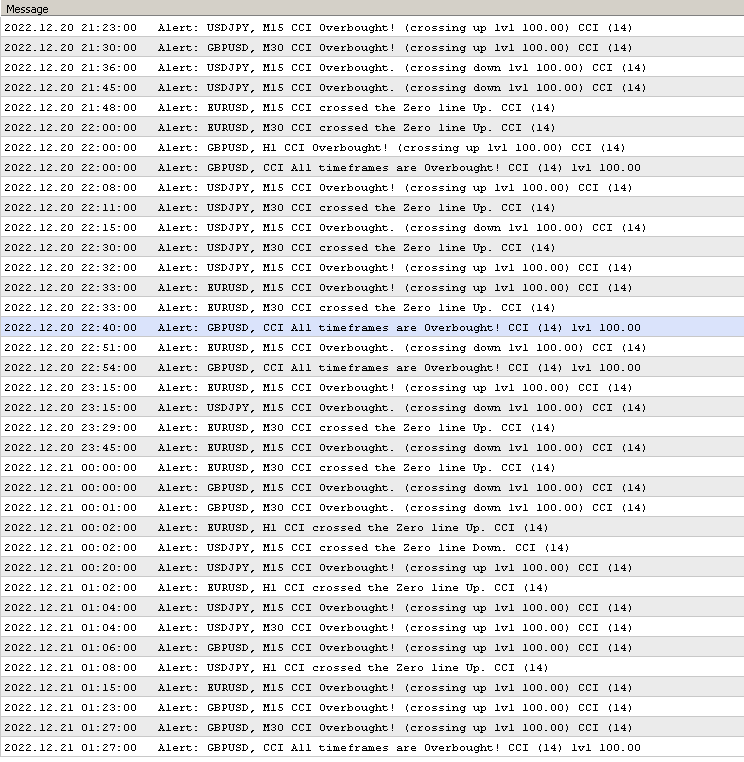
Alerts
Timeframes for alerts (separated by a space or semicolon) — list of periods for which the alert will be sent (separated by a space or semicolon).Overbought level — overbought level for alerts.
Oversold level — oversold level for alerts.
Check alerts only on bar closing — check level crossing only after bar closing.
Enable overbought alerts.
Enable oversold alerts.
Enable zero crossing alerts.
Alert mode
— separated by timeframes — send alerts only from individual TFs.
— combined in a row — send an alert only when all TFs are in the same direction.
— all alerts — both modes.
Pop up alert — pop-up alert.
Push notifications — push notification.
E-mail notifications — e-mail notification.
Sound alert — sound alert.
Popup chart
Enable Popup chart
Candle size
Width (pix)
Height (pix)
Font size
Transparency (0-255).


very useful indicator i have a trend multitimeframe of and overbrought oversold crossing level top