Volume Profile Trading System

Volume Profile Trading System is NOT just another volume indicator. It's a complete trading ecosystem that combines professional volume profile visualization with an intelligent automated trading strategy. While other indicators show you WHERE volume is concentrated, Volume Profile Trading System shows you WHERE, WHEN, and HOW to trade it! displaying real volume distribution by price instead of time. It helps traders identify fair value zones, institutional activity, and high-probability trade areas with precision.

SPECIAL BONUS OFFER  

Every purchase includes our "VP Breakouts EA" absolutely FREE - a $97 value! Allowing full automated trading using the same Volume Profile strategies, After purchase send us a message or leave a comment to receive your special free copy.

Note: The Trendline Breakout EA also works with the Volume Profile indicator. If you have already purchased the TLB EA, you will receive a 50% discount on the indicator

User Guide : https://www.mql5.com/en/blogs/post/766301

INDICATOR FEATURES 

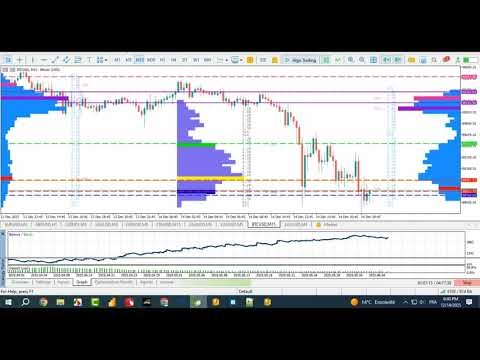
Dual-Side Display Technology

  • Left Side: Bars grow rightward with volume numbers
  • Right Side: Bars grow leftward for mirror effect
  • Clean, professional layout that doesn't clutter your chart

    Smart Volume Distribution

    • Automatic VAH/ VAL /POC detection
    • Adjustable value area percentage (70% default)
    • Real-time volume calculation across bars/sessions/days
    • Works on Forex, Indices, Crypto, Stocks, Metals, Future

      Customizable Visuals

      • Change colors for POC, VAH, VAL lines
      • Adjustable ASCII bar width and transparency
      • Font size and text color customization
      • Show/hide volume numbers and labels

        Flexible Calculation Modes

        • Bar-based calculation (last X bars)
        • Session-based (custom time periods)
        • Daily calculation (current trading day)
        • Use Volume Profile on any timeframe
        • Apply multiple Volume Profiles (VP1,VP2...) on the same chart

          Professional Tools

          • Show volume after bars or in separate column
          • Customizable line widths and styles
          • Price-level labels with directional arrows

          TRADING STRATEGY INCLUDED 

             Volume Profile Breakout Strategy

          • Buy when price breaks structure above VAH
          • Sell when price breaks structure below VAL
          • Designed for strong trends

               Mean Reversion Strategy

            • Sell at VAH (overbought zone)
            • Buy at VAL (oversold zone)
            • Targets return to POC

                 Smart Retest Strategy

              • Trade only after breakout and retest
              • Higher accuracy & reduced drawdown

                   Adaptive Auto Strategy (Recommended)

                • Automatically switches strategy based on market condition
                • Narrow Value Area → Range trading
                • Wide Value Area → Breakout trading

                     Volume-Confirmed Entry Strategy

                  • Trades only when volume confirms the move
                  • Filters out false and weak breakouts
                  • Aligns entries with institutional volume flow

                       Professional Risk Management Strategy

                    • Automatically controls risk on every trade
                    • Adjustable stop loss and take profit
                    • Trade limits and trading hour filters


                      추천 제품
                      BoxChart MT5
                      Evgeny Shevtsov
                      5 (7)
                      The market is unfair if only because 10% of participants manage 90% of funds. An ordinary trader has slim changes to stand against these "vultures". This problem can be solved. You just need to be among these 10%, learn to predict their intentions and move with them. Volume is the only preemptive factor that faultlessly works on any timeframe and symbol. First, the volume appears and is accumulated, and only then the price moves. The price moves from one volume to another. Areas of volume accumu
                      Blahtech Market Profile MT5
                      Blahtech Limited
                      5 (10)
                      Was: $249  Now: $99   Market Profile defines a number of day types that can help the trader to determine market behaviour. A key feature is the Value Area, representing the range of price action where 70% of trading took place. Understanding the Value Area can give traders valuable insight into market direction and establish the higher odds trade. It is an excellent addition to any system you may be using. Inspired by Jim Dalton’s book “Mind Over Markets”, this indicator is designed to suit the
                      The "MR Volume Profile Rectangles 5" indicator is a charting tool that displays trading volume at different price levels rather than time intervals. A key concept in volume profile is the point of control (POC) —the price level with the highest volume traded during the session or time range. While tools like VWAP or OBV provide volume trends, the "MR Volume Profile Rectangles 5" indicator offers granular detail about where the most market activity occurs at specific price levels. This makes it a
                      표시기는 현재 시세를 작성하여 과거 시세와 비교할 수 있으며 이를 바탕으로 가격 변동을 예측합니다. 표시기에는 원하는 날짜로 빠르게 이동할 수 있는 텍스트 필드가 있습니다. 옵션: 기호 - 표시기가 표시할 기호 선택. SymbolPeriod - 지표가 데이터를 가져올 기간 선택. IndicatorColor - 표시기 색상. HorisontalShift - 지시자가 그린 따옴표를 지정된 막대 수만큼 이동합니다. Inverse - true는 인용 부호를 반대로, false - 원래 보기를 반전합니다. ChartVerticalShiftStep - 차트를 수직으로 이동합니다(키보드의 위/아래 화살표). 다음은 날짜를 입력할 수 있는 텍스트 필드의 설정으로, '엔터'를 누르면 즉시 이동할 수 있습니다.
                      Blahtech Supply Demand MT5
                      Blahtech Limited
                      4.54 (13)
                      Was: $299  Now: $99  Supply Demand uses previous price action to identify potential imbalances between buyers and sellers. The key is to identify the better odds zones, not just the untouched ones. Blahtech Supply Demand indicator delivers functionality previously unavailable on any trading platform. This 4-in-1 indicator not only highlights the higher probability zones using a multi-criteria strength engine, but also combines it with multi-timeframe trend analysis, previously confirmed swings a
                      Volume Profile Advance
                      Israr Hussain Shah
                      Daily & Composite Volume Profile   This is a professional-grade market profile tool designed for MetaTrader 5. It utilizes a   Dual-Profile System   to visualize supply, demand, and liquidity concentrations. Key Features Left Side: Daily Session Profiles Automatically identifies the start and end of every trading day. Generates a unique Volume Profile for each individual day. Allows you to see how value migrated from yesterday to today (e.g., Is today's volume higher or lower than yesterday?).
                      Moving VVC mt5
                      Andriy Sydoruk
                      The   Visual Volatility Clustering   indicator clusters the market based on volatility. The indicator does not redraw and gives accurate data, does not use closing prices. Uses the opening prices or the highs or lows of the previous completed bar. Therefore, all information will be clear and unambiguous. The essence of the indicator is to divide the price market into certain areas according to a similar type of volatility. This can be done in any way. In this example, the indicator is configure
                      Value Chart Candlesticks
                      Flavio Javier Jarabeck
                      4.69 (13)
                      The idea of a Value Chart indicator was presented in the very good book I read back in 2020 , " Dynamic Trading Indicators: Winning with Value Charts and Price Action Profile ", from the authors Mark Helweg and David Stendahl. The idea is simple and the result is pure genius: Present candlestick Price analysis in a detrended way! HOW TO READ THIS INDICATOR Look for Overbought and Oversold levels. Of course, you will need to test the settings a lot to find the "correct" one for your approach. It
                      FREE
                      Mirror Chart MT5
                      Andrej Hermann
                      5 (1)
                      The Mirror Chart MT5 is a overlay indicator specifically designed to project a second financial instrument directly onto the main chart window. This tool is invaluable for traders who rely on correlation analysis, as it visualizes the price movements of two different instruments in real time. Unlike traditional overlays, this indicator utilizes intelligent, dynamic centering and scaling logic. It continuously analyzes the visible price range in the current window for both symbols and calculates
                      FREE
                      VolumeProfile MT5
                      Robert Hess
                      4.14 (7)
                      Description: The Volume Profile displays detailed informations of historical trading activities at certain price levels (Market Profile). Locate the areas with the best prices in the market and get an advantage over other market participants. Features: Customizable Market Profile Shows the "fair" Value Area with 70% of all Volume Shows critical low volume zones Shows VPOC, VAL and VAH Points integrated resource management to reduce the load while working with multiple charts Works on all timefr
                      MT4 버전: https://www.mql5.com/en/market/product/166784 MT5 버전: https://www.mql5.com/en/market/product/166785 유동성 프로필 유동성 프로필은 차트에 잠재적 유동성 영역을 동적인 히트맵 스타일 프로필로 표시하는 시각적 시장 구조 도구입니다. 이 지표는 과거 가격 움직임과 틱 볼륨을 분석하여 유동성이 집중될 가능성이 높은 가격 영역을 강조 표시합니다. 다음을 표시합니다. 유동성 라인(잠재적 반응/스윕 레벨) 히트맵 프로필 박스(유동성 집중 영역) POC/최대 유동성 레벨(감지된 최고 집중도) 결과적으로 트레이더가 다음을 파악하는 데 도움이 되는 깔끔한 시각적 프로필이 생성됩니다. 잠재적 자석 레벨, 스윕 가능성이 높은 영역, 현재 가격 상/하의 반응 영역, 진입, 청산 및 위험 관리에 대한 맥락. 주요 기능 동적 유동성 히트맵 프로필 틱 거래량 가중 가격 영역 최대 유동성 지점(POC) 강조 표
                      Smart SD Rectangle Tool
                      Liam Alex Thomas Webb
                      스마트 공급 및 수요 사각형 도구 인디케이터는 MT5에서 최고의 동반자로, 주요 공급 및 수요 데이터를 즉시 시각화하여 필요한 곳에서 실시간으로 확인할 수 있습니다. 이 도구는 구역 위에 풍부하고 실행 가능한 데이터를 자동으로 오버레이하여 구역 분류, 핍 거리, 강도, 구역 크기 등을 각 구역 안에 깔끔하게 표시합니다. 더 이상 복잡함이나 추측이 필요 없습니다—명확하고 역동적인 인사이트로 여러분의 결정을 지원합니다. 트레이더를 위해 제작. 정밀함으로 구동. 인트라데이 스캘핑을 하든 일일 차트에서 주요 구역을 분석하든, 이 인디케이터는 수동으로 그린 구역을 즉시 스마트 구역으로 전환하여 작업 흐름을 방해하지 않으면서 차트의 정보 가치를 높입니다. ### 주요 기능 **자동 레벨 감지** - 차트상의 모든 구역을 즉시 인식 - 공급 또는 수요로 자동 분류—수동 태깅 불필요 **풍부한 실시간 메트릭** - 표시 항목:   - 구역 크기   - 현재 가격과의 실시간 핍 거리   -
                      VP hidden
                      Emr Aljnaby
                      4.33 (12)
                      The indicator works to convert normal volume into levels and determine financial liquidity control points. It is very similar in function to Fixed Volume Profile. But it is considered more accurate and easier to use than the one found on Trading View because it calculates the full trading volumes in each candle and in all the brokers present in MetaTrade, unlike what is found in Trading View, as it only measures the broker’s displayed prices. To follow us on social media platforms: telegram
                      FREE
                      Overview Market Volume Profile Modes is a powerful MT5 volume distribution indicator that integrates multiple Volume Profile variants. Users can switch between different analysis modes through a simple menu selection. This indicator helps traders identify key price levels, support and resistance zones, and market volume distribution. Core Concepts • POC (Point of Control): The price level with the highest volume concentration, representing the market's accepted "fair value" area • VAH (Value A
                      VisualVol EURUSD
                      Maxim Kuznetsov
                      The indicator highlights the points that a professional trader sees in ordinary indicators. VisualVol visually displays different volatility indicators on a single scale and a common align. Highlights the excess of volume indicators in color. At the same time, Tick and Real Volume, Actual range, ATR, candle size and return (open-close difference) can be displayed. Thanks to VisualVol, you will see the market periods and the right time for different trading operations. This version is intended f
                      FREE
                      This z-score indicator shows the correct z-score of an asset, as it uses the normalized price data for calculation, which is the only correct way. Z-score is only applicable for normal distributed data, therefore not the actual price is considered, but the normalised returns, which were assumed to follow a normal distribution. Returns are mean reverting and assumed to follow a normal distribution, therefore z-score calculation of returns is more reliable than z-score on price, as price is NOT m
                      Breakout Boxes with Volume Pressure This indicator automates the identification of key consolidation zones (Supply and Demand) based on Market Pivots and Volatility (ATR). Unlike standard support/resistance tools, this indicator provides a unique   Volume Pressure Analysis   inside every box, giving you insight into the battle between Buyers and Sellers before a breakout occurs. Key Features Automated Supply & Demand Zones:   Automatically detects significant Pivot Highs and Lows to draw dyna
                      Haven Volume Profile
                      Maksim Tarutin
                      4.56 (9)
                      Haven Volume Profile은 거래량 분포를 기반으로 중요한 가격 수준을 식별하는 데 도움이 되는 다기능 볼륨 프로파일 분석 지표입니다. 시장을 더 잘 이해하고 중요한 진입 및 퇴장 지점을 식별하려는 전문 트레이더를 위해 설계되었습니다. 기타 제품 ->  여기 주요 기능: Point of Control (POC) 계산 - 최대 거래 활동 수준으로, 가장 유동성이 높은 수준을 식별하는 데 도움이 됩니다 Value Area 정의 (높은 활동 영역) 및 사용자 지정 가능한 거래량 비율로 거래 범위를 보다 정확하게 평가할 수 있습니다 틱 거래량과 실제 거래량 모두 지원, 다양한 시장 유형과 거래 전략에 적합 계산 기간(일 수)의 유연한 설정으로 모든 시간 프레임에 도구를 적용할 수 있습니다 터미널의 밝은 테마와 어두운 테마에 자동 적응하여 사용자 인터페이스의 시각적 경험을 향상시킵니다 레벨 시각화가 명확하고 스타일과 색상을 사용자 지정할 수 있어 빠른 의사 결정을 돕습니다 이 지표
                      FREE
                      This Volume Delta Profile is an advanced MetaTrader 5 indicator that visualizes   volume delta (order flow imbalance)   using a volume profile-style histogram. It shows the difference between buying and selling pressure at specific price levels, helping traders identify supply and demand zones. This indicator provides a unique perspective on market dynamics by visualizing the imbalance between buying and selling pressure, offering insights beyond traditional volume analysis. Core Concept Positiv
                      Harmonic Pattern Structure Harmonic Pattern Structure is a professional MetaTrader 5 indicator that automatically detects classic harmonic patterns using strict Fibonacci ratio validation and XABCD price structure. Designed for traders who value precision, clean visuals, and structured analysis, the indicator highlights potential reversal zones based on price geometry, supporting consistent and objective decision-making. SUPPORTED HARMONIC PATTERNS Gartley (222) Butterfly Bat Crab Shark Cy
                      Volume Profile For MT5
                      Abdelkhabir Yassine Alaoui
                      Volume Profile is a very useful indicator . it allows you to spot the price levels where important price action took place. It is similar to support and resistance levels but with a different logic. ( Check Out  Fixed Range Volume Profile MT5  ) One of the first thing that traders mark up when analyzing a chart is support and resistance. Volume Profile can be used for doing that too. The indicator scans the defined number of previous bars and calculates the volume of activity at each price le
                      Market Depth Pro: 궁극의 오더 플로우 및 시장 미시구조 터미널 과거를 거래하지 마십시오. 라이브 옥션(Live Auction) 거래를 시작하십시오. Market Depth Pro 는 표준 MetaTrader 5 차트를 전문가 수준의 오더 플로우 및 시장 미시구조 터미널로 완전히 변환합니다. 진지한 데이 트레이더와 스캘퍼를 위해 설계된 이 올인원 도구는 틱 단위 데이터를 분석하여 기관이 정확히 어디에서 매수, 매도하고 개인 트레이더를 함정에 빠뜨리는지 드러냅니다.    진정한 델타를 확인하고, 거래량을 추적하며, 실시간으로 시장의 흐름(내러티브)을 읽어보세요. 틱 단위 오더 플로우 및 호가창(DOM): * 공격적인 매수자와 매도자의 대결을 실시간으로 추적합니다.    풋프린트(Footprint) 스타일의 호가창 데이터를 차트 위에 겹쳐진 수평 막대 형태로 직접 시각화합니다.    즉시 통제 지점(POC) 을 식별하고 매수/매도 델타를 계산하여 누가 진정으로 주도권을 쥐고
                      Volume Profile V6
                      Andrey Kolesnik
                      4.67 (3)
                      시장 매물대 지표(Volume Profile) + 스마트 오실레이터. 통화 쌍, 주식, 선물, 암호화폐 등 거의 모든 종목에서 작동하며, 실제 거래량(Real Volume)과 틱 거래량(Tick Volume)을 모두 지원합니다. 프로파일 생성 범위를 일주일이나 한 달 등으로 자동 설정할 수 있을 뿐만 아니라, 두 개의 수직선(빨간색과 파란색)을 이동하여 수동으로 범위를 설정할 수도 있습니다. 히스트그램 형태로 표시되며, 특정 가격 수준의 히스토그램 너비는 해당 가격대에서 발생한 거래량을 의미합니다. Mode level line color 파라미터를 사용하면 가격이 반등할 가능성이 높은 주요 매물대 수준을 자동으로 표시할 수 있으며, Maximum color 파라미터는 설정된 전체 범위에서 거래가장 많이 발생한 최대 거래량 수준을 별도로 보여줍니다. 스마트 오실레이터는 과매수 및 과매도 구간을 표시합니다. 여러 지표로부터 오는 정보를 분석하고, 처리된 데이터를 바탕으로 과매수 및 과매
                      Market Profile 3 ForexArby com
                      Hussien Abdeltwab Hussien Ryad
                      4 (15)
                      Market Profile 3 MetaTrader 5 indicator  version 4.70— is a classic Market Profile implementation that can show the price density over time, outlining the most important price levels, value area, and control value of a given trading session. This indicator can be attached to timeframes between M1 and D1 and will show the Market Profile for daily, weekly, monthly, or even intraday sessions. Lower timeframes offer higher precision. Higher timeframes are recommended for better visibility. It is als
                      FREE
                      Aggression Volume
                      Flavio Javier Jarabeck
                      4.29 (17)
                      Aggression Volume Indicator is the kind of indicator that is rarely found in the MQL5 community because it is not based on the standard Volume data provided by the Metatrader 5 platform. It requires the scrutiny of all traffic Ticks requested on the platform... That said, Aggression Volume indicator requests all Tick Data from your Broker and processes it to build a very special version of a Volume Indicator, where Buyers and Sellers aggressions are plotted in a form of Histogram. Additionally,
                      FREE
                      Volume Profile Density v2
                      Vincent Jose Proenca
                      Volume Profile Density V2.40 가격 수준별 거래량 분포를 표시하여 기관 투자자의 관심 구간을 보여줍니다. 시간 기반 거래량과 달리, 실제 거래가 집중된 위치를 보여줍니다. 기본 원리: 수평 막대 = 가격별 거래량 막대가 길수록 거래량이 많음 빨간 구간 = 주요 지지 / 저항 구간 주요 사용 목적: 실제 지지선과 저항선 식별 POC (Point of Control) 확인 가치 영역 (총 거래량의 70%) 설정 낮은 거래량 구간을 손절 / 목표 지점으로 활용 색상 코드: 파란색 = 낮은 거래량 (빠른 이동 구간) 노란색 = 중간 거래량 (균형 구간) 빨간색 = 높은 거래량 (기관 매매 구간) 트레이딩 전략: 빨간 구간 반등 시 매수 VAH 또는 빨간 구간 저항 시 매도 거래량 동반 POC 돌파 시 진입 POC 회귀 시 재진입 파란 구간을 목표로 설정 설정: 초보자: 1.0 / 100% / 1.0 스캘핑: 0.5 / 200% / 0.5 스윙: 2.0 / 50% / 1
                      FREE
                      Weis Waves
                      Flavio Javier Jarabeck
                      2.83 (18)
                      The original author is David Weis, an expert in the Wyckoff Method. The Weis Wave is a modern adaptation of the 1930's Wyckoff Method, another expert in Tape Reading techniques and Chart Analysis. Weis Waves takes market volume and stacks it into waves according to price conditions giving the trader valuable insights about the market conditions. If you want to learn more about this subject you can find tons of videos in YouTube. Just look for "The Wickoff Method", "Weis Wave" and "Volume Spread
                      FREE
                      Delta Profile Volume
                      Teresinha Moraes Correia
                      기술 설명 – MetaTrader 5용 Delta Profile Delta Profile 은 MetaTrader 5에서 정의된 캔들 범위 내의 거래량 흐름을 세부적으로 분석하기 위해 설계된 지표입니다. 이 도구는 각 가격 수준에서 양의 거래량(상승과 관련) 과 음의 거래량(하락과 관련) 간의 불균형을 구조화하고 시각화합니다. 이를 통해 사용자는 실제로 거래가 집중되는 가격 영역과 시장 불균형이 형성되는 구간을 명확하게 파악할 수 있습니다. 핵심 개념 지표는 가격 레벨 을 인식하고 이를 양의 거래량, 음의 거래량 및 순 델타(양-음 차이)로 분류합니다. 각 가격 레벨은 수평 막대 로 차트에 표시되며, 거래가 집중되는 구간을 직관적으로 보여줍니다. 사용자는 분석할 캔들의 개수 , 가격 반올림 정밀도 , 최대 표시 레벨 수 , 표시 옵션 등을 직접 설정할 수 있습니다. 주요 기능 가격 레벨 매핑 : 사용자가 지정한 자릿수에 맞게 가격을 반올림하여 거래량을 집계합니다. 순 델타 계산 : 양
                      BoxInside MT5
                      Evgeny Shevtsov
                      5 (4)
                      This indicator calculates the volume profile and places labels that correspond to the VAH, VAL and POC levels, for each candle individually. Indicator operation features The indicator works on the timeframes from M3 to MN, but it uses the history data of smaller periods: M1 - for periods from M3 to H1, M5 - for periods from H2 to H12, M30 - for the D1 period, H4 - for the W1 period, D1 - for the MN period. The color and location of the VAL, VAH and POC labels on the current candle are considere
                      FREE
                      Elevate Your Trading with Advanced Anchored Volume Weighted Average Price Technology Unlock the true power of price action with our premium Anchored VWAP Indicator for MetaTrader 5 - the essential tool for precision entries, strategic exits, and high-probability trend continuation setups. Write me a DM for a 7 day free trial.  Anchored VWAP Plus gives traders unprecedented control by allowing custom anchor points for Volume Weighted Average Price calculations on any chart. With support for 4 sim
                      FREE
                      이 제품의 구매자들이 또한 구매함
                      Divergence Bomber
                      Ihor Otkydach
                      4.89 (83)
                      이 지표를 구매하신 분께는 다음과 같은 혜택이 무료로 제공됩니다: 각 거래를 자동으로 관리하고, 손절/익절 수준을 설정하며, 전략 규칙에 따라 거래를 종료하는 전용 도우미 툴 "Bomber Utility" 다양한 자산에 맞게 지표를 설정할 수 있는 셋업 파일(Set Files) "최소 위험", "균형 잡힌 위험", "관망 전략" 모드로 설정 가능한 Bomber Utility의 셋업 파일 이 전략을 빠르게 설치, 설정, 시작할 수 있도록 돕는 단계별 영상 매뉴얼 주의: 위의 모든 보너스를 받기 위해서는 MQL5 개인 메시지 시스템을 통해 판매자에게 연락해 주세요. 독창적인 커스텀 지표인 “Divergence Bomber(다이버전스 봄버)”를 소개합니다. 이 지표는 MACD 다이버전스(괴리) 전략을 기반으로 한 올인원(All-in-One) 거래 시스템입니다. 이 기술 지표의 주요 목적은 가격과 MACD 지표 간의 다이버전스를 감지하고, **향후 가격이 어느 방향으로 움직일지를 알려주는
                      Azimuth Pro
                      Ottaviano De Cicco
                      5 (4)
                      LAUNCH PROMO Azimuth Pro price is initially set at 299$ for the first 100 buyers. Final price will be 499$ . THE DIFFERENCE BETWEEN RETAIL AND INSTITUTIONAL ENTRIES ISN'T THE INDICATOR — IT'S THE LOCATION. Most traders enter at arbitrary price levels, chasing momentum or reacting to lagging signals. Institutions wait for price to reach structured levels where supply and demand actually shift. Azimuth Pro maps these levels automatically: swing-anchored VWAP, multi-timeframe structure lines, an
                      Entry In The Zone and SMC Multi Timeframe is a real-time market analysis tool developed based on Smart Money Concepts (SMC). It is designed to analyze market structure, price direction, reversal points, and key zones across multiple timeframes in a systematic way. The system displays Points of Interest (POI) and real-time No Repaint signals, with instant alerts when price reaches key zones or when signals occur within those zones. It functions as both an Indicator and a Signal System (2-in-1), c
                      이 지표를 구매하면 제 프로페셔널 트레이드 매니저를 무료로 드립니다. 우선 이 거래 시스템이 리페인팅, 리드로잉 및 레이그 인디케이터가 아니라는 점을 강조하는 것이 중요합니다. 이는 수동 및 로봇 거래 모두에 이상적인 것으로 만듭니다. 온라인 강좌, 설명서 및 프리셋 다운로드. "스마트 트렌드 트레이딩 시스템 MT5"은 새로운 및 경험이 풍부한 트레이더를 위해 맞춤형으로 제작된 종합적인 거래 솔루션입니다. 10개 이상의 프리미엄 인디케이터를 결합하고 7개 이상의 견고한 거래 전략을 특징으로 하여 다양한 시장 조건에 대한 다목적 선택이 가능합니다. 트렌드 추종 전략: 효과적인 트렌드 추이를 타기 위한 정확한 진입 및 손절 관리를 제공합니다. 반전 전략: 잠재적인 트렌드 반전을 식별하여 트레이더가 범위 시장을 활용할 수 있게 합니다. 스캘핑 전략: 빠르고 정확한 데이 트레이딩 및 단기 거래를 위해 설계되었습니다. 안정성: 모든 인디케이터가 리페인팅, 리드로잉 및 레이그가 아니므로 신뢰
                      FX Trend MT5 NG
                      Daniel Stein
                      5 (4)
                      FX Trend NG: 차세대 멀티 마켓 트렌드 인텔리전스 개요 FX Trend NG 는 다중 시간 프레임 기반의 전문 트렌드 분석 및 시장 모니터링 도구입니다. 몇 초 만에 전체 시장 구조를 파악할 수 있도록 설계되었습니다. 여러 차트를 일일이 전환할 필요 없이, 어떤 종목이 추세에 있는지, 어디에서 모멘텀이 약화되고 있는지, 그리고 어떤 시간 프레임이 서로 정렬되어 있는지 즉시 확인할 수 있습니다. 출시 기념 특별 혜택 – FX Trend NG 를 $30 (6개월) 또는 $80 평생 라이선스 로 이용할 수 있습니다. 이미 Stein Investments 고객이신가요? -> 메시지를 보내 전용 고객 그룹에 참여하세요. 설정이나 사용 방법이 필요하신가요? -> Stein Investments 공식 페이지 를 방문하세요. 1. FX Trend NG가 특별한 이유 3단계 추세 로직 – 단순한 Buy / Sell이 아닙니다 • 대부분의 지표는 Buy 또는 Sell 두 가지 상태만 제
                      Trend Screener Pro MT5
                      STE S.S.COMPANY
                      4.84 (101)
                      트렌드 표시기, 트렌드 트레이딩 및 필터링을 위한 획기적인 고유 솔루션, 하나의 도구 안에 내장된 모든 중요한 트렌드 기능! Forex, 상품, 암호 화폐, 지수 및 주식과 같은 모든 기호/도구에 사용할 수 있는 100% 다시 칠하지 않는 다중 시간 프레임 및 다중 통화 표시기입니다. Trend Screener는 차트에 점이 있는 화살표 추세 신호를 제공하는 효율적인 지표 추세 추종 지표입니다. 추세 분석기 표시기에서 사용할 수 있는 기능: 1. 트렌드 스캐너. 2. 최대 이익 분석이 있는 추세선. 3. 추세 통화 강도 측정기. 4. 경고가 있는 추세 반전 점. 5. 경고가 있는 강력한 추세 점. 6. 추세 화살표 Trend Screener Indicator가 있는 일일 분석 예, 일일 신호 성능...등은 여기에서 찾을 수 있습니다. 여기를 클릭하십시오. LIMITED TIME OFFER : Trend Screener Indicator는 50$ 및 평생 동안만 사용할 수 있습니다.
                      Grabber System MT5
                      Ihor Otkydach
                      4.83 (23)
                      탁월한 기술적 지표인 Grabber를 소개합니다. 이 도구는 즉시 사용 가능한 “올인원(All-Inclusive)” 트레이딩 전략으로 작동합니다. 하나의 코드 안에 강력한 시장 기술 분석 도구, 매매 신호(화살표), 알림 기능, 푸시 알림이 통합되어 있습니다. 이 인디케이터를 구매하신 모든 분들께는 다음의 항목이 무료로 제공됩니다: Grabber 유틸리티: 오픈 포지션을 자동으로 관리하는 도구 단계별 영상 매뉴얼: 설치, 설정, 그리고 실제 거래 방법을 안내 맞춤형 세트 파일: 인디케이터를 빠르게 자동 설정하여 최고의 성과를 낼 수 있도록 도와줍니다 다른 전략은 이제 잊어버리세요! Grabber만이 여러분을 새로운 트레이딩의 정점으로 이끌어 줄 수 있습니다. Grabber 전략의 주요 특징: 거래 시간 프레임: M5부터 H4까지 거래 가능한 자산: 어떤 자산이든 사용 가능하지만, 제가 직접 테스트한 종목들을 추천드립니다 (GBPUSD, GBPCAD, GBPCHF, AUDCAD, AU
                      AriX
                      Temirlan Kdyrkhan
                      1 (4)
                      AriX Indicator for MT5 A powerful trend-following and signal-evaluation tool AriX is a custom MT5 indicator that combines Moving Averages and ATR-based risk/reward logic to generate clear buy/sell signals. It visualizes dynamic SL/TP levels, evaluates past trade outcomes, and displays win/loss statistics in a clean on-chart panel. Key features include: Buy/Sell signals based on MA crossovers ATR-based SL/TP1/TP2/TP3 levels with visual lines and labels Signal outcome tracking with real-time stat
                      RFI levels PRO MT5
                      Roman Podpora
                      3.67 (3)
                      이 지표는 추세 반전 지점과 가격 반등 영역을 정확하게 보여줍니다.       주요 투자자들   . 새로운 트렌드가 형성되는 곳을 파악하고 최대한 정확하게 의사결정을 내리며 모든 거래를 완벽하게 통제합니다. TREND LINES PRO   지표와 함께 사용할 때 최대의 잠재력을 발휘합니다.  VERSION MT4 지표가 보여주는 내용: 새로운 추세의 시작 시 활성화되는 반전 구조 및 반전 수준. 최소한의 위험 대비 수익률을 갖는 이익 실현   (TAKE PROFIT)   및   손절매(STOP LOSS)   레벨 표시       RR 1:2   . 지능형 손실 감소 로직이 적용된 손절매 기능. 지정된 지표에서 두 가지 추세 유형에 대한 반전 패턴을 표시합니다. 지표: 트렌드를 따라   트렌드 라인 프로   (글로벌 트렌드 변화) 트렌드 프로   (빠른 트렌드 변화) 간단하고 효과적입니다       스캐너       실시간 추세 (신규). 다중 시간 프레임 도구 필터링. 표시하다  
                      Atomic Analyst MT5
                      Issam Kassas
                      4.03 (30)
                      우선적으로 언급할 점은이 거래 지표가 다시 그리지 않고 지연되지 않으며 이를 통해 수동 및 로봇 거래 모두에 이상적이라는 점입니다. 사용자 매뉴얼: 설정, 입력 및 전략. Atomic Analyst는 가격의 강도와 모멘텀을 활용하여 시장에서 더 나은 이점을 찾는 PA Price Action Indicator입니다. 고급 필터를 장착하여 잡음과 거짓 신호를 제거하고 거래 잠재력을 높이는 데 도움이 됩니다. 복잡한 지표의 다중 레이어를 사용하여 Atomic Analyst는 차트를 스캔하고 복잡한 수학적 계산을 간단한 신호와 색상으로 변환하여 초보 트레이더가 이해하고 일관된 거래 결정을 내릴 수 있도록합니다. "Atomic Analyst"는 새로운 및 경험이 풍부한 트레이더를위한 종합적인 거래 솔루션입니다. 프리미엄 지표와 최고 수준의 기능을 하나의 거래 전략에 결합하여 모든 종류의 트레이더에 대한 다재다능한 선택지가되었습니다. 인트라데이 거래 및 스캘핑 전략 : 빠르고 정확한 일일
                      OmniSync Projection
                      Antonio-alin Teculescu
                      5 (1)
                      Chronos Fractal Engine is an innovative price projection indicator for MetaTrader 5, designed to transform your technical analysis by intelligently identifying and projecting historical price patterns. Built upon an advanced correlation algorithm and the fractal principles of the market, this powerful tool visualizes potential future price movements, giving you a unique edge in your trading decisions. What is Chronos Fractal Engine? At its core, the Chronos Fractal Engine employs a sophisticat
                      FX Power MT5 NG
                      Daniel Stein
                      5 (31)
                      FX Power: 통화 강세 분석으로 더 스마트한 거래 결정을 개요 FX Power 는 어떤 시장 상황에서도 주요 통화와 금의 실제 강세를 이해하기 위한 필수 도구입니다. 강한 통화를 매수하고 약한 통화를 매도함으로써 FX Power 는 거래 결정을 단순화하고 높은 확률의 기회를 발견합니다. 트렌드를 따르거나 극단적인 델타 값을 사용해 반전을 예측하고자 한다면, 이 도구는 귀하의 거래 스타일에 완벽히 적응합니다. 단순히 거래하지 말고, FX Power 로 더 스마트하게 거래하세요. 1. FX Power가 거래자에게 매우 유용한 이유 통화와 금의 실시간 강세 분석 • FX Power 는 주요 통화와 금의 상대적 강세를 계산하고 표시하여 시장 역학에 대한 명확한 통찰력을 제공합니다. • 어떤 자산이 앞서고 있고 어떤 자산이 뒤처지는지 모니터링하여 보다 현명한 거래 결정을 내릴 수 있습니다. 포괄적인 멀티 타임프레임 뷰 • 단기, 중기 및 장기 타임프레임에서 통화와 금의 강세를
                      우선적으로, 이 거래 도구는 전문적인 거래에 이상적인 비-다시 그리기 및 지연되지 않는 지표입니다.  온라인 강좌, 사용자 매뉴얼 및 데모. 스마트 가격 액션 컨셉트 인디케이터는 신규 및 경험 많은 트레이더 모두에게 매우 강력한 도구입니다. Inner Circle Trader Analysis 및 Smart Money Concepts Trading Strategies와 같은 고급 거래 아이디어를 결합하여 20가지 이상의 유용한 지표를 하나로 결합합니다. 이 인디케이터는 스마트 머니 컨셉트에 중점을 두어 대형 기관의 거래 방식을 제공하고 이동을 예측하는 데 도움을 줍니다.  특히 유동성 분석에 뛰어나 기관이 어떻게 거래하는지 이해하는 데 도움을 줍니다. 시장 트렌드를 예측하고 가격 변동을 신중하게 분석하는 데 탁월합니다. 귀하의 거래를 기관 전략에 맞추어 시장의 동향에 대해 더 정확한 예측을 할 수 있습니다. 이 인디케이터는 시장 구조를 분석하고 중요한 주문 블록을 식별하고 다양
                      ARIPoint
                      Temirlan Kdyrkhan
                      ARIPoint is a powerful trading companion designed to generate high-probability entry signals with dynamic TP/SL/DP levels based on volatility. Built-in performance tracking shows win/loss stats, PP1/PP2 hits, and success rates all updated live. Key Features: Buy/Sell signals with adaptive volatility bands Real-time TP/SL/DP levels based on ATR Built-in MA Filter with optional ATR/StdDev volatility Performance stats panel (Success, Profit/Loss, PP1/PP2) Alerts via popup, sound, push, or email Cu
                      Trend indicator AI mt5
                      Ramil Minniakhmetov
                      5 (15)
                      트렌드 인공 지능 지표는 실행 가능한 진입 점 및 반전 경고와 추세 식별을 결합하여 상인의 시장 분석을 향상시킬 훌륭한 도구입니다. 이 표시기는 사용자가 자신감과 정밀도로 외환 시장의 복잡성을 탐색 할 수 있도록 지원합니다 기본 신호 외에도 트렌드 인공 지능 지표는 풀백 또는 되돌림 중에 발생하는 2 차 진입 점을 식별하여 거래자가 기존 트렌드 내에서 가격 수정을 활용할 수 있도록합니다. 중요한 장점: ·작동 4 및 5 *명확한 구매 또는 판매 신호 *다시 칠하지 않습니다 *모든 자산에서 작동 나는 전보 사기에 개 또는 세트를 판매하지 않도록주의. 모든 설정은 블로그에 여기에 무료.  중요! 지침 및 보너스를 얻기 위해 구입 후 즉시 저에게 연락! 진짜 가동 감시는 뿐 아니라 나의 다른 제품 여기에서 찾아낼 수 있습니다: https://www.mql5.com/en/users/mechanic/seller&nbsp ; 설정 및 입력: 모든 자산에 대해 기본 설정을 권
                      RelicusRoad Pro MT5
                      Relicus LLC
                      5 (24)
                      RelicusRoad Pro: 퀀트 시장 운영 체제 70% 할인 평생 이용권 (한정 시간) - 2,000명 이상의 트레이더와 함께하세요 왜 대부분의 트레이더는 "완벽한" 지표를 가지고도 실패할까요? 진공 상태에서 단일 개념 만으로 거래하기 때문입니다. 문맥 없는 신호는 도박입니다. 지속적인 승리를 위해서는 컨플루언스(중첩) 가 필요합니다. RelicusRoad Pro는 단순한 화살표 지표가 아닙니다. 완전한 퀀트 시장 생태계 입니다. 독점적인 변동성 모델링을 사용하여 가격이 이동하는 "공정 가치 로드"를 매핑하고, 단순 노이즈와 실제 구조적 돌파를 구분합니다. 추측은 그만두세요. 기관급 로드 로직으로 거래를 시작하세요. 핵심 엔진: "Road" 알고리즘 시스템의 중심에는 시장 상황에 실시간으로 적응하는 동적 변동성 채널인 Road Algo 가 있습니다. 세이프 라인(평형) 과 가격이 수학적으로 반전될 가능성이 높은 확장 레벨 을 투영합니다. Simple Road: 일반적인 시장을 위
                      Quantum TrendPulse
                      Bogdan Ion Puscasu
                      5 (22)
                      SuperTrend   ,   RSI   ,   Stochastic   의 힘을 하나의 포괄적인 지표로 결합하여 트레이딩 잠재력을 극대화하는 궁극의 트레이딩 도구   인 Quantum TrendPulse를   소개합니다. 정밀성과 효율성을 추구하는 트레이더를 위해 설계된 이 지표는 시장 추세, 모멘텀 변화, 최적의 진입 및 종료 지점을 자신 있게 식별하는 데 도움이 됩니다. 주요 특징: SuperTrend 통합:   주요 시장 추세를 쉽게 따라가고 수익성의 물결을 타세요. RSI 정밀도:   매수 과다 및 매도 과다 수준을 감지하여 시장 반전 시점을 파악하는 데 적합하며 SuperTrend 필터로 사용 가능 확률적 정확도:   변동성이 큰 시장에서 숨겨진 기회를 찾기 위해 확률적 진동   을 활용하고 SuperTrend의 필터로 사용 다중 시간대 분석:   M5부터 H1 또는 H4까지 다양한 시간대에 걸쳐 시장을 최신 상태로 유지하세요. 맞춤형 알림:   맞춤형 거래 조건이 충족되면
                      Trend Lines PRO MT5
                      Roman Podpora
                      5 (1)
                      트렌드 라인즈 프로       이 지표는 시장이 실제로 어떤 방향으로 전환되는지 파악하는 데 도움이 됩니다. 실제 추세 반전 지점과 주요 시장 참여자들이 다시 진입하는 지점을 보여줍니다. 보시다시피       BOS 라인       복잡한 설정이나 불필요한 노이즈 없이 더 높은 시간대의 추세 변화와 주요 레벨을 확인할 수 있습니다. 신호는 차트에 다시 그려지지 않고 캔들이 마감된 후에도 계속 표시됩니다. MT4 버전   -   RFI LEVELS PRO   표시기   와 결합 시 최대 잠재력을 발휘합니다. 지표가 보여주는 내용: 실제 변화       추세(BOS 라인) 한 번 신호가 나타나면 그 신호는 계속 유효합니다! 이는 신호를 발생시킨 후 변경될 수 있는 리페인팅 방식의 지표와 중요한 차이점입니다. 리페인팅 방식의 지표는 잠재적으로 자금 손실로 이어질 수 있습니다. 이제 더욱 높은 확률과 정확도로 시장에 진입할 수 있습니다. 또한 화살표가 나타난 후 목표가(익절)에 도달하거나
                      Candle Smart Range
                      Gianny Alexander Lugo Sanchez
                      5 (1)
                      MetaTrader 5용 Candle Smart Range (CSR) Candle Smart Range는 여러 타임프레임에서 가격 범위를 자동으로 식별하도록 설계된 기술 지표입니다. 이 도구는 캔들 형성 및 이전 고점/저점과의 상호작용을 바탕으로 시장 구조를 분석합니다. 주요 기능: 범위 감지: 급격한 변동 전의 횡보 구간을 자동으로 식별합니다. 거짓 돌파 식별: 가격이 이전 수준을 넘어섰으나 캔들 종가 기준으로 범위 내에서 마감된 경우를 표시합니다. 멀티 타임프레임 분석: 사용자 정의 주기를 포함하여 최대 19개의 타임프레임 데이터를 한 차트에 표시합니다. 내부 시각화 (줌): 차트 변경 없이 상위 타임프레임 캔들 내부의 가격 움직임을 확인할 수 있습니다. 시간 필터: 주요 시장 세션 등 특정 시간대에만 작동하도록 설정 가능합니다. 과거 데이터 복기 모드: 과거 데이터를 단계별로 탐색하며 지표의 작동을 분석할 수 있습니다. 알림 시스템: 캔들 마감 및 새로운 범위 감지에 대한 사용
                      Gold Sniper Scalper Pro
                      Ich Khiem Nguyen
                      3.78 (9)
                      Gold Sniper Scalper Pro는 XAUUSD에서 허위 돌파 (false breakout) 패턴을 감지하기 위해 특별히 설계된 MetaTrader 5 지표입니다. 가격이 레인지 경계를 돌파하여 돌파 트레이더를 유인한 후 반전하는 4봉 트랩 구조를 식별합니다. 지표는 각 셋업을 17개 품질 요소로 평가하고, 4계층 합류 파이프라인을 통해 처리하며, 7타임프레임 추세 합의 엔진으로 검증하고, 금 변동성 상태 분류기로 필터링합니다. 이 모든 과정이 신호가 차트에 표시되기 전에 완료됩니다. 자세한 사용자 가이드는 작성자의   MQL5 블로그 에서 확인할 수 있습니다. 추가 업데이트는 작성자의   MQL5 채널 을 통해 제공됩니다. 현재 지원 정책에 따라 구매자는 저자가 개발한 선별된 보조 도구에 대한 추가 접근 권한을 받을 수 있습니다. Forex 쌍, 지수 및 암호화폐에서도 작동하지만, 감지 매개변수, 변동성 처리 및 필터 로직은 XAUUSD 특성에 최적화되어 있습니다.
                      PZ Swing Trading MT5
                      PZ TRADING SLU
                      5 (5)
                      Protect against whipsaws: revolutionize your swing trading approach Swing Trading is the first indicator designed to detect swings in the direction of the trend and possible reversal swings. It uses the baseline swing trading approach, widely described in trading literature. The indicator studies several price and time vectors to track the aggregate trend direction and detects situations in which the market is oversold or overbought and ready to correct. [ Installation Guide | Update Guide | Tro
                      Pips Stalker mt5
                      Abdulkarim Karazon
                      5 (1)
                      핍스 스토커는 롱 숏 화살표 유형의 지표로, 모든 수준의 트레이더들이 더 나은 시장 결정을 내릴 수 있도록 돕습니다. 이 지표는 절대 재도색되지 않고 RSI를 주요 신호 로직으로 사용합니다. 화살표가 주어지면 절대 다시 도색되거나 다시 도색되지 않고, 화살표 지연도 없습니다. MT4 버전 <---- PIPS STALKER ARROW 기능 : 통계 패널 전체 승률 %와 연속 최대 승리 및 패배 거래 등 유용한 통계, 기타 유용한 정보를 보여주는 독특한 정보 대시보드입니다. TP와 SL, 내장된 자금 관리 이 지표는 각 화살표마다 TP와 SL 객체를 제공하므로, 거래자는 자금 및 위험 관리를 내장하고 있으며, SL은 ATR을 기반으로 하며, TP는 현재 ATR SL 가치를 기반으로 한 위험 대비 보상 비율을 기반으로 합니다. 재도색 없음, 높은 조정 가능성 이 인디케이터는 신호 품질 개선을 위한 다양한 옵션을 제공하여 어떤 쌍에서도 약간의 기간 조정만으로 작동하며, 패널은
                      소개       Quantum Breakout PRO   , 브레이크아웃 존 거래 방식을 변화시키는 획기적인 MQL5 지표! 13년 이상의 거래 경험을 가진 숙련된 트레이더 팀이 개발한       퀀텀 브레이크아웃 PRO       혁신적이고 역동적인 브레이크아웃 존 전략으로 거래 여정을 새로운 차원으로 끌어올리도록 설계되었습니다. Quantum Breakout Indicator는 5개의 이익 목표 영역이 있는 브레이크아웃 영역의 신호 화살표와 브레이크아웃 상자를 기반으로 한 손절 제안을 제공합니다. 초보자 거래자와 전문 거래자 모두에게 적합합니다. Quantum EA 채널:       여기를 클릭하세요 중요한! 구매 후 설치 매뉴얼을 받으려면 개인 메시지를 보내주십시오. 추천: 기간: M15 통화쌍: GBPJPY, EURJPY, USDJPY,NZDUSD, XAUUSD 계정 유형: 스프레드가 매우 낮은 ECN, Raw 또는 Razor 브로커 시간: GMT +3 중개인 :
                      Btmm state engine pro
                      Garry James Goodchild
                      5 (2)
                      Get the user guide here  https://g-labs.software/guides/BTMM_State_Engine_Welcome_Pack.html BTMM State Engine Pro — the   all-in-one Banks   & Institutions Market Maker indicator for Meta Trader 5. Built for   BTMM traders who follow the Asian   session breakout methodology with Kill Zone timing , level stacking, peak formation detection , and multi-pair scanning — all   from a single chart. Combines   a full BTMM State Engine   with a built-in multi-pair Scanner dashboard, eliminating the need
                      Easy SMC Trading
                      Israr Hussain Shah
                      4 (1)
                      자동 위험 관리 및 구조 돌파 스캐너를 포함한 구조 추세 분석 버전: 1.0 개요 자동 위험 관리 기능을 갖춘 구조 추세 분석은 가격 움직임과 시장 구조에 의존하는 트레이더를 위해 설계된 종합적인 트레이딩 시스템입니다. 부드러운 추세 필터와 스윙 포인트 감지, 구조 돌파(BOS) 신호를 결합하여 높은 확률의 거래 설정을 생성합니다. 이 도구의 가장 두드러진 특징은 자동 위험 관리 기능입니다. 유효한 구조 돌파가 감지되면 지표는 즉시 위험/보상 영역(1:1, 1:2, 1:3)을 계산하고 표시하며, 가격이 목표에 도달할 때 거래 시각화를 자동으로 관리합니다. 수동으로 차트를 그릴 필요가 없어 트레이더는 실행에만 집중할 수 있습니다. 주요 기능 동적 구조 돌파(BOS) 감지 스윙 고점(HH/LH)과 스윙 저점(HL/LL)을 자동으로 식별합니다. 가격이 주요 구조적 레벨을 돌파할 때 차트에 BOS 라인을 직접 표시하여 추세 방향을 확인합니다. 구조적 핵심 지점을 명확한 텍스트
                      Trade smarter, not harder: Empower your trading with Harmonacci Patterns This is arguably the most complete harmonic price formation auto-recognition indicator you can find for the MetaTrader Platform. It detects 19 different patterns, takes fibonacci projections as seriously as you do, displays the Potential Reversal Zone (PRZ) and finds suitable stop-loss and take-profit levels. [ Installation Guide | Update Guide | Troubleshooting | FAQ | All Products ] It detects 19 different harmonic pri
                      " Dynamic Scalper System MT5 " 지표는 추세 파동 내에서 스캘핑 방식으로 거래하도록 설계되었습니다. 주요 통화쌍 및 금에서 테스트되었으며, 다른 거래 상품과의 호환성이 가능합니다. 추가적인 가격 변동 지원을 통해 추세에 따라 단기 포지션 진입 신호를 제공합니다. 지표의 원리 큰 화살표는 추세 방향을 결정합니다. 작은 화살표 형태의 스캘핑 신호를 생성하는 알고리즘은 추세 파동 내에서 작동합니다. 빨간색 화살표는 상승 방향을, 파란색 화살표는 하락 방향을 나타냅니다. 민감한 가격 변동선은 추세 방향으로 그려지며, 작은 화살표의 신호와 함께 작용합니다. 신호는 다음과 같이 작동합니다. 적절한 시점에 선이 나타나면 진입 신호가 형성되고, 선이 있는 동안 미결제 포지션을 유지하며, 완료되면 거래를 종료합니다. 권장되는 작업 시간대는 M1~H4입니다. 화살표는 현재 캔들에 형성되며, 다음 캔들이 이미 시작되었더라도 이전 캔들의 화살표는 다시 그려지지 않습니다. 입
                      Meta Cipher B
                      SILICON HALLWAY PTY LTD
                      Meta Cipher B: MT5용 올인원 오실레이터 스위트 Meta Cipher B 는 인기 있는 Market Cipher B 개념을 MetaTrader 5에 도입하여 속도와 정밀도를 극대화했습니다. 처음부터 성능 중심으로 설계되어 전문가 수준의 신호 를 지연이나 느린 스크롤 없이 제공합니다. 단독으로도 강력하지만, Meta Cipher A 와 자연스럽게 함께 작동하도록 설계되어 완전한 시장 분석과 더 깊은 확인 기능을 제공합니다. 주요 기능 통합된 오실레이터 스택이 파동 모멘텀, VWAP, 자금 흐름, RSI, 스토캐스틱 을 시각화합니다. 조건이 일치하면 명확한 매수 및 매도 점이 표시됩니다. 짧은 시간 프레임에서는 진입 타이밍 조정에, 긴 시간 프레임에서는 시장 구조 분석에 활용할 수 있습니다. 고정밀 신호를 위한 설계 커브 매칭 기법 으로 정밀하게 보정하여 일반적인 시장 상황에서도 원래의 동작을 충실히 재현합니다. 하위 신호들은 부드럽게 동기화되어 파동과 점이 숙련된 트레
                      Entry Points Pro for MT5
                      Yury Orlov
                      4.48 (138)
                      다시 색을 칠하지 않고 거래에 진입할 수 있는 정확한 신호를 제공하는 MT5용 지표입니다. 외환, 암호화폐, 금속, 주식, 지수 등 모든 금융 자산에 적용할 수 있습니다. 매우 정확한 추정값을 제공하고 매수와 매도의 가장 좋은 시점을 알려줍니다. 하나의 시그널로 수익을 내는 지표의 예와 함께 비디오 (6:22)시청하십시오! 대부분의 거래자는 Entry Points Pro 지표의 도움으로 첫 거래 주 동안 트레이딩 결과를 개선합니다. 저희의   Telegram Group 을 구독하세요! Entry Points Pro 지표의 좋은점. 재도색이 없는 진입 신호 신호가 나타나고 확인되면(시그널 캔들이 완성된 경우) 신호는 더 이상 사라지지 않습니다. 여타 보조지표의 경우 신호를 표시한 다음 제거되기 때문에 큰 재정적 손실로 이어집니다. 오류 없는 거래 게시 알고리즘을 통해 트레이드(진입 또는 청산)를 할 이상적인 순간을 찾을 수 있으며, 이를 통해 이를 사용하는 모든 거래자의 성공률이
                      Ace Trend
                      Mikhail Sergeev
                      5 (3)
                      우리는 당신에게 트렌드 거래의 세계에서 게임의 규칙을 변경하는 혁신적인 지표를 제시한다. 이 표시기는 성능을 재고하고 거래 경험을 전례없는 높이로 높이도록 설계되었습니다. 우리의 표시기는 경쟁 업체와 차별화 된 고급 기능의 고유 한 조합을 자랑합니다. "실제 가격 요인"의 첨단 기술은 가장 어렵고 휘발성 시장 상황에서도 탁월한 안정성을 보장합니다. 불안정한 패턴,깨진 지표 및 의식적이고 통제 된 거래에 작별 인사를하십시오. 표시기는 단지 아름다운 그림이 아닙니다! 지표는 거래자의 편으로 확률을 이동시켜 이익을 얻어야 합니다. 표시 신호(완전 자동 모드)에 따라 거래 결과에 익숙해: https://www.mql5.com/ko/signals/2339244 표시기는 형성된 막대에 다시 그리지 않습니다. 막대가 형성된 경우 표시기 판독 값은 변경되지 않습니다. 이 표시기는 모든 시간대에 작동합니다. 표준은 시간대입니다. 귀하의 의견은 매우 중요합니다! 당신은 어떤 질문,제안이,또는 당신의
                      제작자의 제품 더 보기
                      Quantitative Trading Analysis
                      Abdeljalil El Kedmiri
                      5 (1)
                      당신의 트레이딩을 ‘감’이 아닌 ‘데이터 기반 의사결정’으로 전환하세요. 이제 전문 금융기관이 사용하는 정량 분석의 힘을 모든 진지한 트레이더가 이용할 수 있습니다. “트레이딩에서 측정할 수 있는 것만이 개선될 수 있습니다. 중요한 것을 측정하기 시작하세요.” 이 도구는 저작권으로 보호된 완전한 정량 분석 툴킷으로, 시장 행동, 변동성, 유동성, 그리고 거래 기회를 깊이 이해하고자 하는 트레이더를 위해 설계되었습니다. 이 Excel 스프레드시트(VBA 자동화 포함)는 MT5(또는 모든 OHLCV 데이터 소스)와 완벽하게 연동되며, 몇 번의 클릭만으로 원시 데이터를 실행 가능한 트레이딩 인사이트로 변환합니다. 이 툴킷은 투자은행이 신입 애널리스트에게 가르치는 정량적 접근 방식을 구현한 것입니다. 이는 전문 트레이딩 교육의 첫 단계로, 추측이 아닌 데이터를 통해 시장 행동과 리스크를 이해하도록 돕습니다. 모든 향후 업데이트가 포함되어 있으며, 한 번의 구매로 최대 10대의 컴퓨터 또는
                      Pro Trading Analytics
                      Abdeljalil El Kedmiri
                      5 (3)
                      “출시 가격: $55 (2개 한정!). 다음 가격: $75. 최종 가격: $149.” 제품을 구매하셨다면 이메일 주소를 보내주세요. Excel ProTrading Analytics 템플릿 를 무료로 보내드립니다. 이 올인원 솔루션으로 트레이딩 전략의 전체 가능성을 열어보세요: 거래 내역 내보내기 + 전문가용 Excel 대시보드 . 수동 트레이드든 EA(trading robot)이든, 이 강력한 도구는 전문가 수준의 지표와 대시보드를 사용해 성과를 분석하고 최적화할 수 있게 해줍니다. Pro Excel Dashboard는 수동 또는 알고리즘 거래 내역을 깊이 있게 분석하며, 백테스트 결과를 사용해 EA의 퍼포먼스도 평가할 수 있습니다. 주요 지표를 기반으로 한 성과 평가와 상세 인사이트를 즉시 제공합니다. 또한 전체적인 트레이딩 일관성을 평가할 수 있습니다 — 이는 Prop Firm 챌린지 통과 및 자금 계정 유지에 매우 중요합니다. 포함 항목: Trade History Export
                      EAs Manager MT4
                      Abdeljalil El Kedmiri
                      The  MT4  EAs Manager   is a professional risk management and trade assistance tool designed to monitor, control, and optimize all trading activities on your MT5 account. It acts as a   central command center   that oversees every trade - whether opened by other Expert Advisors or manually by you. How it's work with other EAs :   Blog post  MT5 version :  https://www.mql5.com/en/market/product/166211 Only 10 copies will be sold at the early-bird price. After 10 copies, the price jumps directly t
                      Dynamic Fibo Scalper
                      Abdeljalil El Kedmiri
                      Dynamic Fibo Scalper is an automated trading tool that uses Dynamic Fibonacci levels to find trading opportunities. You can set up to 5 custom levels in the EA’s inputs, and it will monitor the price movement. When the price crosses any of your chosen levels, the EA will automatically enter a buy or sell trade. This EA is perfect for traders who want a simple and effective strategy based on Fibonacci analysis. It’s fully customizable , easy to use, and works on any market , giving you more con
                      EAs Manager
                      Abdeljalil El Kedmiri
                      5 (1)
                      The   Ultimate EAs Manager   is a professional risk management and trade assistance tool designed to monitor, control, and optimize all trading activities on your MT5 account. It acts as a   central command center   that oversees every trade - whether opened by other Expert Advisors or manually by you. How it's work with other EAs : Blog post  MT4 version:  https://www.mql5.com/en/market/product/167007 Only 10 copies will be sold at the early-bird price. After 10 copies, the price jumps directly
                      Trade Visualizer
                      Abdeljalil El Kedmiri
                      While developing an MT4 EA designed to manage multiple EAs and manual trades simultaneously, I encountered a fundamental limitation in MetaTrader 4's trade visualization, the platform offers no built-in way to view trade history directly on the chart. Every time I needed to verify if my management EA was working correctly, I found myself manually dragging individual trades from the Account History tab onto the chart, a tedious and inefficient process that made debugging and monitoring nearly imp
                      Trading Keyboard
                      Abdeljalil El Kedmiri
                      Trading Keyboard (FastTrade Hotkeys) EA is an advanced tool designed for traders who want to execute trades quickly and efficiently using their keyboard. It allows users to place, modify, and close orders with customizable hotkeys, making trading as fast and intuitive as possible. Whether you're a scalper, day trader, or swing trader, this EA enhances your trading experience by reducing manual clicks and improving reaction time. Key Features: Hotkey-Based Trading – Execute trades, modify posit
                      Quant Levels
                      Abdeljalil El Kedmiri
                      5 (1)
                      Quant Levels Indicator   is a premium component of the   Quantitative Trading Analysis Toolkit , designed to transform subjective trading into data-driven decision making. This advanced tool provides institutional-grade support and resistance analysis directly on your MT5 charts. " Please support our work by leaving a review ". As a thank-you gift , we’ll share a special template that helps you display signal trade history directly on your chart. Free indicator to visualize any MT5/MT4 signals i
                      FREE
                      Send Orders At Time
                      Abdeljalil El Kedmiri
                      5 (1)
                      This new time-based strategy   enable you to schedule precise buy/sell orders at any predefined time , allowing you to execute trades based on timing rather than technical analysis.  The system automatically can determines the order type (buy or sell) based on technical confirmations provided by RSI and moving averages. You have the freedom to adjust and customize all parameters related to Buy and Sell criteria, as well as enable or disable technical filters . Link to MT4 version :  https://www.
                      FREE
                      TradeVisualizer
                      Abdeljalil El Kedmiri
                      Trade Visualizer 지표는 거래 데이터를 시각화하여 MT5 차트에 전체 거래 내역을 직접 표시합니다. 자신의 성과를 분석하거나 MQL5 시그널 트레이더를 연구할 때, 이 도구는 원시 데이터를 직관적인 시각 자료로 변환합니다. 각 거래는 진입/청산 화살표, 연결선, 가격·수익·거래량·핍 수치 등의 정보로 표시됩니다. 참고: 인디케이터를 다운로드하셨다면 이메일 주소와 함께 메시지를 보내주시면 Trade Visualizer Template 무료 사본을 보내드립니다. 특징: • 최신 ProTrading Analytics Excel Template v1.7 과 완벽히 통합. • 여러 트레이더/전략을 동일 심볼에서 비교 가능. • 매수·매도 색상, 선 스타일, 화살표 크기 완전 사용자 정의. • GMT 기준 자동 시간대 조정. • 다양한 브로커 심볼 접미사 지원. • 전략 논리, 진입/청산 타이밍 분석에 이상적.
                      FREE
                      Grid Strategy
                      Abdeljalil El Kedmiri
                      Exclusive deal: 70% discount for a limited period. Super Grid Strategy EA   is a versatile and powerful grid trading tool, perfect for both Forex and CFD traders. It places up to 20 pending orders (10 stop and 10 limit) at your preferred time, with customizable distances and spacing between orders for maximum flexibility. Key features include: Fixed Grid :  Orders are placed at a fixed distance from the price and between each order, and this parameter can be adjusted based on market conditions.
                      Send Orders At Time MT4
                      Abdeljalil El Kedmiri
                      This new   time-based strategy   enable you to schedule precise buy/sell orders at any predefined time , allowing you to execute trades based on timing rather than technical analysis.  The system automatically can determines the order type (buy or sell) based on technical confirmations provided by RSI and moving averages. You have the freedom to adjust and customize all parameters related to Buy and Sell criteria, as well as enable or disable technical filters . Link to MT5 version :  https://ww
                      FREE
                      Range Breakout MT4
                      Abdeljalil El Kedmiri
                      5 (3)
                      The Range Breakout X2 is following a scalping breakout strategy. This expert will identify the daily 4 key levels of support and resistance and will open Long and short trades on these levels.Profits can be secured with the adjustable trailing stop... Note : Please be advised that due to the current market conditions (volatile market), we recommend activating the second levels (15H) and deactivating the first levels (11H). This is an optimized range breakout strategy with a simple and full cust
                      Strategy Master MT4
                      Abdeljalil El Kedmiri
                      Strategy Master   is a 5-in-1 EA, offering a choice of 5 distinct strategies within a single expert advisor. You can activate one to five strategies simultaneously and customize your trading by enabling or disabling filters to validate entries. These five strategies encompass a range of approaches, including three technical strategies (Moving Average, Bollinger Bands, and Ichimoku), a renowned price action strategy (Breakout), and a time-based strategy (SendOrder at Time). We understand that mar
                      Trendline Breakouts MT4
                      Abdeljalil El Kedmiri
                      Trendline Breakouts   is a semi-automatic expert advisor, which means you only need to draw the support and resistance lines, and then let the expert advisor handle the trading for you. You can use this expert for every market and time frame. Backtesting is not available because this is a semi-automatic EA. You draw the trendlines and let the expert trade for you. This expert enables you to automatically trade breakouts of both horizontal support and resistance and trendlines, unlike the traditi
                      Quick Funding in Prop Trading Firms
                      Abdeljalil El Kedmiri
                      4.85 (27)
                      This EA is designed to pass challenges of prop firms (proprietary trading firm) that allow use of High and Low Frequency trading strategies. A Gift i ncluded in this expert    :   Range Breakout strategy  that identify daily support and resistance levels and initiating both Long and Short trades automaticly at these key points. We use special HFT strategy that detect large movements and employ stop loss to protect your equity. It has build-in equity protector which will stop the EA once the pro
                      Golden Candlesticks MT4
                      Abdeljalil El Kedmiri
                      Golden candlesticks are highly  profitable patterns that have been tested and selected from among dozens of patterns. This Expert Advisor is the result of nine years of in-depth study and practical experience in the financial markets. We analyzed the works of experts like Steve Nison, Stephen Bigalow , François Baron and Gregory Morris... focusing on candlestick pattern techniques. Free indicator to visualize any MT5/MT4 signals in your chart   :  https://www.mql5.com/en/market/product/152555 W
                      Hedge Manual Trades
                      Abdeljalil El Kedmiri
                      This Expert Advisor is designed to help traders manage their positions automatically. It can hedge manual trades when a specified (loss or win) threshold is reached, reducing risk. The EA also allows traders to close buy or sell trades individually based on profit or loss, and it can close all trades when a certain total profit or loss is achieved. With customizable settings for trade management, this EA helps traders automate their strategies and improve efficiency. The EA opens trades using th
                      Unlock the full potential of your trading strategy with this  all-in-one  solution:  Trade History Exporter  +  Pro Excel Trading Dashboard . Whether you're trading manually or using Expert Advisors (EAs), this powerful tool allows you to analyze, optimize, and improve your performance with professional-grade metrics and interactive dashboards. With the Pro Excel Dashboard, you can deeply analyze your trade history—manual or algorithmic—and even evaluate any EA’s performance using backtest resu
                      Master prop firm challenges before risking real money!   Our advanced simulator recreates authentic prop firm trading environments, helping you practice, strategize, and pass challenges with confidence.   Using our Simulator, you can simulate any prop firm challenge using demo or live accounts, supports both manual trading strategies and automated trading via EAs ,  create personalized challenges for customized periods, and challenge yourself to develop the discipline needed for consistent profi
                      Range Breakout X2
                      Abdeljalil El Kedmiri
                      4 (3)
                      The Range Breakout X2 is following a scalping breakout strategy. This expert will identify the daily 4 key levels of support and resistance and will open Long and short trades on these levels.Profits can be secured with the adjustable trailing stop... Note : Please be advised that due to the current market conditions (volatile market), we recommend activating the second levels (15H) and deactivating the first levels (11H). This is an optimized range breakout strategy with a simple and full cust
                      Trendline Breakouts
                      Abdeljalil El Kedmiri
                      5 (1)
                      Trendline Breakouts is a semi-automatic expert advisor, which means you only need to draw the support and resistance lines, and then let the expert advisor handle the trading for you. You can use this expert for every market and time frame. Backtesting is not available because this is a semi-automatic EA. You draw the trendlines and let the expert trade for you. This expert enables you to automatically trade breakouts of both horizontal support and resistance and trendlines, unlike the tradition
                      Strategy Master
                      Abdeljalil El Kedmiri
                      Strategy Master is a 5-in-1 EA, offering a choice of 5 distinct strategies within a single expert advisor. You can activate one to five strategies simultaneously and customize your trading by enabling or disabling filters to validate entries. These five strategies encompass a range of approaches, including three technical strategies (Moving Average, Bollinger Bands, and Ichimoku), a renowned price action strategy (Breakout), and a time-based strategy (SendOrder at Time). The link for MT4 version
                      Golden candlesticks
                      Abdeljalil El Kedmiri
                      Golden candlesticks are highly  profitable patterns that have been tested and selected from among dozens of patterns. This Expert Advisor is the result of nine years of in-depth study and practical experience in the financial markets. We analyzed the works of experts like   Steve Nison, Stephen   Bigalow   , François Baron and Gregory Morris... focusing on candlestick pattern techniques. Free indicator to visualize any MT5/MT4 signals in your chart   :  https://www.mql5.com/en/market/product/152
                      Super Grid Strategy
                      Abdeljalil El Kedmiri
                      Exclusive deal: 70% discount for a limited period. Super Grid Strategy EA is a versatile and powerful grid trading tool, perfect for both Forex and CFD traders. It places up to 20 pending orders (10 stop and 10 limit) at your preferred time, with customizable distances and spacing between orders for maximum flexibility. Key features include: Fixed Grid :  Orders are placed at a fixed distance from the price and between each order, and this parameter can be adjusted based on market conditions. D
                      Prop Firm Simulator
                      Abdeljalil El Kedmiri
                      실제 자금을 위험하기 전에 Prop Firm 도전을 숙달하세요!   당사의 고급 시뮬레이터는 진정한 Prop Firm 거래 환경을 재현하여 자신 있게 연습, 전략 수립 및 도전 통과를 돕습니다. 당사 시뮬레이터를 사용하면 데모 또는 실계좌를 사용하여 모든 Prop Firm 도전을 시뮬레이션하고, 수동 거래 전략과 EA를 통한 자동화 거래를 모두 지원하며, 맞춤형 기간에 대한 개인화된 도전을 생성하고 일관된 수익성에 필요한 훈율을 개발하기 위해 자신에게 도전할 수 있습니다. FTMO 10k 및 100K 도전 세트파일:   모든 주요 Prop Firm에 대한 세트파일 및 전용 지원 이용 가능 - 문의만 하세요! 선착순 10명 구매자에게 30% 할인. 주요 기능 실시간 도전 모니터링 실시간 통계 대시보드 - 잔고, 자본, P&L, 드로다운 실시간 추적 전문 지표 - 종결 P&L 대 미결 P&L, 승률, 거래 분석 수동/자동거래 지원: 수동 거래 전략 및 Expert Advisors를
                      The   Missed Opportunity Analyzer   is a professional historical analysis tool that identifies and visualizes high probability trading opportunities you   missed   in the past. Unlike predictive indicators, it provides 100% non-repainting hindsight analysis to help you study price behavior, refine your strategy, and improve your trading discipline. Core Concept The indicator scans historical data to find confirmed price swings where: Price moved to your target (TP)   before   hitting your sto
                      필터:
                      리뷰 없음
                      리뷰 답변