Btmm state engine pro
- 지표
- 버전: 1.64
- 업데이트됨: 10 6월 2026
- 활성화: 5
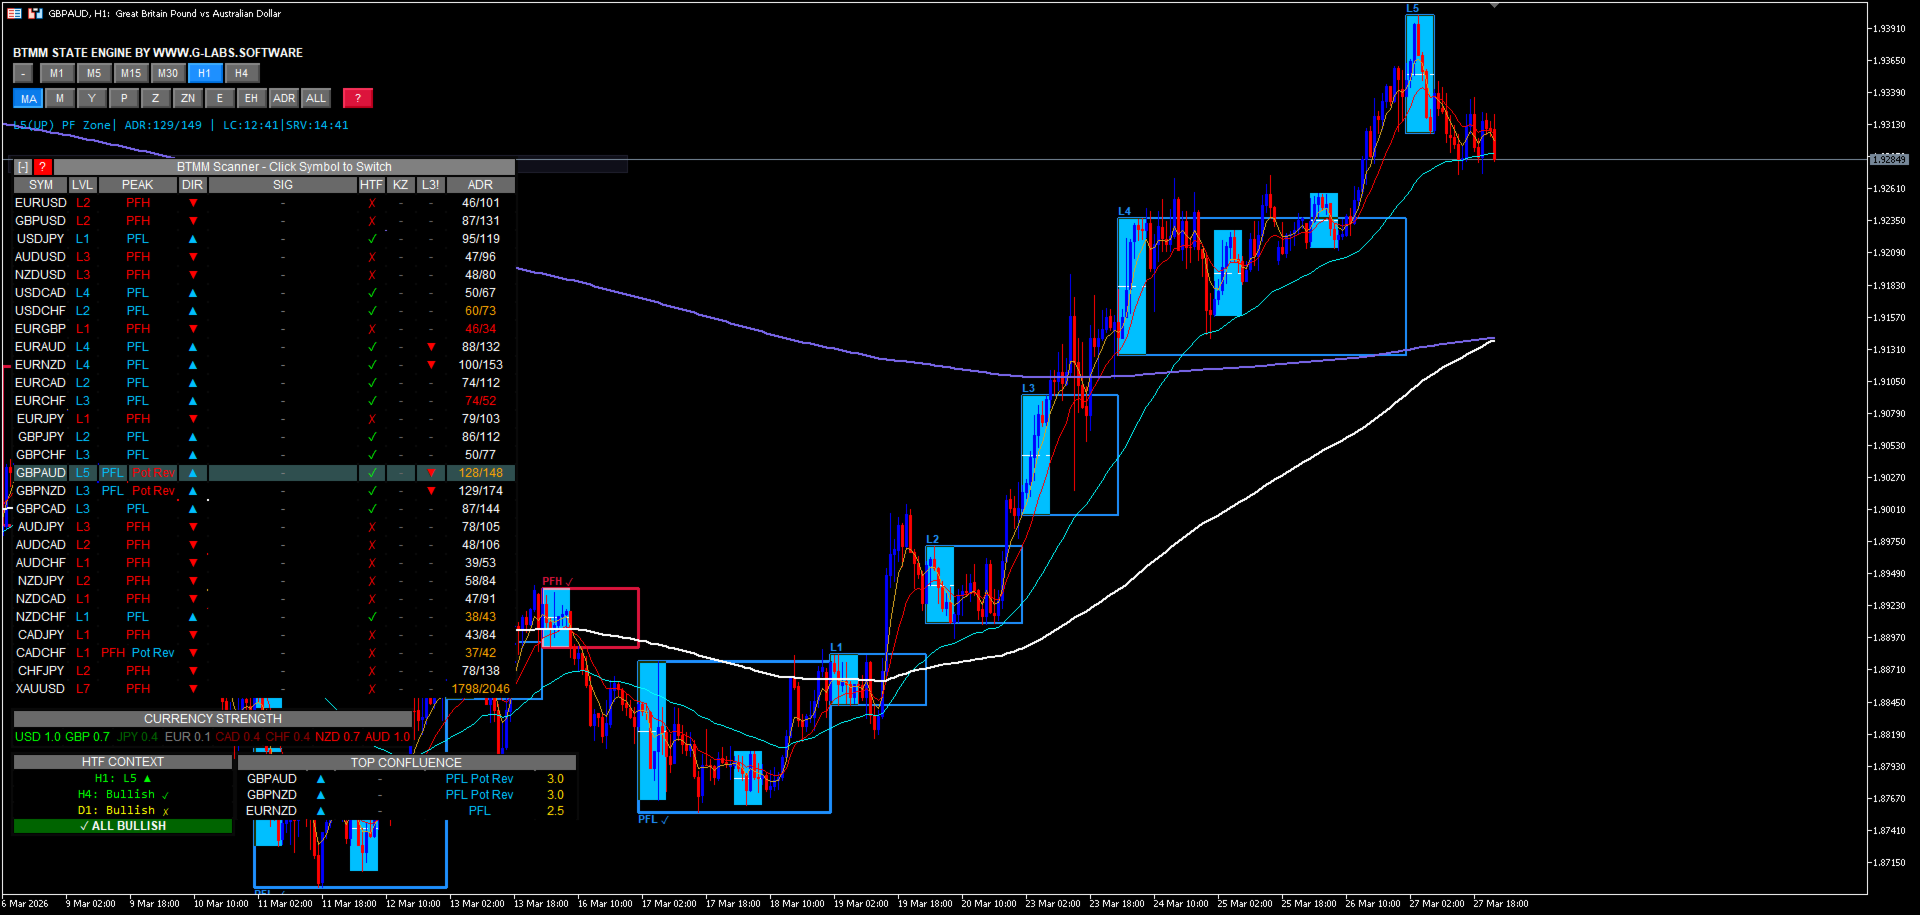
BTMM State Engine Pro is a MetaTrader 5 indicator for traders who use the Beat The Market Maker approach: Asian session context, kill zone timing, level progression, peak formation detection, and a multi-pair scanner from a single chart. It combines cycle state logic with a built-in scanner dashboard so you do not need the same tool on many charts at once.
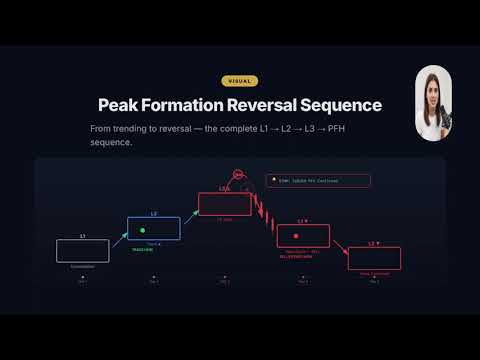
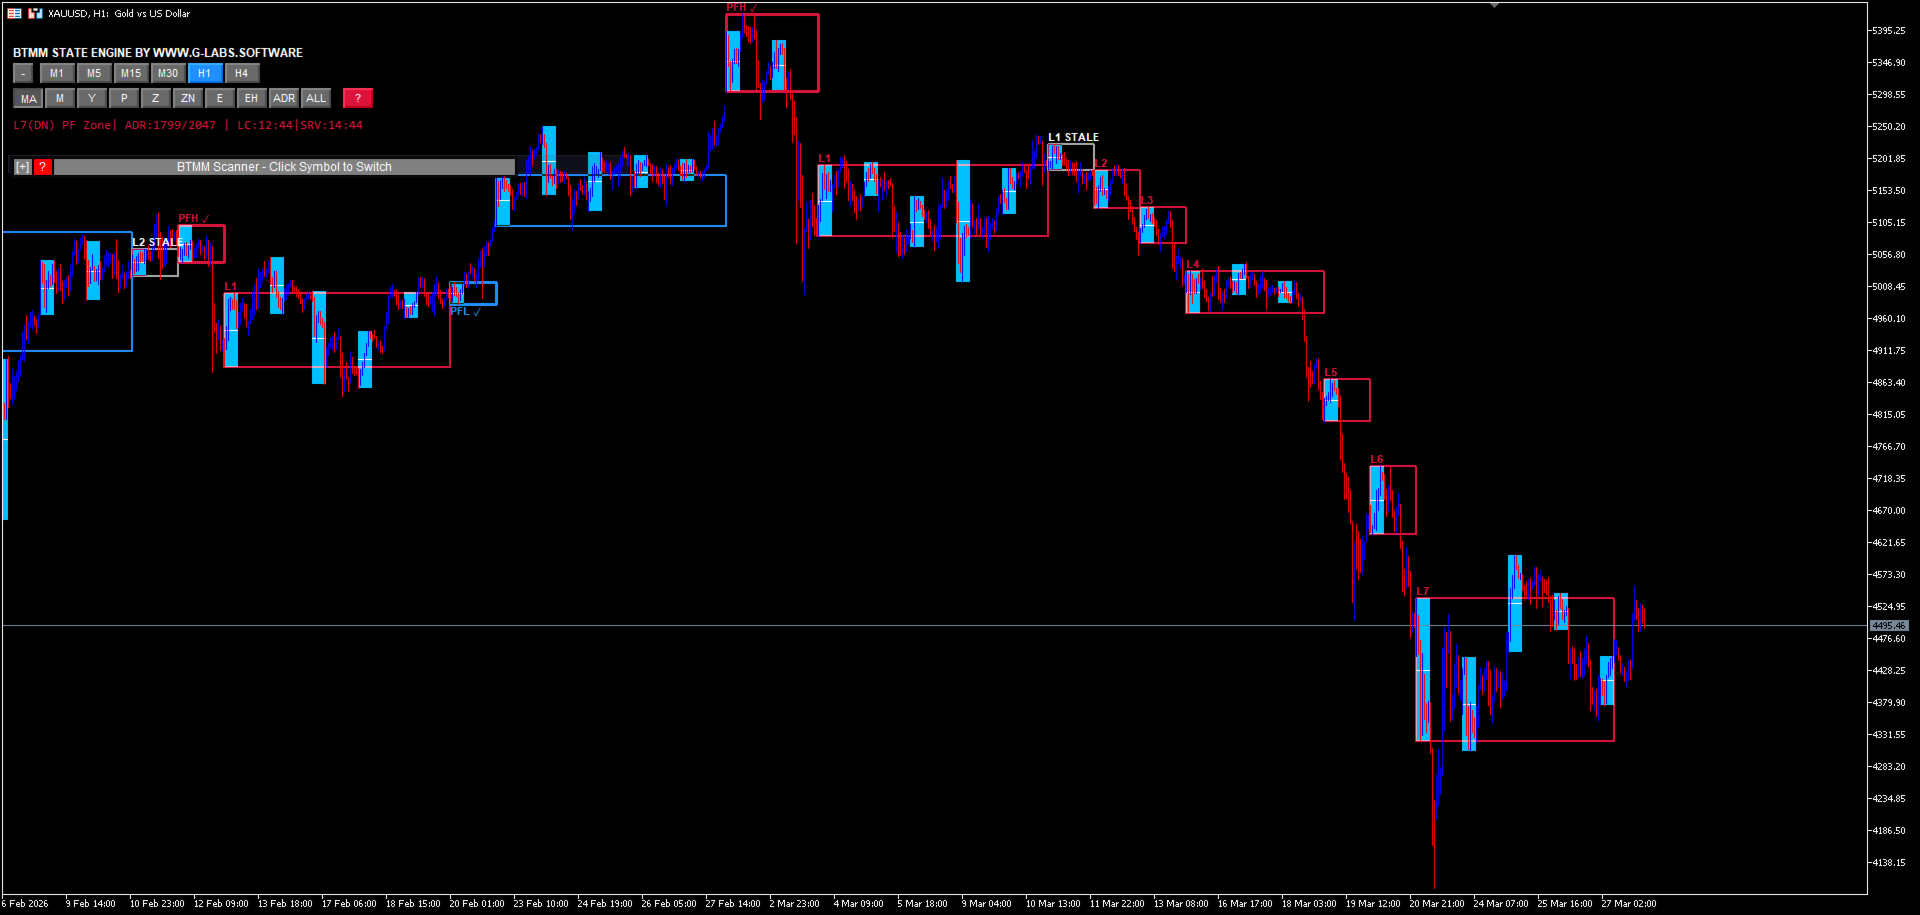
What it does
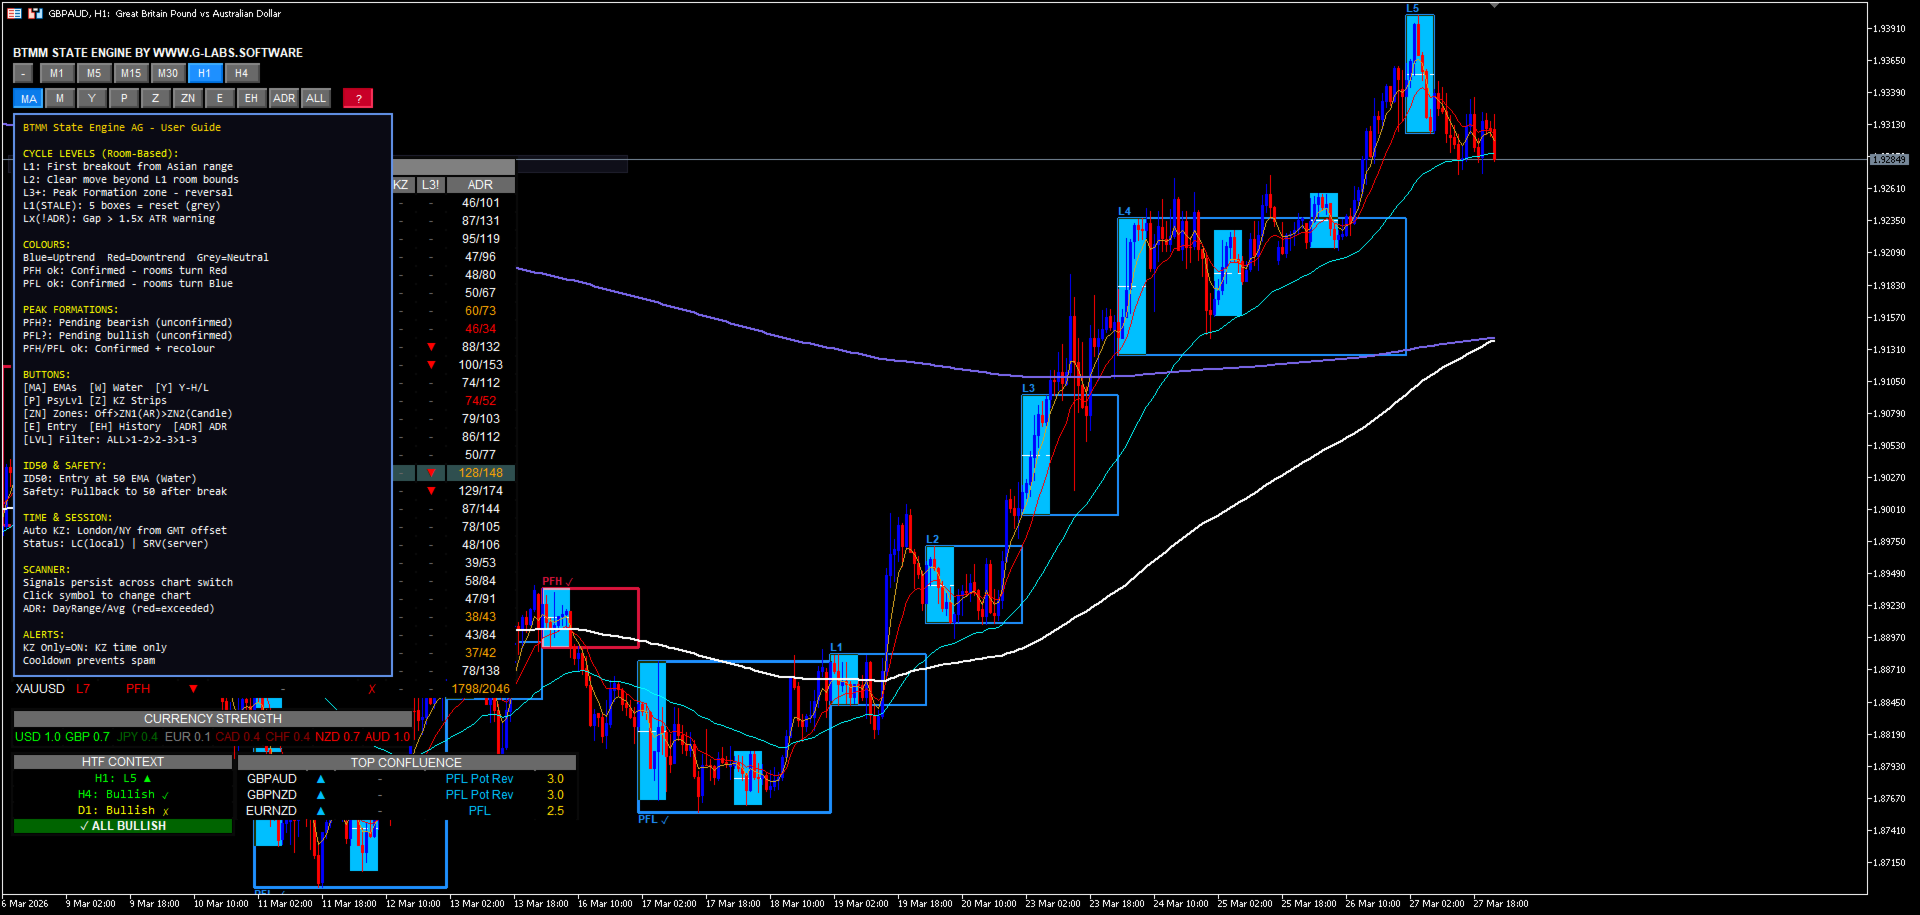
Draws the Asian session range; session times can follow broker server offset or be set in inputs. Tracks level progression (L1, L2, L3 and beyond) with on-chart level blocks. Detects peak formations (pending and confirmed) for potential reversals. Shows several entry-style setups (stop-hunt style, standard filtered crossovers, 50 EMA approaches, identity-style 50 EMA context, and pullback-to-50 EMA trades) according to inputs and filters. Monitors a configurable symbol list and shows a live dashboard with per-symbol state.
Entries and filters
Signals follow the methodology described in the materials included with the product. Filters may include momentum-style candle checks, Traders Dynamic Index confirmation, cycle direction, and kill zone timing. Behaviour depends on inputs and market data.
On-chart controls
Toolbar toggles control EMA layers, reference lines, psychological levels, kill zone shading, entry markers, entry history, average daily range display, level filter modes, and a help panel.
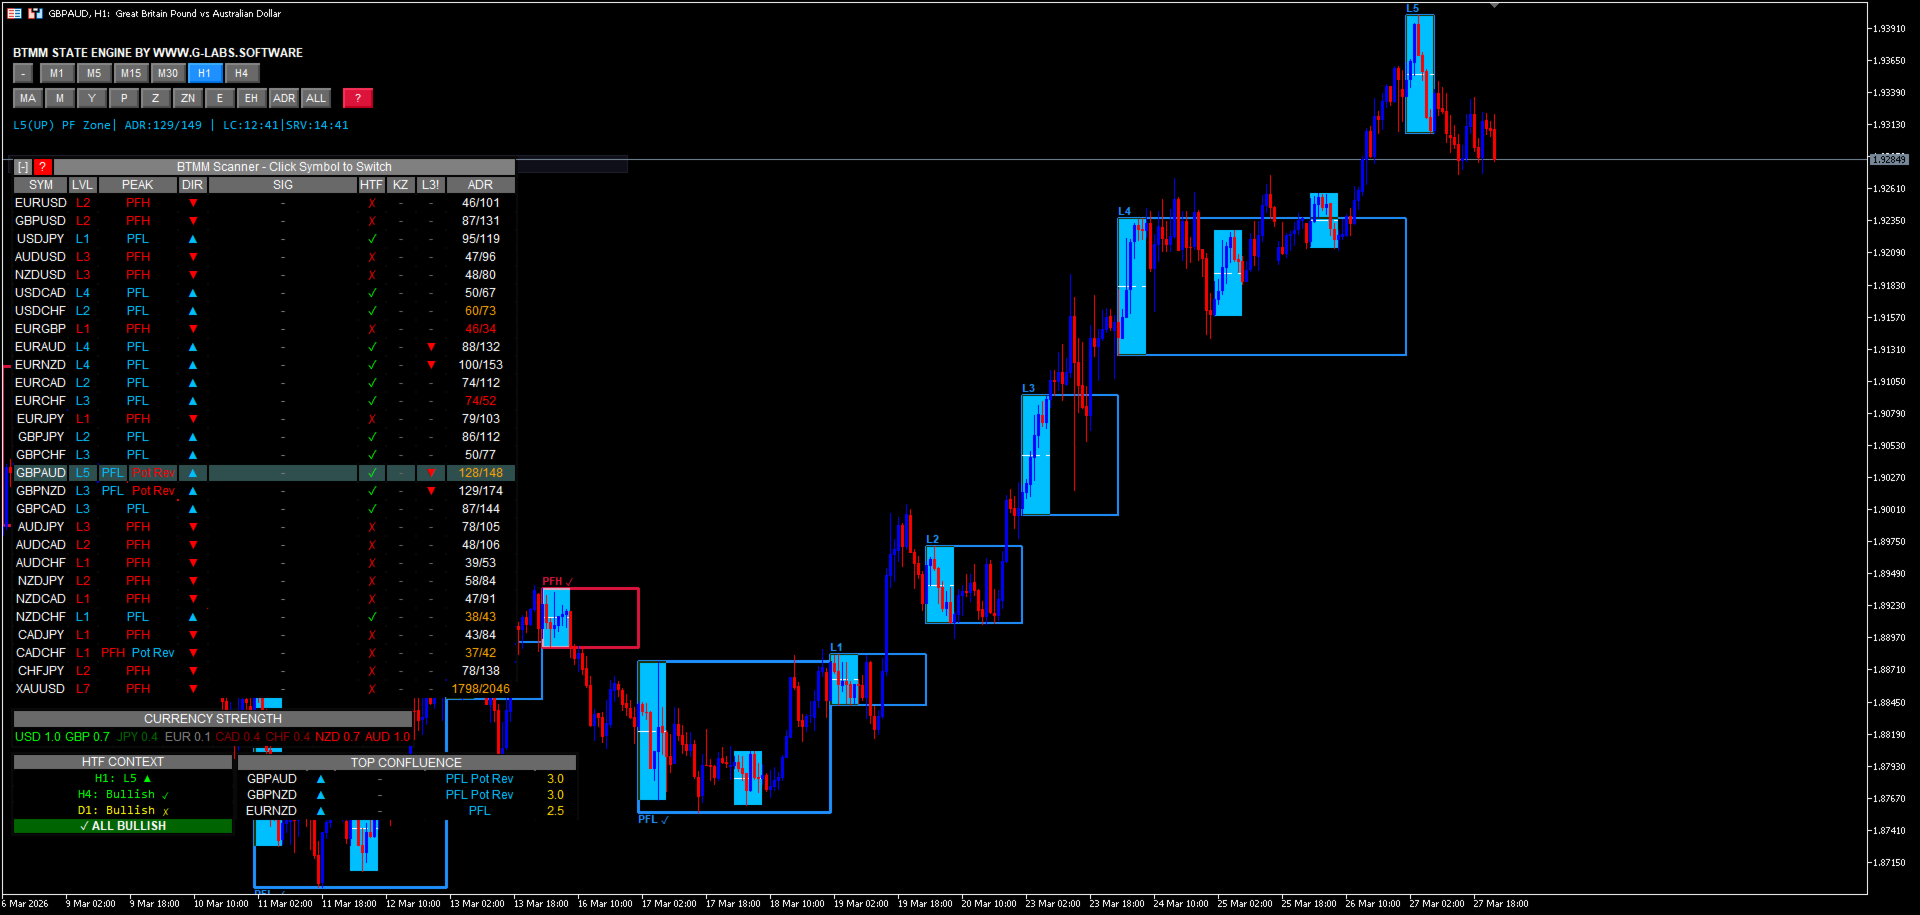
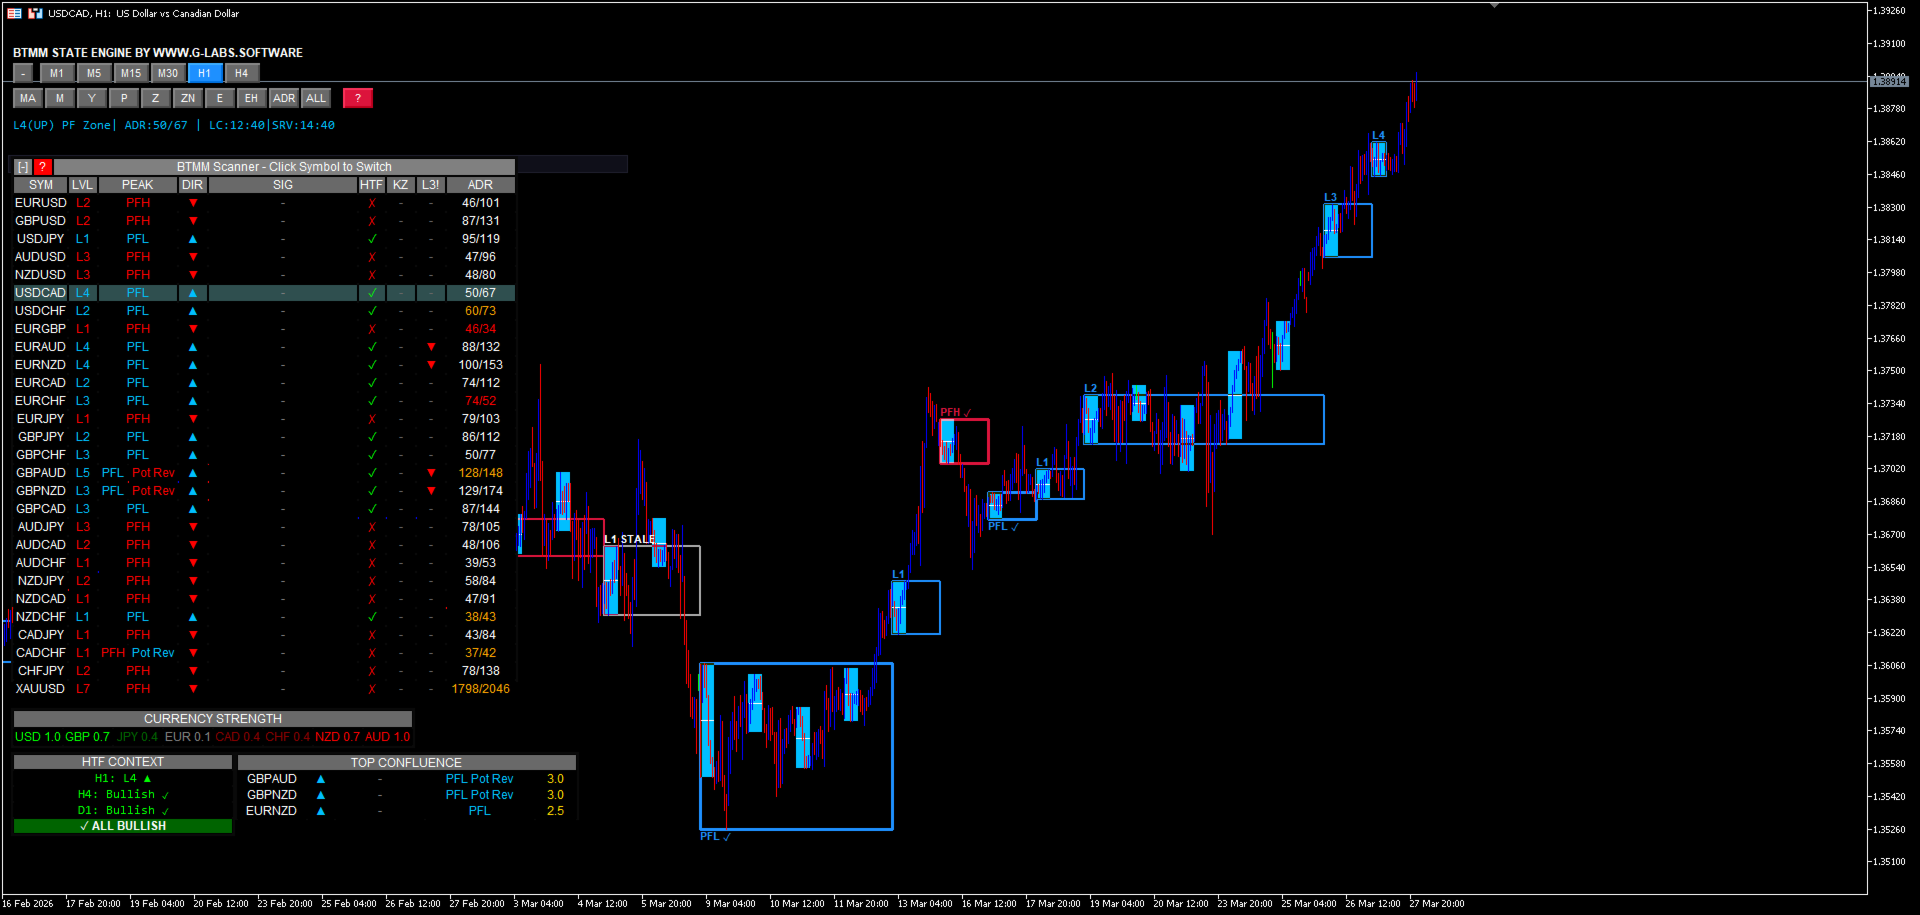
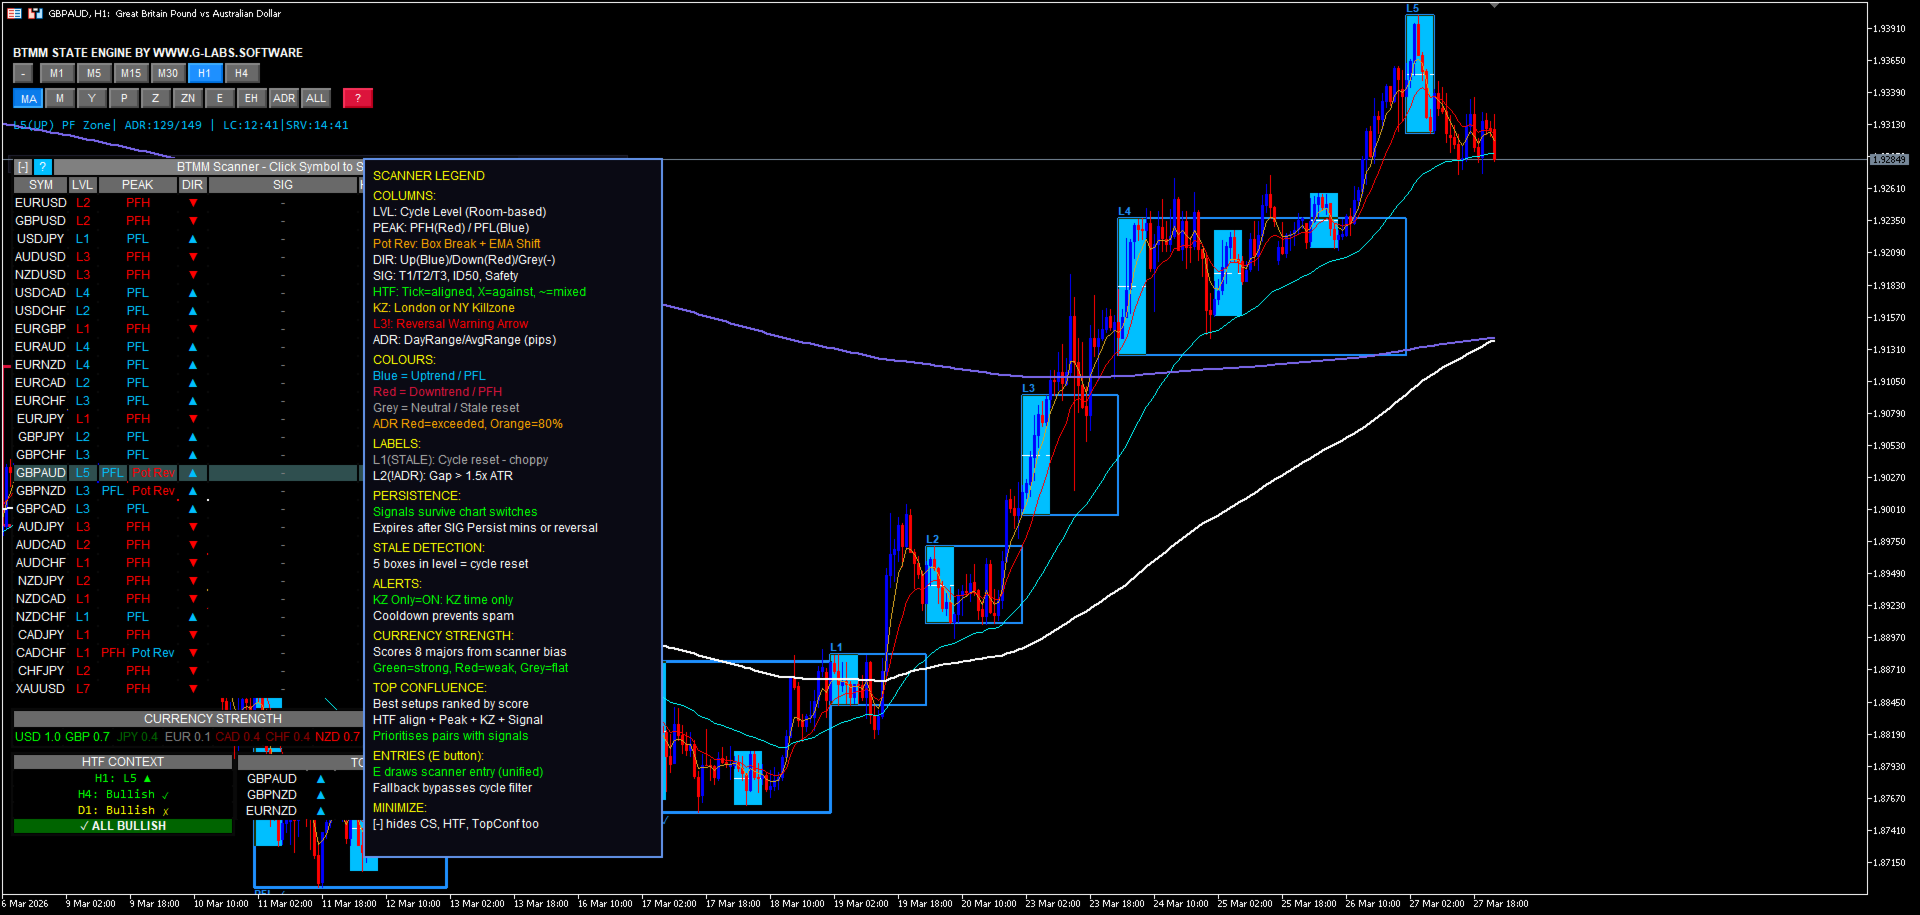
Scanner dashboard
Lists symbols with columns such as symbol, level, peak status, direction, signal, kill zone state, and range-related fields. Click a row to switch the chart where the terminal allows. Layout and columns depend on version and inputs.
Alerts
Enable or disable alert types for the chart and scanner. Typical options include peak confirmation, entry alerts, kill zone notices, cooldown between alerts, optional scanner alerts only in kill zones, and popup settings.
History
Where included, history summarises past signals over a configurable lookback for review in the terminal. Past behaviour does not predict future results.
Settings
Inputs cover session hours, colours, EMA periods, stop buffer, filters, enabled signal types, history depth, scanner list, dashboard position and fonts, and alerts. Full parameter names are listed in the product documentation.
Quick start
Attach to M15 or H1. Check symbol names match your broker. Adjust sessions if needed. Enable alerts. Use toolbar and scanner to switch symbols and layers.
Requirements
MetaTrader 4. Use symbols your broker offers. Match scanner names to broker suffixes. M15 or H1 recommended for the methodology.
See comments for full userguide and walkthrough with charts diagrams and explanations.
Keywords
BTMM, Asian session, kill zone, London session, New York session, peak formation, market structure, multi-pair scanner, MetaTrader 5 indicator


thanks to the author. this is the best indicator for btmm strat by steve mauro. the author is supportive in every inquiry