Volume Profile For MT5
- 지표
- 버전: 2.1
- 업데이트됨: 1 5월 2026
- 활성화: 15

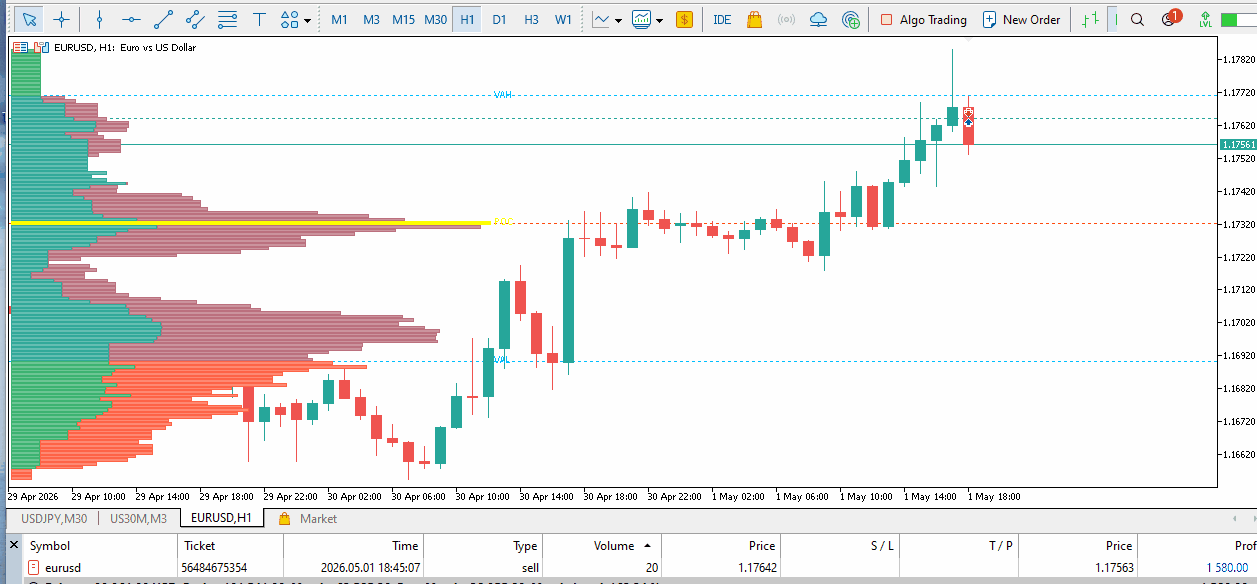
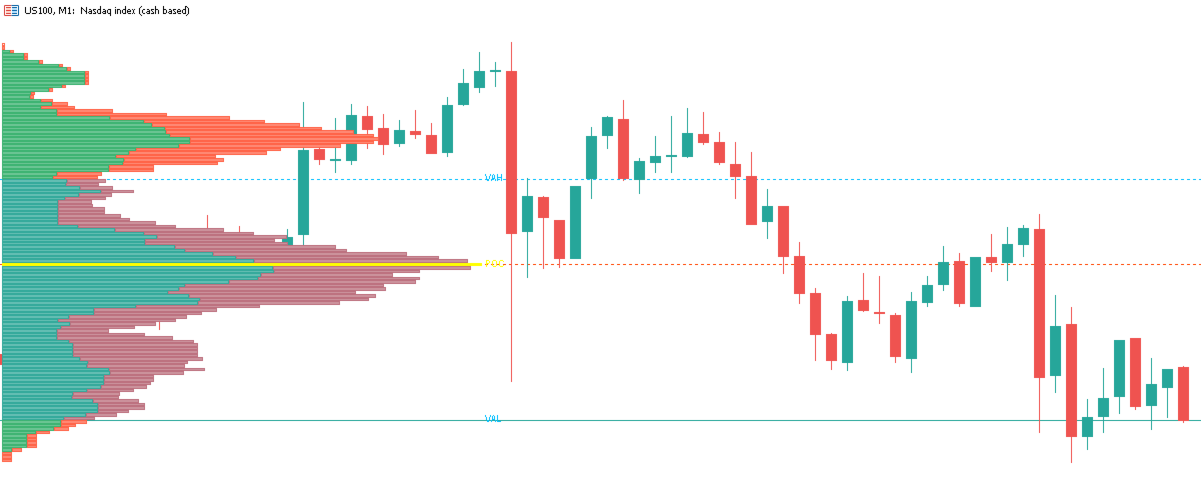
MT5용 Volume Profile VPVR
Volume Profile VPVR은 고급 거래량 프로파일(Visible Range)을 차트에 직접 표시하도록 설계된 강력하고 고성능의 MetaTrader 5 지표입니다. 거래 활동이 집중된 영역을 시각화하여 시장 구조에 대한 심층적인 통찰력을 제공하며, 트레이더가 주요 가격대를 정확하게 파악할 수 있도록 도와줍니다.
이 지표는 가격대별 거래량 분포를 동적으로 분석하고 차트에 상세한 히스토그램을 직접 표시하여 시장 수용, 거부 영역 및 유동성 밀집 지역을 한눈에 파악할 수 있도록 합니다.
🔍 주요 기능
• Visible Range 및 Fixed Range 모드
VPVR(표시되는 캔들에 따라 자동 조정) 모드와 사용자 지정 범위 모드 간에 원활하게 전환하여 더욱 정밀한 분석을 수행할 수 있습니다.
• Point of Control(POC)
거래량이 가장 많은 가격대, 즉 시장의 관심이 가장 높은 가격대를 자동으로 감지하고 강조 표시합니다.
• 가치 영역(VAH/VAL)
설정 가능한 백분율(기본값 70%)을 기준으로 가치 영역의 고가와 저가를 표시하여 적정 가치 영역을 파악하는 데 도움을 줍니다.
• 상승/하락 거래량 분리
각 거래량 막대를 매수(상승) 및 매도(하락) 압력으로 분리하여 주문 흐름을 더욱 자세히 분석할 수 있습니다.
• 실시간 업데이트(틱 기반)
들어오는 틱에 따라 프로필이 지속적으로 업데이트되어 지연 없이 실시간 시장 동향을 추적할 수 있습니다.
• 주요 레벨 확장
POC, VAH, VAL 선을 차트 전체로 확장하여 동적인 지지/저항 영역으로 활용할 수 있습니다.
• 프로필 배치 조정
거래 스타일에 따라 차트의 왼쪽 또는 오른쪽에 프로필을 표시할 수 있습니다.
• 거래량 스케일 조정(가시성 향상)
거래량 스케일 배율을 사용하여 히스토그램을 늘리거나 줄여 시각적 명확성을 높일 수 있습니다.
• 통합 거래량 레이블
선택적으로 히스토그램 막대 내에 매수/매도 거래량 값을 스마트한 형식(K/M 단위)으로 직접 표시할 수 있습니다.
• POC 개발 (선택 사항)
POC의 진행 상황을 실시간으로 추적하여 시장 심리 변화를 파악할 수 있습니다.
• 완벽한 맞춤 설정 가능 디자인
색상, 투명도, 글꼴, 선 스타일, 레이아웃을 거래 설정에 맞게 조정할 수 있습니다.
⚙️ 작동 방식
이 지표는 선택한 가격 범위를 여러 행(구간)으로 나누고 캔들별 가격 중첩을 기준으로 거래량을 분배합니다. 그런 다음 다음과 같은 작업을 수행합니다.
가격대별 총 거래량을 집계합니다.
가장 높은 거래량 노드(POC)를 식별합니다.
바깥쪽으로 확장하여 가치 영역(VAH/VAL)을 계산합니다.
각 가격대에서의 거래량 집중도를 보여주는 히스토그램을 표시합니다.
📊 이 지표를 사용해야 하는 이유
기관 투자자들이 활발하게 활동하는 유동성이 높은 영역을 파악하세요.
강력한 지지선과 저항선을 찾아내세요.
시장의 균형과 불균형을 이해하세요.
진입, 청산 및 손절매 설정을 개선하세요.
스마트 머니 개념 또는 가격 움직임 전략과 결합하여 사용하세요.
🚀 적합한 트레이더:
데이 트레이더
스캘퍼
스윙 트레이더
스마트 머니/오더 플로우 트레이더
이 지표는 기관 수준의 거래량 분석을 MetaTrader 5에 매끄럽고 최적화된 시각적인 형태로 제공하여 진지한 트레이더에게 필수적인 도구입니다.

사용자가 평가에 대한 코멘트를 남기지 않았습니다