Multi Currency Multi Time Market Scan Signals

5

Multi Currency Multi Time Market Scan Signals (MT5 Dashboard)
A powerful multi‑symbol, multi‑timeframe scanner designed for MT5 traders who want fast, accurate, trend‑aligned trading signals — all from a single, intuitive dashboard.

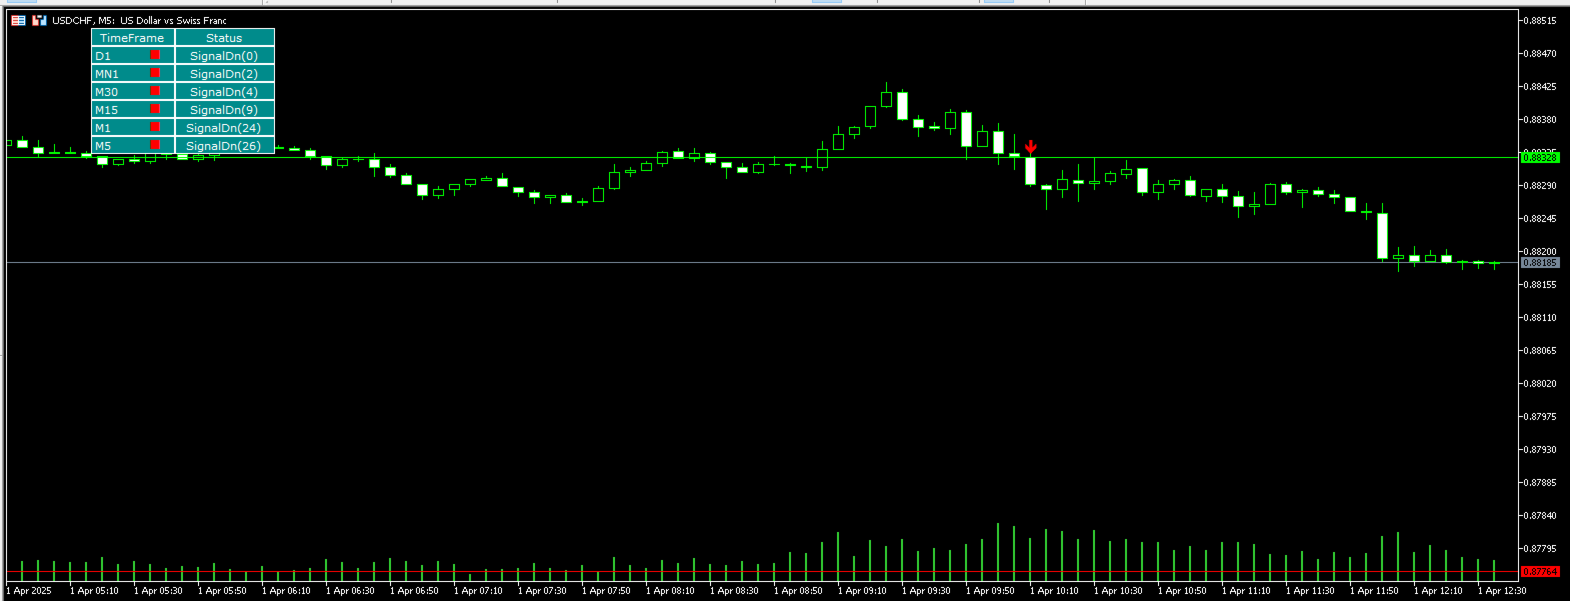
What This Dashboard Does
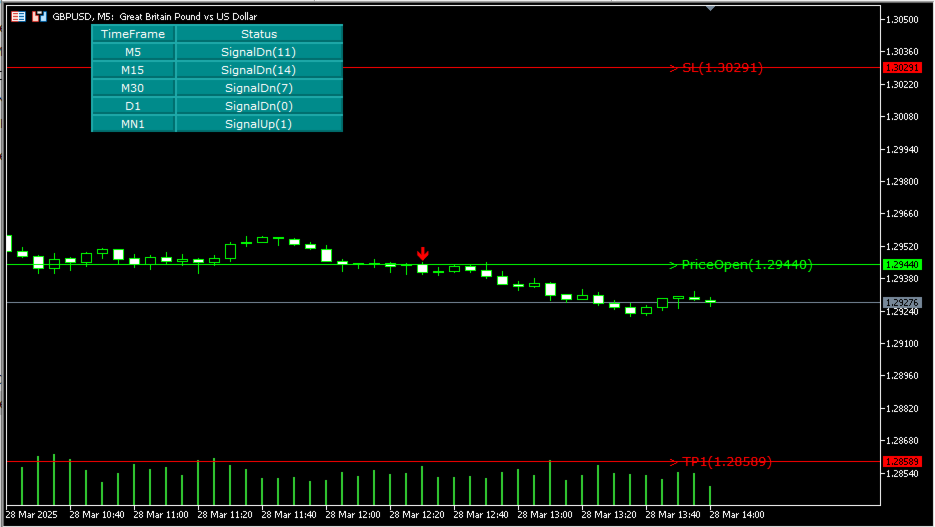
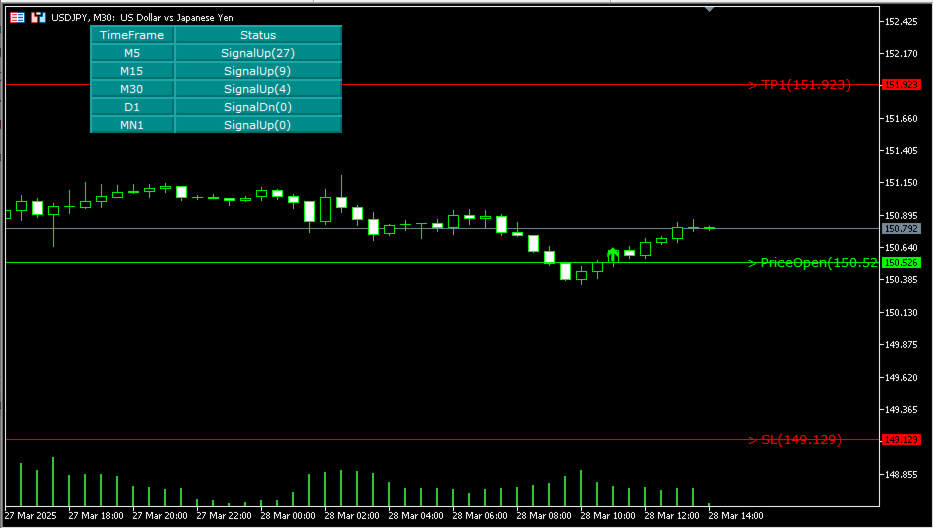
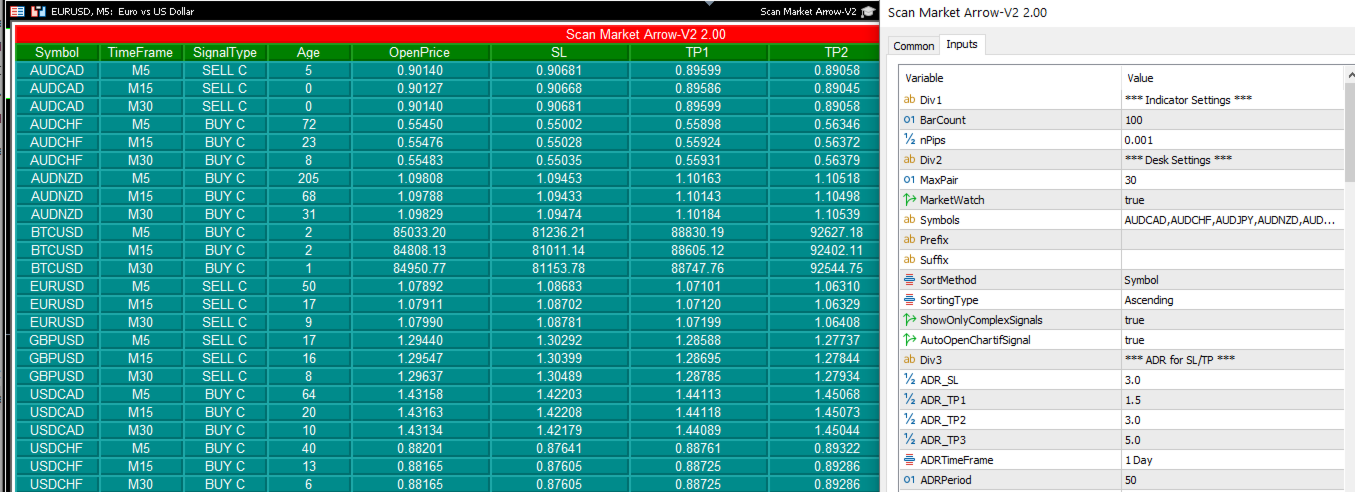
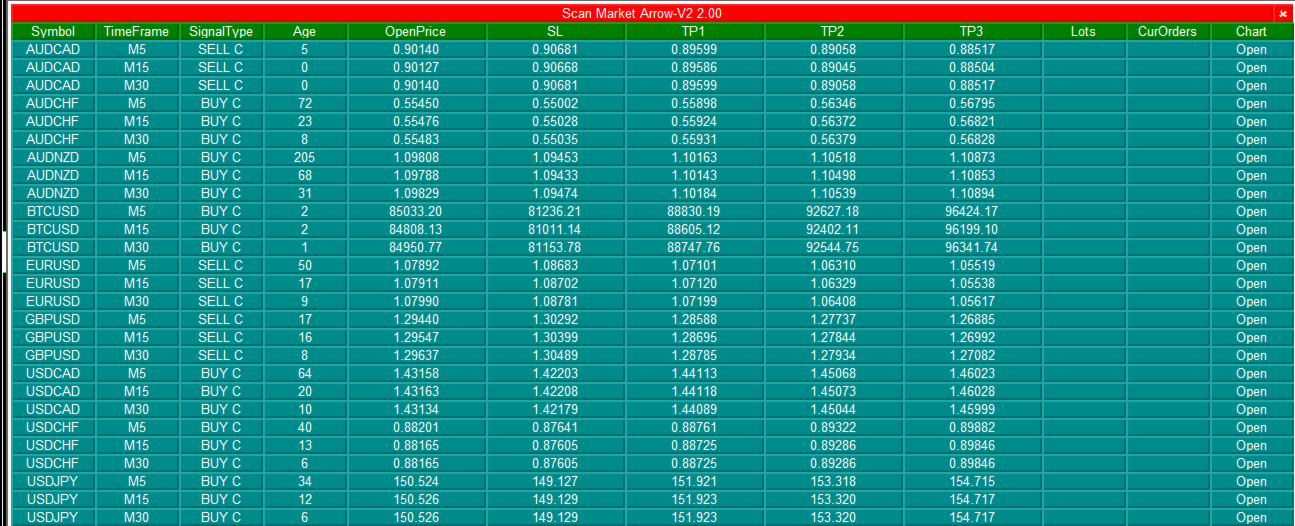
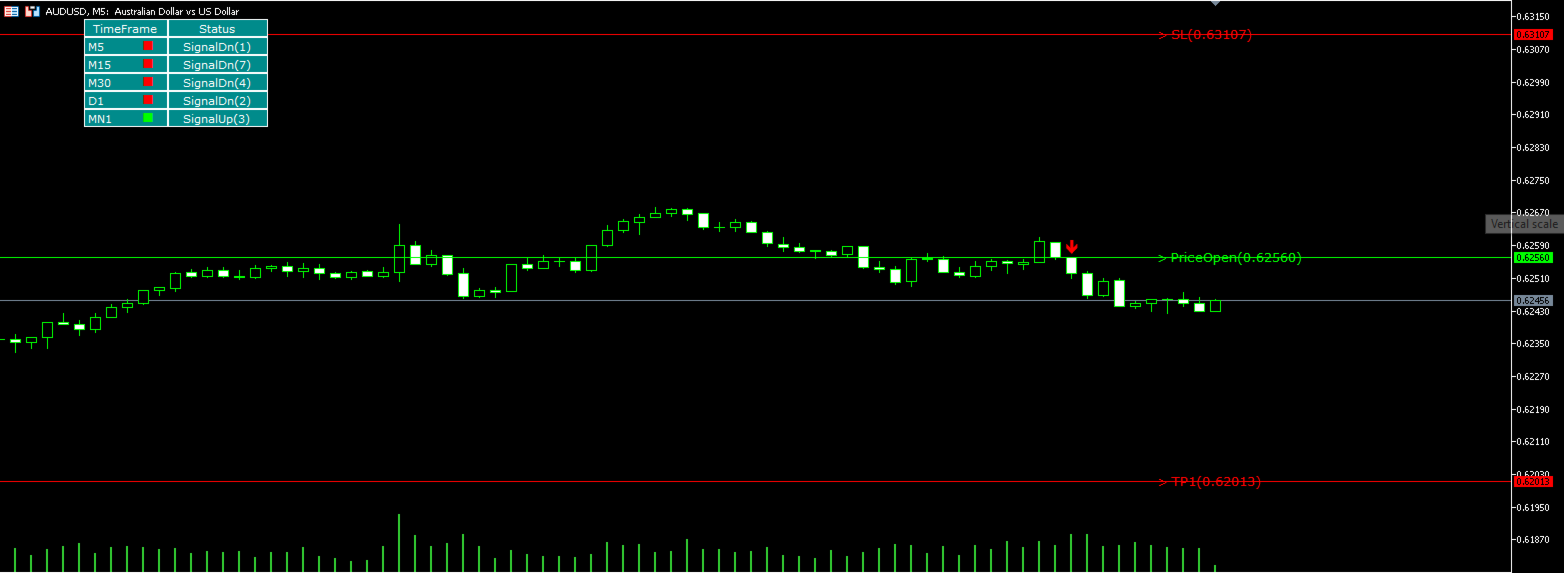
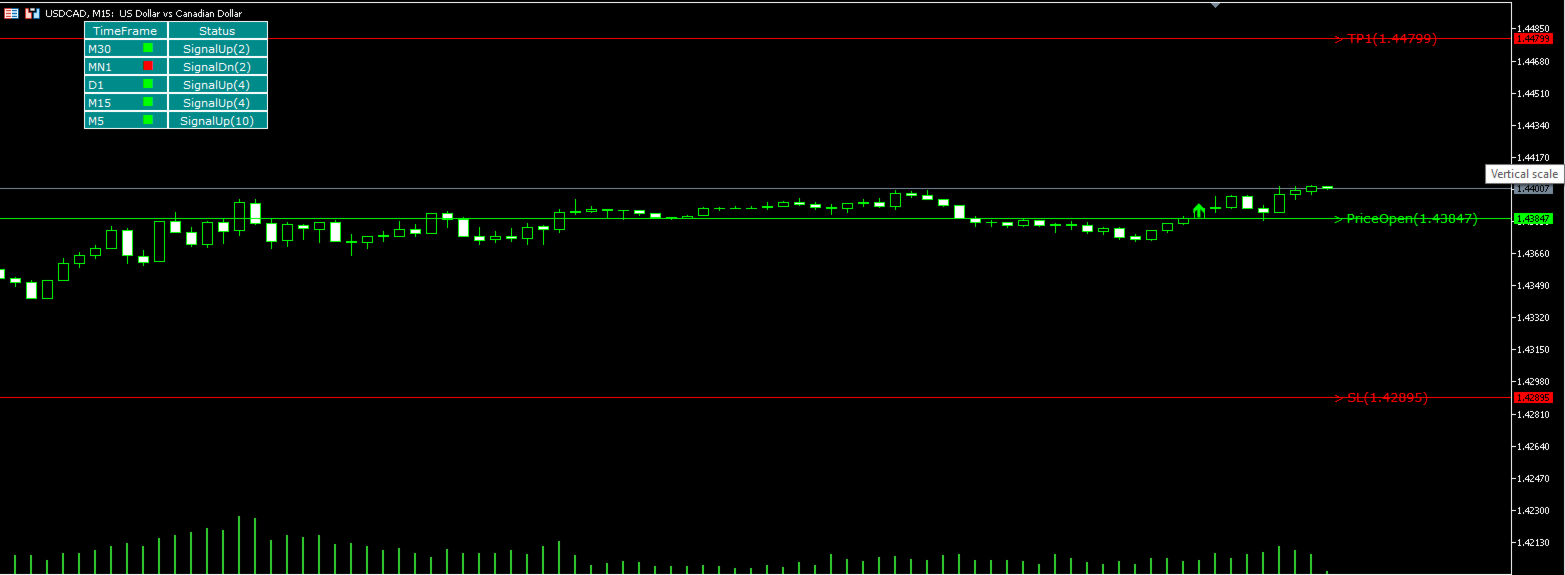
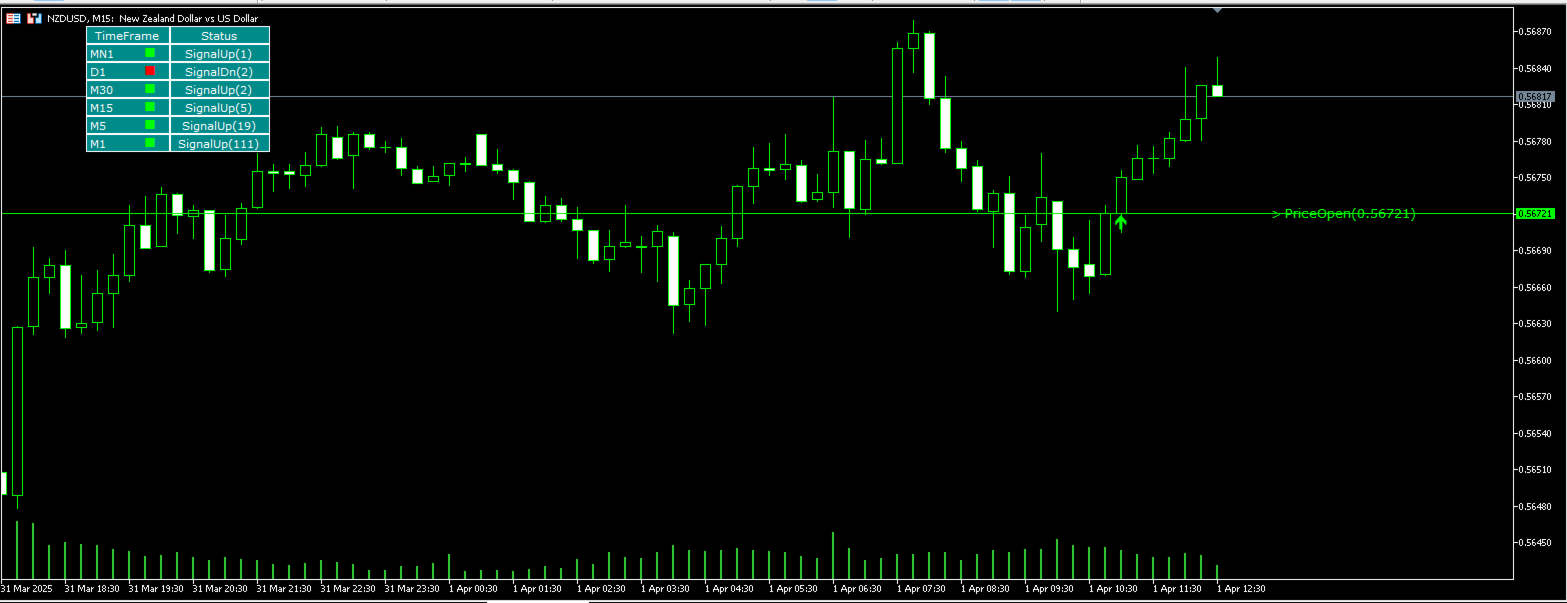
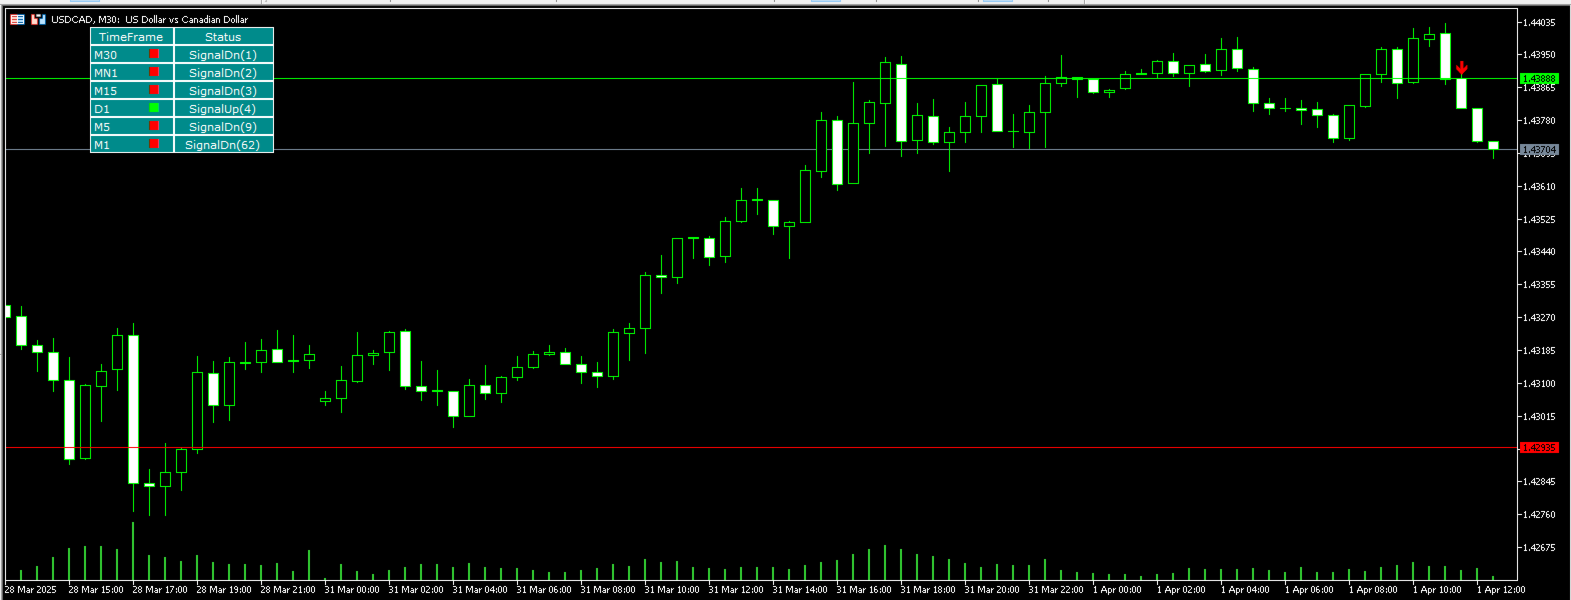
This tool scans 28+ currency pairs across multiple timeframes and instantly displays Buy/Sell signals with Entry, TP1/TP2/TP3, and Stop Loss levels. It removes the need for manual chart surfing by automatically opening the charts where new signals appear.

Core Features
• Multi-symbol & multi-timeframe scanning from one chart
• Clear Entry, TP1–TP3, and SL levels with customizable risk‑to‑reward ratios
• Intelligent sorting options for efficient signal filtering
• Automatic chart opening on new signals
• User‑friendly, fast, and clean dashboard layout
• Compatible with major, minor, and custom symbols
• Sophisticated trend-based algorithm for more reliable signal identification
• “CurOrders” column shows “NoOrders” (indicator only; automation requires companion EA)

How It Works
The dashboard analyzes multiple timeframes simultaneously using a complex trend-detection and signal-generation algorithm. Once a qualifying setup appears, it displays all actionable levels and can instantly open the relevant chart, helping you catch opportunities the moment they form.

Setup Guide
• Attach the dashboard to any MT5 chart
• Choose your symbols and timeframes
• Adjust risk‑to‑reward, alerts, and display preferences
• Dashboard updates automatically; click rows to jump to charts

Why Traders Choose This Tool

• Eliminates manual chart switching
• Helps align trades with broader market trends
• Suitable for scalping (M15–H1), swing trading (H4–D1), or mixed strategies
• Provides all key trade levels at a glance
• Companion EA available separately for full automation of the dashboard’s signals

Version Info
Version 4.30 — Updated April 2025
Note: Always test on a demo account. Past performance does not guarantee future results.


리뷰 1
Levent Safak
1373
Levent Safak 2025.04.04 19:44 
 

Excellent indicator if you trade multi time frames. What works for me 4H/15 min setting.

추천 제품
The VWAP indicator is our version of the popular Volume-Weighted Average Price indicator. The VWAP is the ratio between the value traded (price multiplied by the number of volume traded) and the total volume traded over a specific time period. As a result, it measures the average price of the instrument much better than the simple moving average. Although there are many ways to use the VWAP, most investors use it to calculate the daily average.  The indicator works in five modes: Moving  - In
Buyer Seller Arrows
Oleksandr Sheyko
Buyer Seller Arrows – 자신 있게 거래하세요! 모든 타임프레임(M1 ~ MN1)에서 매수자와 매도자의 힘을 직관적으로 분석할 수 있는 혁신적인 도구입니다. 이 인디케이터는 색상으로 구분된 퍼센트와 화살표 를 통해 시장 역학을 즉시 파악 할 수 있도록 도와줍니다. 주요 기능: 녹색 위쪽 화살표 = 매수세 우위 빨간색 아래쪽 화살표 = 매도세 우위 각 타임프레임(M1, M5, M15, M30, H1, H4, D1, W1, MN1)의 퍼센트 강도 표시 색상 코드 로 빠른 식별 가능 (선명한 녹색과 빨간색) 작동 원리: 매수 압력과 매도 압력의 균형 을 추적 EMA와 SMA 계산 을 통해 강도 측정 실시간으로 트렌드 우위 를 표시 최적의 진입 및 청산 포인트 를 식별하는 데 도움 트레이더들이 좋아하는 이유: 매우 직관적인 시각화 – 복잡한 차트 없이 순수한 시장 강도만 표시 빠른 의사결정 가능 – 스캘핑 및 스윙 트레이딩에 적합 완전한 사용자 맞춤화 –
VWAP Daily
Anton Polkovnikov
Weighted average price indicator or VWAP. The well-known standard VWAP with the beginning of the day is added with the function of selecting the periodization. It can be calculated both every day and on other periods. Also the indicator allows to exclude the volume from the calculation, which will allow using it on the cryptocurrencies and forex. There is an alert for a VWAP price crossing. There are 1 and 2 standard deviation. Settings: Volume: turning volume on and off in the calculation mecha
Blahtech Market Profile MT5
Blahtech Limited
5 (10)
Was: $249  Now: $99   Market Profile defines a number of day types that can help the trader to determine market behaviour. A key feature is the Value Area, representing the range of price action where 70% of trading took place. Understanding the Value Area can give traders valuable insight into market direction and establish the higher odds trade. It is an excellent addition to any system you may be using. Inspired by Jim Dalton’s book “Mind Over Markets”, this indicator is designed to suit the
Currency Strength Meter Pro for MT5
ALEKSANDR SHUKALOVICH
5 (4)
Currency Strength Meter is the easiest way to identify strong and weak currencies. This indicator shows the relative strength of 8 major currencies + Gold: AUD, CAD, CHF, EUR, GBP, JPY, NZD, USD, XAU. Gold symbol can be changed to other symbols like XAG, XAU etc. By default the strength value is normalised to the range from 0 to 100 for RSI algorithm: The value above 60 means strong currency; The value below 40 means weak currency; This indicator needs the history data of all 28 major currency
Atlantis Pro
Mohammed Jebbar
Atlantis Pro Indicator — 틱 단위 실시간 분석과 포트폴리오 운용의 결합 Atlantis Pro Indicator는 실시간 틱 데이터를 기반으로 핵심 가격대와 고확률 반전 구간을 높은 정밀도로 식별할 수 있는 고급 다기능 인디케이터입니다. 시장의 모든 틱 변화를 연속으로 분석하여 매수·매도 압력이 집중되는 순간을 즉시 포착하고, 차트에 선명한 Buy/Sell 화살표를 바로 표시합니다 — 기본값으로 항상 표시되어 즉시 대응 가능합니다. Atlantis Pro는 모든 자산과 모든 시간대 에서 완벽하게 작동하며, 외환, 주식, 상품, 지수, 암호화폐 등 다양한 시장에서 활용할 수 있습니다. 특히 여러 종목을 동시에 모니터링 할 수 있어 최고의 진입·청산 신호를 동시에 포착하고, 분산된 포트폴리오 전략 으로 리스크를 낮추고 수익의 안정성을 높일 수 있습니다. Atlantis Pro와 함께라면 하나의 차트나 단일 종목에 얽매일 필요가 없습니다. 연관성 있는 시장과 무관한 시
Volume Profile V6
Andrey Kolesnik
4.67 (3)
시장 매물대 지표(Volume Profile) + 스마트 오실레이터. 통화 쌍, 주식, 선물, 암호화폐 등 거의 모든 종목에서 작동하며, 실제 거래량(Real Volume)과 틱 거래량(Tick Volume)을 모두 지원합니다. 프로파일 생성 범위를 일주일이나 한 달 등으로 자동 설정할 수 있을 뿐만 아니라, 두 개의 수직선(빨간색과 파란색)을 이동하여 수동으로 범위를 설정할 수도 있습니다. 히스트그램 형태로 표시되며, 특정 가격 수준의 히스토그램 너비는 해당 가격대에서 발생한 거래량을 의미합니다. Mode level line color 파라미터를 사용하면 가격이 반등할 가능성이 높은 주요 매물대 수준을 자동으로 표시할 수 있으며, Maximum color 파라미터는 설정된 전체 범위에서 거래가장 많이 발생한 최대 거래량 수준을 별도로 보여줍니다. 스마트 오실레이터는 과매수 및 과매도 구간을 표시합니다. 여러 지표로부터 오는 정보를 분석하고, 처리된 데이터를 바탕으로 과매수 및 과매
Currency Strength Meter is the easiest way to identify strong and weak currencies. This indicator shows the relative strength of 8 major currencies + Gold: AUD, CAD, CHF, EUR, GBP, JPY, NZD, USD, XAU. Gold symbol can be changed to other symbols like XAG, XAU etc. By default the strength value is normalised to the range from 0 to 100 for RSI algorithm: The value above 60 means strong currency; The value below 40 means weak currency; This indicator needs the history data of all 28 major currency
Dynamic Trend Sniper MT5
Vincent Georges David Ferrier
Trade Like an Institution. Protect Like a Professional. Early Sniper Access: Limited Launch Offer! Get ready to elevate your trading precision. We are offering an exclusive, highly limited launch price for the first Dynamic Trend Sniper users. Our Unbeatable Launch Offer: First 10 Snipers Only: $69 (Full lifetime access + all v1.x updates) Standard Retail Price (After 10 Purchases): $129 Why Act Now? This is not just a discount; it's a strategic entry point. We are committed to rewarding
This Volume Delta Profile is an advanced MetaTrader 5 indicator that visualizes   volume delta (order flow imbalance)   using a volume profile-style histogram. It shows the difference between buying and selling pressure at specific price levels, helping traders identify supply and demand zones. This indicator provides a unique perspective on market dynamics by visualizing the imbalance between buying and selling pressure, offering insights beyond traditional volume analysis. Core Concept Positiv
VolaMetrics VSA
Thalles Nascimento De Carvalho
VolaMetrics VSA | 기술 분석의 강력한 동반자 VolaMetrics VSA 는 Volume Spread Analysis (VSA) 방법론과 자세한 거래량 분석 을 결합한 기술 분석 지표입니다. 중요한 가격 변동 을 식별 하고 추적 하기 위해 설계된 이 도구는 거래량 과 가격 스프레드 의 상호작용을 활용하여 트레이딩 결정에 도움이 되는 귀중한 통찰을 제공합니다. Volume Spread Analysis (VSA)의 기초 **Volume Spread Analysis (VSA)**는 기술 분석에서 존경받는 방법으로, 거래량 , 가격 스프레드 및 종가 간의 관계를 특정 기간 내에 이해하는 데 중점을 둡니다. 가장 정보가 풍부한 운영자 ( 스마트 머니 )가 가격 움직임에 영향을 미친다는 개념에 기반하여, VSA는 축적 또는 분배 신호 를 식별하고 가격의 중요한 변화를 예측합니다. VolaMetrics VSA의 작동 원리 ️ VolaMetrics VSA 는 전통적인 V
FVG with Volume
Israr Hussain Shah
FVG Volume Profile (Institutional Price Action) Unlock the hidden liquidity inside Market Imbalances. The   FVG Volume Profile   is an advanced Price Action indicator that goes beyond standard Fair Value Gap detection. It looks inside the gap using lower timeframe data to construct a   Volume Profile   specifically for that imbalance. This helps you identify exactly where the "Smart Money" is defending positions. Key Features:   Internal Volume Profile:   Automatically scans lower timeframes
KT Volume Profile MT5
KEENBASE SOFTWARE SOLUTIONS
KT Volume Profile은 Y축에 히스토그램 형태로 거래량 누적 데이터를 시각화하여, 특정 시간대 및 가격 수준에서의 거래 활동을 확인할 수 있게 해주는 도구입니다. 이 기능은 트레이더가 거래가 집중된 가격 구간을 식별하는 데 매우 유용합니다. 볼륨 프로파일에서의 POC (Point of Control) POC는 전체 프로파일 중 가장 많은 거래량이 발생한 가격 수준을 나타냅니다. 일반적으로 주요 지지 또는 저항 영역으로 활용되며, 시장이 본격적인 방향 전환 전에 되돌림을 보이는 핵심 레벨로 작용할 수 있습니다. 주요 기능 사용법이 매우 간단합니다. 사각형을 차트에서 드래그 앤 드롭하면 실시간으로 볼륨 프로파일이 업데이트됩니다. 가격이 POC를 돌파할 경우 알림을 설정할 수 있습니다. 처음부터 경량화된 코드로 설계되어 CPU 및 메모리 자원 사용이 최소화됩니다. 입력 설정 볼륨 소스:   틱 볼륨 / 실제 거래량 프로파일 색상:   히스토그램 막대의 색상 박스 너비:  
Arrow Micro Scalper 는 스캘핑 및 단기 거래용으로 설계된 지표로 모든 차트 및 금융 상품(통화, 암호화폐, 주식, 금속)에 통합되어 있습니다. 그녀는 작업에서 파동 분석과 추세 방향 필터를 사용합니다. M1부터 H4까지의 시간대에 사용하는 것이 좋습니다. 표시기로 작업하는 방법. 표시기에는 설정 변경을 위한 2개의 외부 매개변수가 포함되어 있으며 나머지는 기본적으로 이미 구성되어 있습니다. 큰 화살표는 추세 방향의 변화를 나타내고 파란색 화살표는 하락 추세의 시작을 나타내며 분홍색 화살표는 상승 추세의 시작을 나타냅니다. " Only trending direction " 매개변수는 내부 트렌드를 사용하는 모드를 켜고 끄며 자신만의 트렌드를 사용하거나 트렌드 방향 없이 작업할 수 있는 기회를 제공합니다. 또한 트렌드에서만 트렌드 화살표 및 신호 화살표 표시를 켜거나 끕니다. . 지표의 가장 중요한 개체인 작은 신호 화살표는 "매수" 거래의 경우 분홍색, "매도" 거
CvdDeltaVolumes
Parasbhai N Patel
Delta + CVD & CVD Candles Order-flow indicator combining Delta (Ask–Bid), Cumulative Volume Delta (CVD), and a unique CVD-based synthetic candle system. Shows buy/sell pressure, volume aggressiveness, and momentum shifts with optional Delta histogram, CVD line, and CVD+Delta combined candles. Useful for scalping, intraday trading, divergence detection, and understanding buyer/seller dominance. Overview The Delta + CVD & CVD Candles Indicator combines multiple order-flow tools into one clean
Supply and Demand Monster
Tsog Erdene Borjigon Enkhkhudulmur
Supply and demand zones are at the heart of   supply and demand trading . These zones are areas that show  liquidity at a specific price.  The supply zone is also called the distribution zone, while the demand zone is called the accumulation zone.   Our indicator automatically draw supply and demand zones in Metatrader 5. It give opportunity to understand trading zone and avoiding risk.
표시기는 현재 시세를 작성하여 과거 시세와 비교할 수 있으며 이를 바탕으로 가격 변동을 예측합니다. 표시기에는 원하는 날짜로 빠르게 이동할 수 있는 텍스트 필드가 있습니다. 옵션: 기호 - 표시기가 표시할 기호 선택. SymbolPeriod - 지표가 데이터를 가져올 기간 선택. IndicatorColor - 표시기 색상. HorisontalShift - 지시자가 그린 따옴표를 지정된 막대 수만큼 이동합니다. Inverse - true는 인용 부호를 반대로, false - 원래 보기를 반전합니다. ChartVerticalShiftStep - 차트를 수직으로 이동합니다(키보드의 위/아래 화살표). 다음은 날짜를 입력할 수 있는 텍스트 필드의 설정으로, '엔터'를 누르면 즉시 이동할 수 있습니다.
Total Volume Profile
Shahabeddin Baset
Includes almost all the concepts related to Volume Profile: POC , Value Area , Developing POC , Anchored VWAP , Volume Delta ; since the “Total” in its name. It is fast in its calculations and simple to work with. Features: 1.    Selectable calculation timeframe to find most traded levels. 2.    Capable of calculating Volume Profile based on tick data 3.    Adjustable histogram bars by their count. 4.    Adjustable histogram bars by their height (price range). 5.    Showing Value Area (VA
VolumeProfile MT5
Robert Hess
4.14 (7)
Description: The Volume Profile displays detailed informations of historical trading activities at certain price levels (Market Profile). Locate the areas with the best prices in the market and get an advantage over other market participants. Features: Customizable Market Profile Shows the "fair" Value Area with 70% of all Volume Shows critical low volume zones Shows VPOC, VAL and VAH Points integrated resource management to reduce the load while working with multiple charts Works on all timefr
The MarketProfileTPO indicator for MetaTrader 5 is a powerful tool designed to bring the Market Profile concept, based on Time Price Opportunity (TPO) analysis , directly onto your main chart window. This indicator calculates and displays the price distribution over a specified period, highlighting key areas of market activity and concentration. It is particularly optimized for high-volatility instruments like NAS100, US30, and XAUUSD when used on the M1 (1-minute) timeframe, offering a detailed
FREE
Price Volume Distribution 가격 수준별 거래량 분포를 분석하는 Volume Profile 지표. MT5용 POC, Value Area, 거래량 급등 및 존 기반 신호 필터링을 표시합니다. 개요 Price Volume Distribution은 MetaTrader 5용 거래량 분석 지표입니다. M1 타임프레임 데이터를 사용하여 가격 수준별 거래량 분포를 계산하고 표시하며, 히스토그램 바와 참조선을 통해 시각적 표현을 제공합니다. 시스템 이해를 위한 사용자 가이드   |   기타 언어 사용자 가이드 주요 기능 지표가 식별하는 항목: - Point of Control (POC): 가장 높은 거래량의 가격 수준 - Value Area High/Low (VAH/VAL): 거래량의 70%를 포함하는 가격 범위 - 거래량 급등: 비정상적으로 높은 활동의 가격 수준 - 거래량 집중에 기반한 지지 및 저항 존 프로파일 모드 세 가지 계산 모드 제공: 1. 세션 모드:
Smart Fair Value Zones
Walter Takeo Eposhi Ito
# Smart Fair Value Zones - Professional Fair Value Gap Indicator for MetaTrader 5 ## Advanced FVG Detection with Intelligent Auto-Removal Smart Fair Value Zones is a sophisticated, automated Fair Value Gap (FVG) indicator designed specifically for MetaTrader 5. This professional trading tool identifies market imbalances with precision and includes intelligent auto-removal functionality that deletes FVGs immediately when price touches them - because **each FVG should only be used once**. ## K
Win43 Scalper
Eadvisors Software Inc.
O novo s43 Scalper para Mini-Índice (WIN-IND) faz operações de curto prazo no timeframe 1min buscando pequenas variações do mercado, utiliza nova tecnologia de trade, os resultados no intraday são íncríveis, confira:      Após a instalação adicione no gráfico dos instrumentos win para visualizar os resultados no backteste. Recomendamos o timeframe de 1min.
Institutional Key Zones Pro
Mohan Shivaji Shivtare
Institutional Key Zones Pro — Institutional Grade Level & Liquidity Map HTF Key Zones is a professional indicator designed for traders seeking a comprehensive and automated approach to high-timeframe (HTF) market structure. Visualize critical zones used by smart money and institutions, directly on your chart: Key Features Automated HTF Levels:   Instantly identify and display previous Monthly, Weekly, and Daily Highs/Lows (PMH/PML, PWH/PWL, PDH/PDL) and their midpoints (DCE, WCE). Order Block De
BoxChart MT5
Evgeny Shevtsov
5 (7)
The market is unfair if only because 10% of participants manage 90% of funds. An ordinary trader has slim changes to stand against these "vultures". This problem can be solved. You just need to be among these 10%, learn to predict their intentions and move with them. Volume is the only preemptive factor that faultlessly works on any timeframe and symbol. First, the volume appears and is accumulated, and only then the price moves. The price moves from one volume to another. Areas of volume accumu
VPO Profile MT5
Kyra Nickaline Watson-gordon
5 (2)
Definition : VPO is a Volume Price Opportunity. Instead of using bars or candles with an Open, High, Low, and Close price, each "bar" in a Market Profile is represented by horizontal bars against the price It is called Market Profile terminology. In other words volume-price-opportunity (VPO) profiles are histograms of how many volumes were traded at each price within the span of the profile. By using a VPO chart, you are able to analyze the amount of trading activity, based on volume, for each
Color Histogram Volume Set
Ricardo Almeida Branco
Do you use volume in your reading of the market? Certainly many traders use it, and do not imagine operating without it. The Color Histogram Volume Set indicator allows the user to choose the value that he considers interesting to monitor. When you pass this you will have visual confirmation and if you want you will also have the audible alert that is given by the indicator. Of course, there are other ways to try to find a high volume, such as assessing whether the volume is above av
Before installing the HeatMap indicator make sure you are using a broker that gives you access to the Depth of market (DOM) !! This indicator creates a heatmap on your chart allowing you to see the buy or sell limit orders easily and in real time. You have the possibility to change the setting and the colors of the HeatMap in order to adapt to all markets and all charts. Here is an example of a setting you can use with the NASDAQ100 on the AMPGlobal broker :  https://www.youtube.com/watch?v=x0Y
Quantum Scalperx
Lobar Berdiyarova
Quantum Scalper – advanced adaptive EMA indicator for scalpers and trend traders. It adjusts to market volatility, detects shifts instantly, and provides clear entry/exit levels. Fast, lightweight, and highly accurate – your edge in the market. Quantum Scalper – Precision Tool for Fast and Smart Trading Quantum Scalper is a cutting-edge indicator built on adaptive EMA logic with correction algorithms. It dynamically adjusts to price movements, filters market noise, and highlights precise entry
1.       Overview The Volume Pressure Histogram (VPH) is a custom indicator for MetaTrader 5 (MT5) that measures buying and selling pressure based on tick or real volume. It highlights extreme buying/selling moments and provides a smoothed signal line for trend detection. 2.       Indicator Components ·          Volume Pressure Histogram (Colored): o    Green: Extreme buying pressure o    Lime: Buying pressure o    Red: Extreme selling pressure o    Yellow: Selling pressure ·          Signal Li
이 제품의 구매자들이 또한 구매함
ARIPoint
Temirlan Kdyrkhan
ARIPoint is a powerful trading companion designed to generate high-probability entry signals with dynamic TP/SL/DP levels based on volatility. Built-in performance tracking shows win/loss stats, PP1/PP2 hits, and success rates all updated live. Key Features: Buy/Sell signals with adaptive volatility bands Real-time TP/SL/DP levels based on ATR Built-in MA Filter with optional ATR/StdDev volatility Performance stats panel (Success, Profit/Loss, PP1/PP2) Alerts via popup, sound, push, or email Cu
Divergence Bomber
Ihor Otkydach
4.9 (87)
이 지표를 구매하신 분께는 다음과 같은 혜택이 무료로 제공됩니다: 각 거래를 자동으로 관리하고, 손절/익절 수준을 설정하며, 전략 규칙에 따라 거래를 종료하는 전용 도우미 툴 "Bomber Utility" 다양한 자산에 맞게 지표를 설정할 수 있는 셋업 파일(Set Files) "최소 위험", "균형 잡힌 위험", "관망 전략" 모드로 설정 가능한 Bomber Utility의 셋업 파일 이 전략을 빠르게 설치, 설정, 시작할 수 있도록 돕는 단계별 영상 매뉴얼 주의: 위의 모든 보너스를 받기 위해서는 MQL5 개인 메시지 시스템을 통해 판매자에게 연락해 주세요. 독창적인 커스텀 지표인 “Divergence Bomber(다이버전스 봄버)”를 소개합니다. 이 지표는 MACD 다이버전스(괴리) 전략을 기반으로 한 올인원(All-in-One) 거래 시스템입니다. 이 기술 지표의 주요 목적은 가격과 MACD 지표 간의 다이버전스를 감지하고, **향후 가격이 어느 방향으로 움직일지를 알려주는
Power Candles MT5
Daniel Stein
4.75 (8)
Power Candles V3 - 최초의 자가 최적화 강도 지표 Power Candles V3 는 강도 분석을 즉시 실행 가능한 트레이딩 시스템으로 바꿉니다. 시장 강도에 따라 차트에 색을 입히는 것에 그치지 않고, 백그라운드에서 실시간 자동 최적화를 돌려 해당 심볼에 가장 적합한 Stop Loss, Take Profit, 시그널 임계값을 제시합니다. 원클릭으로 실거래에 그대로 적용됩니다. 이 도구는 Stein Investments 생태계의 일부입니다.  18종 도구 전체 탐색, AI 기반 셋업 추천,  커뮤니티 참여는 여기에서: https://stein.investments Version 3 신규 기능 - AUTO-OPTIMIZER 차트가 로드될 때마다, 그리고 각 봉이 마감될 때마다 Power Candles V3는 해당 심볼의 과거 데이터 위에서 3,000개 이상의 트레이드 조합 을 시뮬레이션합니다: 두 가지 전략 을 병렬 테스트: Momentum(MOM)과 Reversal(
Grabber System MT5
Ihor Otkydach
4.83 (23)
탁월한 기술적 지표인 Grabber를 소개합니다. 이 도구는 즉시 사용 가능한 “올인원(All-Inclusive)” 트레이딩 전략으로 작동합니다. 하나의 코드 안에 강력한 시장 기술 분석 도구, 매매 신호(화살표), 알림 기능, 푸시 알림이 통합되어 있습니다. 이 인디케이터를 구매하신 모든 분들께는 다음의 항목이 무료로 제공됩니다: Grabber 유틸리티: 오픈 포지션을 자동으로 관리하는 도구 단계별 영상 매뉴얼: 설치, 설정, 그리고 실제 거래 방법을 안내 맞춤형 세트 파일: 인디케이터를 빠르게 자동 설정하여 최고의 성과를 낼 수 있도록 도와줍니다 다른 전략은 이제 잊어버리세요! Grabber만이 여러분을 새로운 트레이딩의 정점으로 이끌어 줄 수 있습니다. Grabber 전략의 주요 특징: 거래 시간 프레임: M5부터 H4까지 거래 가능한 자산: 어떤 자산이든 사용 가능하지만, 제가 직접 테스트한 종목들을 추천드립니다 (GBPUSD, GBPCAD, GBPCHF, AUDCAD, AU
이 지표를 구매하면 제 프로페셔널 트레이드 매니저를 무료로 드립니다. 우선 이 거래 시스템이 리페인팅, 리드로잉 및 레이그 인디케이터가 아니라는 점을 강조하는 것이 중요합니다. 이는 수동 및 로봇 거래 모두에 이상적인 것으로 만듭니다. 온라인 강좌, 설명서 및 프리셋 다운로드. "스마트 트렌드 트레이딩 시스템 MT5"은 새로운 및 경험이 풍부한 트레이더를 위해 맞춤형으로 제작된 종합적인 거래 솔루션입니다. 10개 이상의 프리미엄 인디케이터를 결합하고 7개 이상의 견고한 거래 전략을 특징으로 하여 다양한 시장 조건에 대한 다목적 선택이 가능합니다. 트렌드 추종 전략: 효과적인 트렌드 추이를 타기 위한 정확한 진입 및 손절 관리를 제공합니다. 반전 전략: 잠재적인 트렌드 반전을 식별하여 트레이더가 범위 시장을 활용할 수 있게 합니다. 스캘핑 전략: 빠르고 정확한 데이 트레이딩 및 단기 거래를 위해 설계되었습니다. 안정성: 모든 인디케이터가 리페인팅, 리드로잉 및 레이그가 아니므로 신뢰
Quantum TrendPulse
Bogdan Ion Puscasu
5 (23)
SuperTrend   ,   RSI   ,   Stochastic   의 힘을 하나의 포괄적인 지표로 결합하여 트레이딩 잠재력을 극대화하는 궁극의 트레이딩 도구   인 Quantum TrendPulse를   소개합니다. 정밀성과 효율성을 추구하는 트레이더를 위해 설계된 이 지표는 시장 추세, 모멘텀 변화, 최적의 진입 및 종료 지점을 자신 있게 식별하는 데 도움이 됩니다. 주요 특징: SuperTrend 통합:   주요 시장 추세를 쉽게 따라가고 수익성의 물결을 타세요. RSI 정밀도:   매수 과다 및 매도 과다 수준을 감지하여 시장 반전 시점을 파악하는 데 적합하며 SuperTrend 필터로 사용 가능 확률적 정확도:   변동성이 큰 시장에서 숨겨진 기회를 찾기 위해 확률적 진동   을 활용하고 SuperTrend의 필터로 사용 다중 시간대 분석:   M5부터 H1 또는 H4까지 다양한 시간대에 걸쳐 시장을 최신 상태로 유지하세요. 맞춤형 알림:   맞춤형 거래 조건이 충족되면
Azimuth Pro
Ottaviano De Cicco
5 (7)
Azimuth Pro V2: Synthetic Fractal Structure and Confirmed Entries for MT5 Overview Azimuth Pro is a multi-level swing structure indicator by Merkava Labs . Four nested swing layers, swing-anchored VWAP, ABC pattern detection, three-timeframe structural filtering, and closed-bar confirmed entries — one chart, one workflow from micro-swings to macro-cycles. This is not a blind signal product. It is a structure-first workflow for traders who care about location, context, and timing. V2 Launch Offe
SignalTech MT5
Yue Wang
5 (4)
SignalTech MT5 is a trading system for EURUSD, USDCHF, USDJPY, AUDUSD, NZDUSD, EURJPY, AUDJPY, NZDJPY, CADJPY H2 and H3 Timeframe.  It can generate signals with Buy/Sell Arrows and Pop-Up/Sound Alerts. Each signal has clear Entry and Stop Loss levels, which should be automatically flagged on the chart, as well as potential Targets 1, 2, and 3. The Entry and TP levels are fixed after the trade is taken. The exit level is dynamic. If there are signs of a potential short-term trend reversal, the
Meravith MT5
Ivan Stefanov
5 (1)
마켓 메이커를 위한 도구. Meravith는 다음과 같은 기능을 제공합니다: 모든 타임프레임을 분석하고 현재 유효한 추세를 표시합니다. 강세와 약세 거래량이 동일한 유동성 구간(거래량 균형 구간)을 강조 표시합니다. 서로 다른 타임프레임의 모든 유동성 레벨을 차트에 직접 표시합니다. 텍스트 기반 시장 분석을 생성하여 참고용으로 제공합니다. 현재 추세를 기반으로 목표가, 지지선 및 손절가를 계산합니다. 거래의 위험 대비 보상 비율(Risk/Reward)을 계산합니다. 계좌 잔고에 따라 포지션 크기를 산출하고 잠재 수익을 추정합니다. 시장에 중대한 변화가 발생할 경우 경고도 제공합니다. 지표의 주요 라인: 강세/약세 거래량 소진 라인 — 목표가로 사용됩니다. 시장 추세를 나타내는 라인. 시장이 강세인지 약세인지에 따라 색상이 변경되며 추세 지지선 역할을 합니다. 색상은 주로 시장 심리를 보여줍니다. 거래량 균형선(Eq). Eq(Volume Equilibrium) 라인은 시스템의 핵심입니
Atomic Analyst MT5
Issam Kassas
3.94 (31)
우선적으로 언급할 점은이 거래 지표가 다시 그리지 않고 지연되지 않으며 이를 통해 수동 및 로봇 거래 모두에 이상적이라는 점입니다. 사용자 매뉴얼: 설정, 입력 및 전략. Atomic Analyst는 가격의 강도와 모멘텀을 활용하여 시장에서 더 나은 이점을 찾는 PA Price Action Indicator입니다. 고급 필터를 장착하여 잡음과 거짓 신호를 제거하고 거래 잠재력을 높이는 데 도움이 됩니다. 복잡한 지표의 다중 레이어를 사용하여 Atomic Analyst는 차트를 스캔하고 복잡한 수학적 계산을 간단한 신호와 색상으로 변환하여 초보 트레이더가 이해하고 일관된 거래 결정을 내릴 수 있도록합니다. "Atomic Analyst"는 새로운 및 경험이 풍부한 트레이더를위한 종합적인 거래 솔루션입니다. 프리미엄 지표와 최고 수준의 기능을 하나의 거래 전략에 결합하여 모든 종류의 트레이더에 대한 다재다능한 선택지가되었습니다. 인트라데이 거래 및 스캘핑 전략 : 빠르고 정확한 일일
Bill Williams Advanced
Siarhei Vashchylka
5 (11)
Bill Williams Advanced is designed for automatic chart analysis using Bill Williams' "Profitunity" system. The indicator analyzes four timeframes at once. Manual (Be sure to read before purchasing) Advantages 1. Analyzes the chart using Bill Williams' "Profitunity" system. Signals are displayed in a table in the corner of the screen and on the price chart. 2. Finds all known AO and AC signals, as well as zone signals. Equipped with a trend filter based on the Alligator. 3. Finds "Divergence Bar
Entry Points Pro for MT5
Yury Orlov
4.48 (138)
다시 색을 칠하지 않고 거래에 진입할 수 있는 정확한 신호를 제공하는 MT5용 지표입니다. 외환, 암호화폐, 금속, 주식, 지수 등 모든 금융 자산에 적용할 수 있습니다. 매우 정확한 추정값을 제공하고 매수와 매도의 가장 좋은 시점을 알려줍니다. 하나의 시그널로 수익을 내는 지표의 예와 함께 비디오 (6:22)시청하십시오! 대부분의 거래자는 Entry Points Pro 지표의 도움으로 첫 거래 주 동안 트레이딩 결과를 개선합니다. 저희의   Telegram Group 을 구독하세요! Entry Points Pro 지표의 좋은점. 재도색이 없는 진입 신호 신호가 나타나고 확인되면(시그널 캔들이 완성된 경우) 신호는 더 이상 사라지지 않습니다. 여타 보조지표의 경우 신호를 표시한 다음 제거되기 때문에 큰 재정적 손실로 이어집니다. 오류 없는 거래 게시 알고리즘을 통해 트레이드(진입 또는 청산)를 할 이상적인 순간을 찾을 수 있으며, 이를 통해 이를 사용하는 모든 거래자의 성공률이
소개       Quantum Breakout PRO   , 브레이크아웃 존 거래 방식을 변화시키는 획기적인 MQL5 지표! 13년 이상의 거래 경험을 가진 숙련된 트레이더 팀이 개발한       퀀텀 브레이크아웃 PRO       혁신적이고 역동적인 브레이크아웃 존 전략으로 거래 여정을 새로운 차원으로 끌어올리도록 설계되었습니다. Quantum Breakout Indicator는 5개의 이익 목표 영역이 있는 브레이크아웃 영역의 신호 화살표와 브레이크아웃 상자를 기반으로 한 손절 제안을 제공합니다. 초보자 거래자와 전문 거래자 모두에게 적합합니다. Quantum EA 채널:       여기를 클릭하세요 중요한! 구매 후 설치 매뉴얼을 받으려면 개인 메시지를 보내주십시오. 추천: 기간: M15 통화쌍: GBPJPY, EURJPY, USDJPY,NZDUSD, XAUUSD 계정 유형: 스프레드가 매우 낮은 ECN, Raw 또는 Razor 브로커 시간: GMT +3 중개인 :
Btmm state engine pro
Garry James Goodchild
5 (4)
BTMM State Engine Pro is a MetaTrader 5 indicator for traders who use the Beat The Market Maker approach: Asian session context, kill zone timing, level progression, peak formation detection, and a multi-pair scanner from a single chart. It combines cycle state logic with a built-in scanner dashboard so you do not need the same tool on many charts at once. What it does Draws the Asian session range; session times can follow broker server offset or be set in inputs. Tracks level progression (L
OmniSync Projection
Antonio-alin Teculescu
5 (1)
Chronos Fractal Engine is an innovative price projection indicator for MetaTrader 5, designed to transform your technical analysis by intelligently identifying and projecting historical price patterns. Built upon an advanced correlation algorithm and the fractal principles of the market, this powerful tool visualizes potential future price movements, giving you a unique edge in your trading decisions. What is Chronos Fractal Engine? At its core, the Chronos Fractal Engine employs a sophisticat
Berma Bands
Muhammad Elbermawi
5 (8)
Berma Bands(BBs) 지표는 시장 동향을 파악하고 이를 활용하려는 트레이더에게 귀중한 도구입니다. 가격과 BBs 간의 관계를 분석함으로써 트레이더는 시장이 추세 단계인지 범위 단계인지를 분별할 수 있습니다. 자세한 내용을 알아보려면 [ Berma Home Blog ]를 방문하세요. 버마 밴드는 세 개의 뚜렷한 선으로 구성되어 있습니다. 어퍼 버마 밴드, 미들 버마 밴드, 로어 버마 밴드입니다. 이 선들은 가격 주위에 그려져 전체 추세에 대한 가격 움직임을 시각적으로 표현합니다. 이 밴드들 사이의 거리는 변동성과 잠재적인 추세 반전에 대한 통찰력을 제공할 수 있습니다. 버마 밴드 라인이 각각에서 분리될 때, 그것은 종종 시장이 횡보 또는 범위 이동 기간에 접어들고 있음을 시사합니다. 이는 명확한 방향 편향이 없음을 나타냅니다. 트레이더는 이러한 기간 동안 추세를 파악하기 어려울 수 있으며 더 명확한 추세가 나타날 때까지 기다릴 수 있습니다. 버마 밴드 라인이 단일 라인으로
Gartley Hunter Multi
Siarhei Vashchylka
5 (11)
Gartley Hunter Multi - An indicator for searching for harmonic patterns simultaneously on dozens of trading instruments and on all possible timeframes. Manual (Be sure to read before purchasing) | Version for MT4 Advantages 1. Patterns: Gartley, Butterfly, Shark, Crab. Bat, Alternate Bat, Deep Crab, Cypher 2. Simultaneous search for patterns on dozens of trading instruments and on all possible timeframes 3. Search for patterns of all possible sizes. From the smallest to the largest 4. All fou
META 포인트 PRO       — 는 추세 추종 도구로, 거래에서 추측을 배제하고 시장이 이미 결정을 내린 지점을 보여줍니다. 이 지표는 추세, 추세선 및 구조가 변화하는 주요 지점을 식별하고 주요 참여자들이 포지션을 취할 수 있도록 가격이 되돌아오는 영역을 강조합니다. 단순히 가격 움직임만 보는 것이 아니라, 그 이면에 숨겨진 논리까지 이해할 수 있습니다. 모든 신호는 캔들 마감 후 기록되며, 다시 그려지지 않고 차트에 저장되므로 상황을 확실하게 분석하고 결정을 내릴 수 있습니다. 거래 목표(이익 실현) 또한 표시됩니다. 이 지표의 효과에 대해 완벽한 확신을 가지실 수 있도록 자동 통계 자료를 제공해 드립니다. 방향 전환 후에는 손절매 수준과 해당 수준이 지능적으로 점진적으로 이동하는 모습(Move SL)을 표시해주는데, 이는 매우 중요합니다.       감소시킨다       위험       위치별로. 손절매/이익실현/RR 오른쪽에 내장된 패널은 현재 글로벌 추세 방향의 시장
" Dynamic Scalper System MT5 " 지표는 추세 파동 내에서 스캘핑 방식으로 거래하도록 설계되었습니다. 주요 통화쌍 및 금에서 테스트되었으며, 다른 거래 상품과의 호환성이 가능합니다. 추가적인 가격 변동 지원을 통해 추세에 따라 단기 포지션 진입 신호를 제공합니다. 지표의 원리 큰 화살표는 추세 방향을 결정합니다. 작은 화살표 형태의 스캘핑 신호를 생성하는 알고리즘은 추세 파동 내에서 작동합니다. 빨간색 화살표는 상승 방향을, 파란색 화살표는 하락 방향을 나타냅니다. 민감한 가격 변동선은 추세 방향으로 그려지며, 작은 화살표의 신호와 함께 작용합니다. 신호는 다음과 같이 작동합니다. 적절한 시점에 선이 나타나면 진입 신호가 형성되고, 선이 있는 동안 미결제 포지션을 유지하며, 완료되면 거래를 종료합니다. 권장되는 작업 시간대는 M1~H4입니다. 화살표는 현재 캔들에 형성되며, 다음 캔들이 이미 시작되었더라도 이전 캔들의 화살표는 다시 그려지지 않습니다. 입
Meridian Pro
Ottaviano De Cicco
5 (1)
Meridian Pro: Professional Multi-Timeframe Trend Matrix for MT5 Overview Meridian Pro is a multi-timeframe trend matrix by Merkava Labs that compresses directional state, strength, momentum condition and matrix agreement into one compact panel. One adaptive engine, applied consistently from M1 to W1. No per-symbol tuning. No indicator stacking. One structured readout across every asset and every timeframe. Launch Offer — Get Meridian Pro for USD 99 (introductory). Regular price: USD 149. 1. Why
ON Trade Gann Squares MT5
Abdullah Alrai
5 (2)
간 스퀘어 지표는 W.D. 간이 쓴 "시장 예측을 위한 수학적 공식" 기사에 기반한 강력한 시장 분석 도구입니다. 이 도구는 수학적 개념과 간 이론을 사용하여 정확한 시장 분석을 수행합니다. 144, 90, 52의 제곱과 9의 제곱을 사용합니다. 또한 의 9의 제곱근 및 해당 제곱의 채널 및 스타 패턴과의 관련성을 통합합니다. 사용자 메뉴얼 및 적용: 이 지표를 사용하기 전에 사용자 메뉴얼을 읽고 질문이 있을 경우 문의하시기 바랍니다. 전체 메뉴얼은 웹사이트에서 제공됩니다. MT5의 전체 버전을 구매하거나 MT4의 무료 버전을 테스트할 수 있습니다. 두 버전 모두 링크에서 확인하실 수 있습니다. 주요 기능 및 기능: 간 스퀘어 지표는 정확한 결정을 위해 기하학적 개념과 간 이론을 활용하는 시장 분석을 위한 포괄적인 도구 집합을 제공합니다. 주요 기능은 다음과 같습니다. 9의 제곱 분석:   이 지표는 9의 제곱에 대한 수평 선, 스타 패턴, 그리드 및 간 팬을 그릴 수 있습니다. 간
Cvd Divergence
Thalles Nascimento De Carvalho
CVD Divergence – 전문적인 주문 흐름 및 다이버전스 분석 CVD Divergence는 가격과 Cumulative Delta Volume(CVD) 사이의 신뢰할 수 있는 다이버전스를 감지하기 위해 개발된 기술적 지표입니다. 실제 주문 흐름이 가격 움직임을 확인하지 않을 때를 정확하게 포착하여, 잠재적 추세 전환, 매수·매도 세력의 소진, 기관의 시장 조작 가능성을 보여줍니다. 이 지표는 공격적인 거래량 분석과 가격 구조 해석을 결합해 명확하고 객관적이며 빠른 신호를 제공합니다. 지표 기능 CVD Divergence는 누적 델타 거래량을 사용하여 주문 흐름의 방향과 가격 방향을 비교합니다. 두 값이 크게 괴리될 경우 차트에 시각적 표시를 남기고 다이버전스 방향을 명확하게 보여줍니다. 다음과 같은 상황을 감지합니다: 강세 다이버전스 (가격이 하락하지만 CVD가 상승할 때) 약세 다이버전스 (가격이 상승하지만 CVD가 하락할 때) 매수·매도 세력의 힘 고갈 기관 주문 불균형으로
Weltrade Spike Sentinel
Batsirayi L Marango
5 (1)
Introducing Indicator for PainX and GainX Indices Traders on Weltrade Get ready to experience the power of trading with our indicator, specifically designed for Weltrade   broker's PainX and GainX Indices.  Advanced Strategies for Unbeatable Insights Our indicator employs sophisticated strategies to analyze market trends, pinpointing optimal entry and exit points.  Optimized for Maximum Performance To ensure optimal results, our indicator is carefully calibrated for 5-minute timeframe charts on
Presenting one-of-a-kind Gann Indicator for XAUUSD IQ Gold Gann Levels is a non-repainting, precision tool designed exclusively for XAUUSD/Gold intraday trading. It uses W.D. Gann’s square root method to plot real-time support and resistance levels, helping traders spot high-probability entries with confidence and clarity. William Delbert Gann (W.D. Gann) was an exceptional market analyst whose trading technique was based on a complex blend of mathematics, geometry, astrology, and ancient calcul
Basic Harmonic Patterns Dashboard MT5
Mehran Sepah Mansoor
4.36 (11)
이 대시보드는 선택한 심볼에 대해 사용 가능한 최신 고조파 패턴을 표시하므로 시간을 절약하고 더 효율적으로 사용할 수 있습니다 /   MT4 버전 . 무료 인디케이터:   Basic Harmonic Pattern 인디케이터 열 Symbol :   선택한 심볼이 나타납니다 Trend :   강세 또는 약세 Pattern :   패턴 유형(가틀리, 나비, 박쥐, 게, 상어, 사이퍼 또는 ABCD) Entry :   진입 가격 SL:   스톱로스 가격 TP1:   1차 테이크프로핏 가격 TP2:   2차 테이크프로핏 가격 TP3:   3차 테이크프로핏 가격 Current price:   현재 가격 Age (in bars):   마지막으로 그려진 패턴의 나이 주요 입력 Symbols :   "28개 주요 통화쌍" 또는 "선택한 심볼" 중에서 선택합니다. Selected Symbols :   쉼표로 구분하여 모니터링하려는 원하는 심볼("EURUSD,GBPUSD,XAUUSD")을 선택
RelicusRoad Pro MT5
Relicus LLC
5 (24)
RelicusRoad Pro: 퀀트 시장 운영 체제 70% 할인 평생 이용권 (한정 시간) - 2,000명 이상의 트레이더와 함께하세요 왜 대부분의 트레이더는 "완벽한" 지표를 가지고도 실패할까요? 진공 상태에서 단일 개념 만으로 거래하기 때문입니다. 문맥 없는 신호는 도박입니다. 지속적인 승리를 위해서는 컨플루언스(중첩) 가 필요합니다. RelicusRoad Pro는 단순한 화살표 지표가 아닙니다. 완전한 퀀트 시장 생태계 입니다. 독점적인 변동성 모델링을 사용하여 가격이 이동하는 "공정 가치 로드"를 매핑하고, 단순 노이즈와 실제 구조적 돌파를 구분합니다. 추측은 그만두세요. 기관급 로드 로직으로 거래를 시작하세요. 핵심 엔진: "Road" 알고리즘 시스템의 중심에는 시장 상황에 실시간으로 적응하는 동적 변동성 채널인 Road Algo 가 있습니다. 세이프 라인(평형) 과 가격이 수학적으로 반전될 가능성이 높은 확장 레벨 을 투영합니다. Simple Road: 일반적인 시장을 위
우선적으로, 이 거래 도구는 전문적인 거래에 이상적인 비-다시 그리기 및 지연되지 않는 지표입니다.  온라인 강좌, 사용자 매뉴얼 및 데모. 스마트 가격 액션 컨셉트 인디케이터는 신규 및 경험 많은 트레이더 모두에게 매우 강력한 도구입니다. Inner Circle Trader Analysis 및 Smart Money Concepts Trading Strategies와 같은 고급 거래 아이디어를 결합하여 20가지 이상의 유용한 지표를 하나로 결합합니다. 이 인디케이터는 스마트 머니 컨셉트에 중점을 두어 대형 기관의 거래 방식을 제공하고 이동을 예측하는 데 도움을 줍니다.  특히 유동성 분석에 뛰어나 기관이 어떻게 거래하는지 이해하는 데 도움을 줍니다. 시장 트렌드를 예측하고 가격 변동을 신중하게 분석하는 데 탁월합니다. 귀하의 거래를 기관 전략에 맞추어 시장의 동향에 대해 더 정확한 예측을 할 수 있습니다. 이 인디케이터는 시장 구조를 분석하고 중요한 주문 블록을 식별하고 다양
Inrexea Indicator
Inrexea Limited
InrexEA Indicator Professional Multi-Timeframe Market Analysis for MetaTrader 5   Signal monitor :  https://www.mql5.com/en/signals/2368970 Overview InrexEA Indicator is a clean, professional chart overlay that combines 5 EMA trend lines , a real-time Market Dashboard ranking 8 symbols by daily strength, and a white background chart theme — all in one lightweight indicator. Stop switching between tools. See everything at a glance. Key Features 5 EMA Lines — Trend Analysis EMA 10 / 20 / 50 /
RFI levels PRO MT5
Roman Podpora
3.67 (3)
이 지표는 추세 반전 지점과 가격 반등 영역을 정확하게 보여줍니다.       주요 투자자들   . 새로운 트렌드가 형성되는 곳을 파악하고 최대한 정확하게 의사결정을 내리며 모든 거래를 완벽하게 통제합니다. TREND LINES PRO   지표와 함께 사용할 때 최대의 잠재력을 발휘합니다.  VERSION MT4 지표가 보여주는 내용: 새로운 추세의 시작 시 활성화되는 반전 구조 및 반전 수준. 최소한의 위험 대비 수익률을 갖는 이익 실현   (TAKE PROFIT)   및   손절매(STOP LOSS)   레벨 표시       RR 1:2   . 지능형 손실 감소 로직이 적용된 손절매 기능. 지정된 지표에서 두 가지 추세 유형에 대한 반전 패턴을 표시합니다. 지표: 트렌드를 따라   트렌드 라인 프로   (글로벌 트렌드 변화) 트렌드 프로   (빠른 트렌드 변화) 간단하고 효과적입니다       스캐너       실시간 추세 (신규). 다중 시간 프레임 도구 필터링. 표시하다  
PZ Support Resistance MT5
PZ TRADING SLU
3.71 (7)
Unlock key market insights with automated support and resistance lines Tired of plotting support and resistance lines? This is a multi-timeframe indicator that detects and plots supports and resistance lines in the chart with the same precision as a human eye would. As price levels are tested over time and its importance increases, the lines become thicker and darker, making price leves easy to glance and evaluate. [ Installation Guide | Update Guide | Troubleshooting | FAQ | All Products  | 
제작자의 제품 더 보기
Multi Time Frame Multi Currency Signals Dashboard (MT4) A powerful, all‑in‑one MT4 dashboard delivering instant, high‑probability trading signals across multiple currency pairs and multiple timeframes — all from one clean, centralized chart. The Multi Time Frame Multi Currency Signals Dashboard simplifies the way you analyze the markets by unifying signals, trend conditions, and key levels into a single view. Driven by an advanced multi‑timeframe trend algorithm, it scans dozens of symbols sim
Trendlines Chart Patterns Indicator (MT4) A powerful automated chart‑pattern and breakout detection system designed for traders who rely on precise price‑action signals. The Trendlines Chart Patterns Indicator simplifies advanced technical analysis into clean, actionable Buy/Sell signals. It automatically detects trend lines, chart patterns, and breakout structures — then confirms signals only when the market shows real strength through decisive breaks and validated swing‑level closes. With it
Scalp Arrow Exit Signals (MT4 Indicator) A powerful all‑in‑one MT4 indicator providing precise entries, exits, and re‑entries across any timeframe or trading style. The Scalp Arrow Exit Signals is a complete “black‑box” signal system engineered for MT4 traders who want clarity, speed, and reliability. It generates clean buy/sell arrows along with exit, re‑entry, retracement, and pull‑back entry signals — all supported by flexible alerts and customizable risk settings. Whether you scalp fast ch
Multi Trend Buy Sell Signal (MT4 Indicator) A precision‑engineered MT4 indicator delivering highly confirmed Buy/Sell entries using multi‑timeframe trend alignment, dual‑MACD filtering, and a robust Moving Average trend filter. The Multi Trend Buy Sell Signal is built for traders who want only high‑probability, fully confirmed signals. By combining one set of Moving Averages with two independent MACD confirmations on higher timeframes, this indicator filters out noise, avoids false signals, an
Multi Dashboard Scalper (MT4 Indicator) A powerful MT4 scalping dashboard built to reveal true market strength across currencies, commodities, and cross‑pairs — helping you make precise, high‑probability trading decisions in seconds. The Multi Dashboard Scalper analyzes global market strength using a proprietary calculation engine, giving you instant clarity on which currencies and markets are strong, weak, or range‑bound. By visually displaying strength percentages and highlighting optimal BU
Scalp and Swing Signals
Shiffolika Kapila
4.5 (2)
Scalp and Swing Signals (MT4 Indicator) A powerful non‑repainting signal system designed to capture precise reversal points and trend‑following entries across any market and any timeframe. The Scalp and Swing Signals indicator combines a robust dual‑line algorithm with real‑time alerting to help traders identify high‑probability setups at both trend cycle tops/bottoms and during strong trend continuations. With permanent, non‑repainting signals and an intuitive visual structure, traders can en
Reversal Area Indicator
Shiffolika Kapila
5 (2)
Reversal Area Indicator (MT4) A precision‑engineered MT4 indicator designed to capture market tops, bottoms, and re‑entry points using intelligent Support/Resistance zone detection and high‑probability reversal logic. The Reversal Area Indicator identifies dynamic reversal zones where price is most likely to react, giving you early, accurate Buy/Sell entries with extremely small Stop Losses and exceptional Risk‑to‑Reward potential. Optimized for fast‑moving charts (M1/M5) yet powerful enough f
Top Bottom Scalper
Shiffolika Kapila
Top Bottom Scalper (MT4 Indicator) A specialized MT4 tool engineered to pinpoint ultra‑accurate market Tops and Bottoms — perfect for forex scalping and binary options traders who demand precision and timing. The Top Bottom Scalper identifies major reversal points with exceptional accuracy and strengthens those signals using dynamic Support & Resistance zones of varying quality. Whether you trade quick reversals or fast binary setups, this indicator helps you enter at the exact moment price sh
Double Trend Signals
Shiffolika Kapila
Double Trend Signals (MT4 Indicator) A powerful, non‑repainting trend‑following indicator built to deliver clean, visually intuitive Buy signals powered by smart filtering and dual‑trend confirmation layers. The Double Trend Signals indicator simplifies trend trading by combining a unique impulse‑based trend filter with two SuperTrend confirmation layers. This multi‑filter design strengthens signal quality, filters out market noise, and gives traders confidently confirmed Buy opportunities. Ev
Reversal Signals Scalper Dashboard (MT4 Indicator) A powerful, multi‑purpose MT4 trading dashboard built to detect extreme market reversals, trend shifts, and high‑probability swing points across forex pairs, stocks, commodities, and more. The Reversal Signals Scalper Dashboard intelligently highlights when the market enters predefined overbought or oversold extremes—helping you anticipate reversal zones with precision. Combined with multi‑timeframe trend analysis, automatic chart opening, and
Matrix Price Action Scalper
Shiffolika Kapila
5 (1)
Matrix Price Action Scalper (MT4 Indicator) A powerful, zero‑lag MT4 scalping system built to deliver precise Buy/Sell entries and intelligent re‑entries using pure price action — no oscillators, no lagging indicators, just raw market movement. The Matrix Price Action Scalper is engineered for traders who want fast, accurate, and confirmed scalping signals backed by Higher Time Frame (HTF) trend direction. Its intelligent multi‑mode price action engine analyzes bar structures in real time, gen
Scalper Signals Trader (MT4 Indicator) A powerful, adaptable MT4 signal system designed for both rapid scalping and confident swing trading — with built‑in multi‑timeframe MACD confirmation for superior entry accuracy. The Scalper Signals Trader combines advanced dual‑algorithm logic with multi‑timeframe trend verification to deliver clear, reliable Buy/Sell entries and exits. Whether you prefer fast, aggressive signal flow or highly filtered, confirmation‑based entries, this indicator adapts
Smart Multi Systems
Shiffolika Kapila
Smart Multi Systems Indicator (MT4) A powerful all‑in‑one MT4 trading system offering an unmatched 21 Entry Strategies and 8 Exit Strategies , giving you the ability to trade any market condition with precision, flexibility, and confidence. The Smart Multi Systems Indicator is engineered for both new and experienced traders who want a complete technical‑analysis and signal‑generation toolkit inside one highly customizable MT4 indicator. From advanced reversal detection to trend‑following logic
Hni Scalp Swing Indicator (MT4) A versatile, precision‑driven MT4 indicator designed for both fast scalping and high‑quality swing trading , powered by a smart higher‑timeframe confirmation engine. The Hni Scalp Swing Indicator provides reliable Buy/Sell signals across any timeframe, supported by a robust higher‑timeframe filter that dramatically improves signal accuracy. Whether you trade aggressively on M1 or prefer smoother swing setups on H1/H4, this indicator adapts perfectly to your stra
Multi Trend Signal Dashboard (MT4 Indicator) A complete, visual trend‑trading system for MetaTrader 4 — built to help you instantly identify trend direction, trend strength, and actionable Buy/Sell opportunities across all timeframes. The Multi Trend Signal Dashboard transforms complex market behavior into a clean, intuitive interface that displays trend signals from M1 up to MN1. Perfect for scalpers, day traders, swing traders, and long‑term investors, this dashboard provides clearly defined
필터:
Levent Safak
1373
Levent Safak 2025.04.04 19:44 
 

Excellent indicator if you trade multi time frames. What works for me 4H/15 min setting.

리뷰 답변