Supply Demand levels
- 지표
-
Jan Flodin
 Hello, my name is Jan and I have been developing automated trading tools for the last 9 years. I am originally from Sweden but have lived in the Czech Republic since 2003.
PRODUCTS - 버전: 1.2
- 업데이트됨: 13 5월 2025
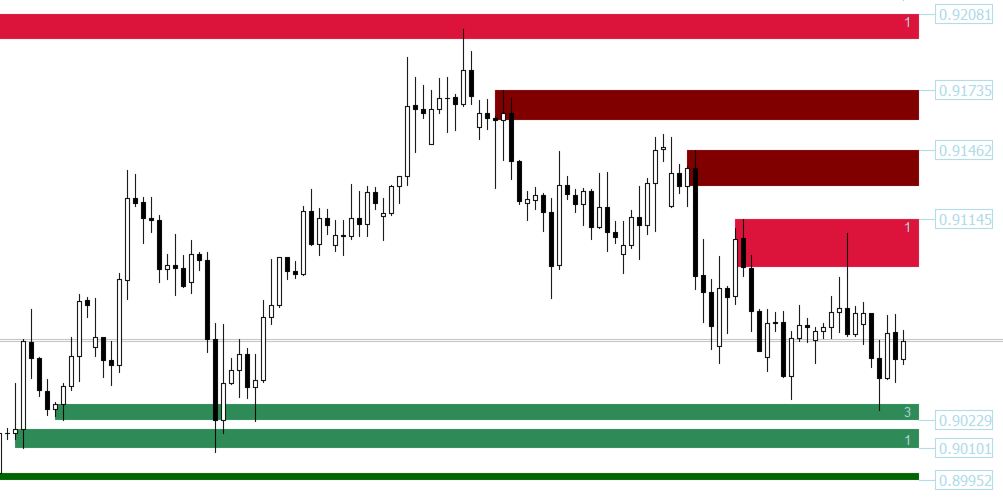
이 지표는 차트에 공급 및 수요 구역을 그립니다. 이 지표를 귀하의 규칙과 기술과 결합하면 귀하만의 강력한 시스템을 만들거나 개선할 수 있습니다. 훨씬 더 많은 것을 제공하는 유료 버전 도 확인해 보세요. 제 추천은 최소 25개 막대 이후에 첫 번째 구역 테스트가 발생하는 거래 기회를 찾는 것입니다.
특징
- 구역에는 3가지 색상이 있습니다(입력으로 조정 가능). 테스트되지 않은 구역은 어두운 색상, 테스트된 구역은 중간 색상 , 깨진 구역은 밝은 색상입니다 .
- 각 구역의 바깥쪽 경계 가격과 구역 테스트 금액은 각 구역에 적혀 있습니다.
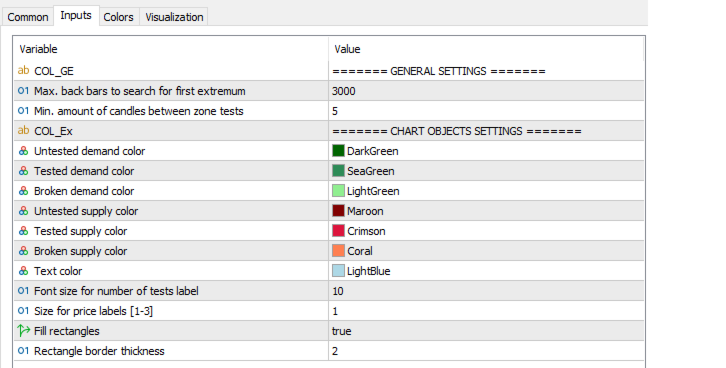
입력 매개변수
- 최대. 첫 번째 극값을 검색하기 위한 백바 - 기본값은 3000입니다. 시간 이전의 첫 번째 극값 xx 막대를 검색합니다. 값이 높을수록 더 많은 시스템 리소스가 필요합니다 . 느린 컴퓨터의 경우 500-1000 값이 더 적합할 수 있습니다.
- 존 테스트 사이의 최소 캔들 수
- 테스트되지 않은 수요 색상
- 테스트된 수요 색상
- 깨진 수요 색상
- 테스트되지 않은 공급 색상
- 테스트된 공급 색상
- 깨진 공급 색상
- 텍스트 색상
- 테스트 수 라벨의 글꼴 크기
- 가격 라벨 크기 [1-3]


отлично